March 2013

Economics and the debate on immigration

.647ZEconomics and the debate on immigration

By Michael Burke

Political parties in Britain have once more begun to talk about immigration, especially in the wake of the Eastleigh by-election. Unfortunately the debate is usually an all-informed one and typically just a cover to introduce racist notions about the impact of immigration. Therefore it is useful to examine some of the more important economic aspects of immigration.

Immigration

There are a number of countries in the world which have a higher per capita GDP than Britain. There are also a number of countries in the world who have a higher proportion of migrants as a proportion of the population. Both those facts are worth stating simply because discussion in Britain often seems to be dominated by the implicit assumption that Britain is both uniquely attractive to migrants and that it alone experiences immigration.

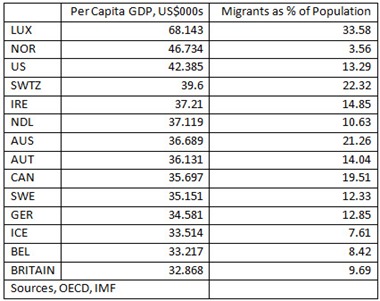
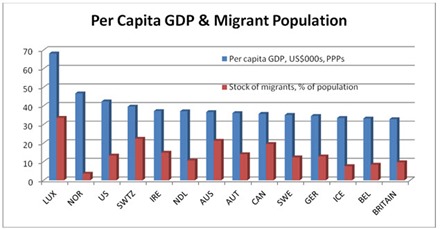
The chart below shows the countries with higher levels of per capita incomes than Britain. It also shows those countries proportion of the population which is migrant, that is not born in the host country. The table below specifies the data shown in the chart.

Chart 1

13 03 29 Chart 1

Table 1

13 03 29 Table 1

There are 13 countries in the world with a higher per capita income than Britain. Of these, 10 countries have a higher proportion of migrants. Some of these, such as Australia, Switzerland and Luxembourg have very much higher levels of immigration and have a much higher level of incomes.

There are 3 countries which have higher incomes but lower levels of immigration. However, of these 2 countries, Norway and Iceland have higher per capita GDP because they have a very large energy resource that comes pumping out of the ground (oil and geothermal energy). The remaining country is Belgium, whose geographic position means it has an exceptionally high proportion of people who work in Belgium but commute there from other countries.

By contrast, among the 18 OECD countries with a lower per capita income than Britain 12 also have a lower proportion of the population as migrants. The remaining 6 countries are small economies which generally have specific geographic or historical reasons for unusually high levels of immigration, or both. (The exception in this group is France).

Migration is part of growth

According to the IMF the total number of migrants in the world rose from 75 million people in 1965 to 195 million in 2005. Official data shows that most of that is to high income countries, about 80 million and most of the remainder to middle income countries.

The growth in the world’s migrant population is far more rapid than the growth in the total population. Over the same 40-year period to 2005, the world population doubled while the migrant population grew by 3 times.

However, this cross-border migration captures only a fraction of the world’s total migrant population. From a strict economic perspective there is little difference between cross-border migration and internal migration. This is especially the case when internal migration encompasses vast distances and differences of language or dialect.

According to China’s National Bureau of Statistics in 2008 there were 285 million internal migrants in China. This is far larger than the world’s total number of cross-border migrants. For the migrants themselves this frequently encompasses far greater geographical distances than is required, say, in intra-Western European migration. This level of migration is certainly the greatest level of internal migration in human history. It is also associated with the greatest rate of growth for any major economy in world history.

In India the level of internal migration is over 300 million people according to UNESCO. India’s medium-term growth rate is below that of China, but both countries have been growing at a rate considerably faster than the high income countries. The rate of internal migration has been a necessary accompaniment to high growth rates.

Correlation does not prove causality. But within the high-income countries higher levels of income are associated with higher levels of migration. Within the middle income countries, higher growth rates are associated with higher levels of internal migration.

Economic development depends on two key factors, the proportion of national income devoted to investment and increasing participation in the division of labour. Migration is a key part of the division of labour, allowing workers to migrate where production (and wages and jobs) are expanding. It also allows production to increase on the basis of employing the most adaptable workers.

Opposition to immigration

The government has recently produced a video to show potential migrants from Romania and Bulgaria that Britain is not a great country to emigrate to. There is a certain logic to this. The only way to stop immigration over the medium-term is to reduce the growth rate of the economy to zero or below. This is the basis for the government’s self-proclaimed success in reducing net migration in the most recent data; by curbing overseas students growth is directly reduced. Of course prolonged economic stagnation would also lead to a more rapid swelling of the 5 million British people who now live overseas.

Immigration of all types provides a substantial net benefit to the British economy, which a Home Office report clearly demonstrates. Growth attracts immigration but is also increased by it. The proportion of workers leaving a country will increases when there is an economic downturn and the proportion of the workforce arriving from overseas will tend to decrease. The reverse is also true: net immigration increases when the economy prospers.

There are a series of reactionary myths about immigration, which are perpetuated in the labour movement by outfits such as ‘Blue Labour’. These tend to focus on the supposedly local or microeconomic effects of immigration, particularly that they drive down wages. These arguments are a rehash of Labour notions which opposed the growth of women in the workforce and even supported restricting their wages relative to men.

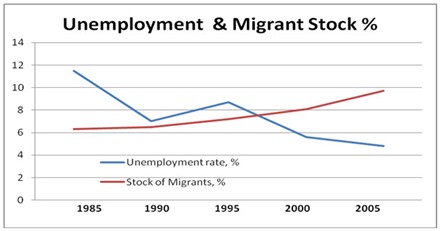
Jonathan Portes has done very good work in countering the assertions that immigration drives down wages, even for the very lowest paid workers in Britain. As the Home Office study shows, the average wages for migrant workers in Britain are also about 5% higher than British workers, because on average they are more highly qualified. The relationship between unemployment and immigration is also equally clear; immigration increases while unemployment falls and vice versa.

Chart 2

13 03 29 Chart 2

In reality the debate on immigration in Britain is not about the economic causes and consequences of immigration at all. It is overwhelmingly a ‘debate’ that allows politicians and others to whip up xenophobia and racism, while posing as being concerned about the interests of workers or the poor. The cause of migration is growth, to which migration is a decisive contributor. The consequence is stronger growth. The contrary argument is being raised now as a reactionary diversion from the current economic crisis, and the policies which are responsible for it.

Why China can maintain 8% growth

.377ZWhy China can maintain 8% growth

By John Ross

China’s National People’s Congress (NPC) has set a 7.5% official GDP growth target for this year. Lin Yifu, former Senior Vice-President and Chief Economist of the World Bank, and one of China’s most important economists, predicts that China can maintain 8% annual growth for 20 years. A key question is evidently whether such targets are realistic. Can China maintain this type of growth rate?

The immediate negative factors are evident. The international context for China’s economy this year is bad. The Eurozone economy is shrinking, Japan is stagnant and US growth is anemic. A 16% fall in world commodity prices since their peak has led to slower growth in major developing economies such as Brazil.

China’s policy makers initially underestimated the problems in the advanced economies. Adjusted for inflation, imports by developed economies have not regained pre-financial crisis levels. China therefore did not achieve its 2012 target of a 10% trade increase – the ctual rise was 6.2%. The lower 8% trade growth target set for 2013 is more realistic if still challenging. All major motors for growth will therefore have to come from China’s domestic economy.

In terms of strengthening China’s relative international economic position, and maintaining its ranking as the world’s most rapidly growing market, all this makes no difference. China is the world’s most open major economy, so it cannot cut itself off from international trends. China’s growth rate inevitably goes up or down with global economic fluctuations – the constant is that China strongly outperforms these trends.

To give more precise numbers, a rule of thumb of over 20 years, which successfully passed the test of events, is that China grows on average at whatever the advanced economies expand at plus 6% – the greater outperformance during the financial crisis was untypical. Developed economies this year will probably grow at around 1.5-2.0%, implying China will grow at 7.5-8.0% – in line with official forecasts. This is consistent with the official target of doubling the size of China’s economy between 2010 and 2020.

But for estimating expansion of China’s market, and growth of living standards, the absolute rate at which China’s economy develops is obviously key. It is therefore worth looking beyond short term ups and downs to the fundamental factors determining how fast an economy grows. This makes clear why China will achieve its 7.5-8% growth target. It also eliminates ‘manic-depressive’ analyses of China’s economy – periodic oscillating predictions of ‘hard landing’ and ‘rampant growth’ which appear in some parts of the media.

The current infatuation with examining consumption in China’s GDP is misleading in terms of analysing its economic performance. A country’s consumption growth is overwhelmingly determined by its GDP growth – internationally 87% of consumption increase is determined by the latter. If China’s GDP grows rapidly consumption will grow rapidly. If China’s GDP growth slows its consumption, over anything other than the very short term, will be lower than its potential with high GDP growth.

Every economy’s growth, including China’s, is necessarily determined by two key parameters: how much it invests and how efficiently that investment creates growth. Taking the five year average for 2006-2011, the latest internationally comparable data, China’s fixed investment was 43.1% of GDP, and it invested 4.1% of GDP for its economy to grow by a percentage point. Consequently, as a matter of simple arithmetic, China’s economy grew at an annual average 10.5%.

The lower the percentage of GDP invested for any given economic growth the more efficient that investment is. Furthermore, contrary to some myths, China’s investment is extremely efficient by international standards as the Table shows. For example in 2006-2011 China needed to invest 4.1% of GDP to grow by 1% whereas the US invested 24.3% – China’s investment was six times as efficient in generating GDP growth as the US. Even before the international financial crisis the US invested 7.0% of GDP to grow by 1% compared to China’s 3.4%. These key numbers determine how fast China’s economy grows.

Table 1

13 03 29 Efficiency of Investment


If China’s economy is to slow, as some critics argue, then it is necessary one or both of these key parameters changes. Either China’s percentage of investment in GDP must fall or the efficiency of its investment in generating GDP growth must decline – there are no other choices.

Taking first investment efficiency, the Table shows that almost all economies were negatively affected by the international financial crisis. China was no exception – the percentage of GDP which had to be invested for its economy to grow by a percentage point rising from 3.4% to 4.1%. But this deterioration was less than for most countries – the US figure rose from 7.0% to 24.3%, Germany’s from 8.2% to 18.4%.

China’s investment efficiency would have to fall greatly not to achieve its 7.5% growth target. If China’s recent investment level was maintained then the percentage of GDP it needs to invest to grow by a percentage point would have to rise to over 5.7% before China failed to hit its growth rate target. Maintaining China’s efficiency of investment is therefore a constant challenge for the government, but China has a considerable safety margin in setting its target growth. The government’s entire focus is on maintaining the efficiency of investment, not reducing it.

The other possibility for slowing China’s economy would be a sharp reduction in the percentage of investment in GDP. There are certainly some in China advocating reducing the level of investment in GDP, but not by nearly enough to prevent China hitting its growth targets. At its present level of investment efficiency China’s GDP growth rate falls by 1% for each 4.1% reduction in the percentage of fixed investment in GDP. But in the last 5 years China’s annual GDP growth averaged 10.5%. To reduce China’s GDP growth below 7.5% requires a fall in the percentage of investment of GDP of 10%. No serious figure in China, as opposed to a few Western analysts, advocates this. A fall in investment share of 2-4% of GDP, the type of figure sometimes advocated, would only slow China’s economic growth by 0.5-1.0%.

Therefore international economic headwinds are negative. But in both the efficiency of its investment and the percentage of investment in GDP China has considerable safety margins for achieving its growth targets – unless the administration makes very large errors the growth targets will therefore be met. Indeed, looking at these margins of manoeuvre, Lin Yifu’s 8% is perhaps more realistic that the government’s 7.5% – administrations always like to announce they have exceeded targets.

*   *   *

This article is slightly edited for an international audience from one which originally appeared in Shanghai Daily.

The logic of privatisation of the East Coast mainline

.975ZThe logic of privatisation of the East Coast mainline

By Michael Burke

The Coalition government has announced its intention to privatise the East Coast mainline rail network. The network was nationalised 3 years ago when the previous private operators discontinued their franchise because they could not make a profit.

The re-privatisation of the East Coast mainline highlights a key fallacy of the current government’s failed economic policy. It also sheds light on the role of the state in resolving the current crisis.

Real aims versus stated aims

The stated aim of government policy is to reduce the public sector deficit. George Osborne has swindled and fiddled the figures in a desperate attempt to hide the real position that the deficit is actually rising, including accounting for the assets of the Royal Mail pension fund but not their liabilities, counting government interest paid to the Bank of England as income and withholding payments to international bodies. All of these devices can only massage the deficit temporarily. They cannot produce either growth or, because of that, a lower deficit.

Investment in rail could form an important part of an investment-led recovery, which would also have the effect of reducing the growth in carbon emissions. But private companies struggle because they cannot continually increase profits while very large scale investments are required. They are certainly not in the business of depleting profits further to allow investment. All the large-scale investment in rail projects over the recent past has been led and co-ordinated by government. Returning the East Coast line to the private sector will not produce increased investment.

Privatisation will also undermine the stated objective of debt- and deficit-reduction. In public hands the line has returned £640mn over 3 years to public finances. With current very low returns on capital and low government borrowing rates this represents a very sizeable return. Government propaganda is that ‘we can either invest in rail, or the NHS’. In reality, investment in rail helps to pay for the NHS.

It is possible to establish the value of the rail line which is now on the chopping block. That can be done by using Net Present Value (NPV) methods. NPV simply values all investments from the cashflows they generate. £640mn over 3 years is about £215mn each year. Currently the government’s long-term borrowing rate is just under 1.9%. So, what sum of capital would be needed to yield £215mn a year to the government when interest rates are at 1.9%? If the interest rate is 1.9% and the actual return is £215mn, the NPV is £11.3bn (that is, 215 divided by 0.019).

Therefore any sale of the East Coast franchise for less than £11.3bn is very poor value, one which will see the deficit and the debt rise faster than if it were kept in public hands. The government will be lucky to get one-tenth of that value from a private sale. The giveaway has nothing to do with growth or deficit-reduction. It has everything to do with restoring the profits of the private sector, which is the purpose of austerity.

State versus private sector

This highlights a more general point. The East Coast network is worth far less to the private sector than the public sector. It must pay a far higher rate of interest than the government, so the NPV of any major asset is lower to the private sector.

In addition, the private sector must provide a profit to shareholders. These are funds that cannot be used for necessary investment. As a result, under privatisation, the government subsidy to the rail industry (which is almost wholly for capital investment) has actually risen in real terms to £3.9bn last year from £2.75bn in the late 1980s when it was in public hands.

The private sector is unable or unwilling to make the necessary investment in the rail infrastructure. Its overriding objective is to provide a return to shareholders. The greater risks associated with the private sector mean that the state is better placed to make those investments. The real alternative, aside from government propaganda, is that the state has to fund this capital investment in either event. Keeping rail in the public sector, and taking the remainder into public ownership is simply a cheaper and more efficient option.

The same logic also applies to a series of other industries including energy, telecoms and post, house building and large-scale construction, education, and banking.

The logic of privatisation of the East Coast mainline

.407ZThe logic of privatisation of the East Coast mainline

By Michael Burke

The Coalition government has announced its intention to privatise the East Coast mainline rail network. The network was nationalised 3 years ago when the previous private operators discontinued their franchise because they could not make a profit.

The re-privatisation of the East Coast mainline highlights a key fallacy of the current government’s failed economic policy. It also sheds light on the role of the state in resolving the current crisis.

Real aims versus stated aims

The stated aim of government policy is to reduce the public sector deficit. George Osborne has swindled and fiddled the figures in a desperate attempt to hide the real position that the deficit is actually rising, including accounting for the assets of the Royal Mail pension fund but not their liabilities, counting government interest paid to the Bank of England as income and withholding payments to international bodies. All of these devices can only massage the deficit temporarily. They cannot produce either growth or, because of that, a lower deficit.

Investment in rail could form an important part of an investment-led recovery, which would also have the effect of reducing the growth in carbon emissions. But private companies struggle because they cannot continually increase profits while very large scale investments are required. They are certainly not in the business of depleting profits further to allow investment. All the large-scale investment in rail projects over the recent past has been led and co-ordinated by government. Returning the East Coast line to the private sector will not produce increased investment.

Privatisation will also undermine the stated objective of debt- and deficit-reduction. In public hands the line has returned £640mn over 3 years to public finances. With current very low returns on capital and low government borrowing rates this represents a very sizeable return. Government propaganda is that ‘we can either invest in rail, or the NHS’. In reality, investment in rail helps to pay for the NHS.

It is possible to establish the value of the rail line which is now on the chopping block. That can be done by using Net Present Value (NPV) methods. NPV simply values all investments from the cashflows they generate. £640mn over 3 years is about £215mn each year. Currently the government’s long-term borrowing rate is just under 1.9%. So, what sum of capital would be needed to yield £215mn a year to the government when interest rates are at 1.9%? If the interest rate is 1.9% and the actual return is £215mn, the NPV is £11.3bn (that is, 215 divided by 0.019).

Therefore any sale of the East Coast franchise for less than £11.3bn is very poor value, one which will see the deficit and the debt rise faster than if it were kept in public hands. The government will be lucky to get one-tenth of that value from a private sale. The giveaway has nothing to do with growth or deficit-reduction. It has everything to do with restoring the profits of the private sector, which is the purpose of austerity.

State versus private sector

This highlights a more general point. The East Coast network is worth far less to the private sector than the public sector. It must pay a far higher rate of interest than the government, so the NPV of any major asset is lower to the private sector.

In addition, the private sector must provide a profit to shareholders. These are funds that cannot be used for necessary investment. As a result, under privatisation, the government subsidy to the rail industry (which is almost wholly for capital investment) has actually risen in real terms to £3.9bn last year from £2.75bn in the late 1980s when it was in public hands.

The private sector is unable or unwilling to make the necessary investment in the rail infrastructure. Its overriding objective is to provide a return to shareholders. The greater risks associated with the private sector mean that the state is better placed to make those investments. The real alternative, aside from government propaganda, is that the state has to fund this capital investment in either event. Keeping rail in the public sector, and taking the remainder into public ownership is simply a cheaper and more efficient option.

The same logic also applies to a series of other industries including energy, telecoms and post, house building and large-scale construction, education, and banking.

John Rosshttps://www.blogger.com/profile/08908982031768337864noreply@blogger.com0

The Tories will get 29.8% of the vote at the next General Election – here is why

.834ZyesThe Tories will get 29.8% of the vote at the next General Election – here is whyBy John Ross

A lot of purely short term reasons and ‘lessons’ of the Eastleigh by-election are being drawn. None of these are of particular importance. The key reality is that crushing defeat of the Tories is simply part of the trend of Tory electoral  decline which I have analysed many times since I published Thatcher and Friends in 1983. This also enables it to be predicted that the Tory Party will get 30.3% of the vote at the next general election. This aim of this article is to explain why.

The continuing decline of the Tory vote from 1931 to 2010 is shown in Figure 1. This demonstrates that while there have been short term oscillations from election to election, which help produce individual Tory victories or defeats, the steady downward trend of support for the Conservative Party is evident. In 1983 when I first showed this it was greeted with widespread scepticism. But 30 years later the continuation of this Tory decline is evident.

Typically the Conservative vote, each time the party won a general election, was lower than at the one it won previously, and each time it lost an election its vote fell to a lower level than the previous defeat.

The result of the Tories at the 2010 election, at 36.1% of the vote, is 5.8% below the level they received the last time they were the largest party. In victories the Conservative vote has fallen progressively from its highest ever level, of 60.7% in 1931, to its post-World War II peak of 49.6% in 1955, to 41.9% the last time it won a majority of seats in an election in 1992.

The decline in the Tory vote can be calculated from a rather simple arithmetic formula. The Tory vote declines at 0.2% a year between defeats and by 0.26% a year between victories. There is a swing factor of slightly under 5% between defeat and victory. That is if the Tories won they would get 34.8% of the vote and if they lose they will get 30.3% of the vote.
John Rosshttps://www.blogger.com/profile/08908982031768337864noreply@blogger.com0