June 2023

Let’s get out from under the carbon military boot print

By Paul Atkin

Irrespective of what stance you take on the war in Ukraine, or anywhere else, in March last year, US author Meehan Crist wrote the following in the London Review of Books, “One of the worst outcomes of the war in Ukraine would be an increasingly militarised response to climate breakdown, in which Western armies, their budgets ballooning in the name of “national security” seek to control not only the outcome of conflicts but the flow of energy, water, food, key minerals and other natural resources. One does not have to work particularly hard to imagine how barbarous that future would be”.

Crist’s point is simply to describe the world we already have, but a bit more so; and her prediction is exactly what is happening.

  • The US has raised military spending to $858 billion this year; up from $778 billion in 2020.
  • France has announced an increase from a projected E295 billion to E413 billion in the next seven years (an average of E59 billion a year).
  • German spending is rising sharply, from E53 billion in 2021 to E100 billion in 2022 and is set to go further.
  • Japan aims to double its military spending by 2028 and is also debating whether to start deploying nuclear weapons.
  • In the UK, the government’s aim to increase military spending from 2.1% of GDP to 2.5% by 2030 comes on the back of what is already among the highest per capita military spends in the world.
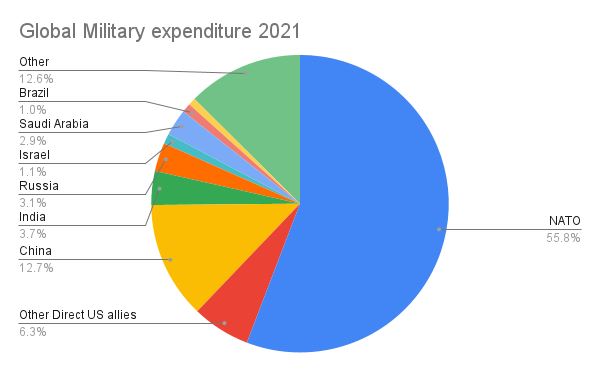
  • NATO, the core alliance of the Global North, already accounted for 55.8% of global military spending in 2021 before any of these increases.
  • Other direct US allies – with a mutual defence pact – accounted for another 6.3%.
  • So, the direct US centred military alliances account for three fifths of global military spending and yet they are now raising it further at unprecedented rates. These are the world’s dominant imperial powers, acting in concert to sustain a “rules based international order” in which the rules are written in, and to suit, the Global North in general and Washington in particular.

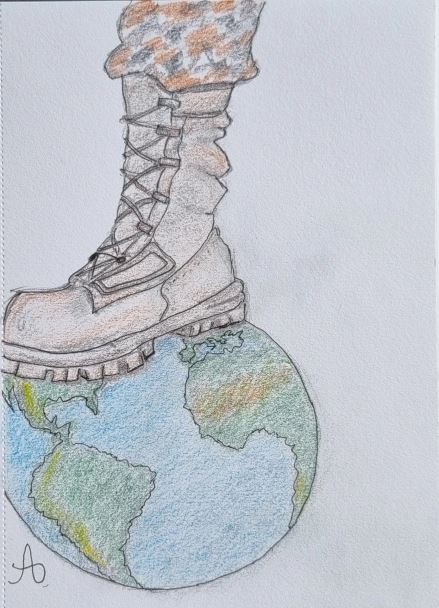
The carbon boot print of these militaries is not measured under the Paris Agreement. It is, nevertheless, huge and growing; and we can’t pretend it isn’t. At the moment, the carbon boot print of the US military alone is the same as that of the entire nation of France. This is incompatible with stopping climate breakdown; both in the direct impact of production and deployment, the diversion of funds which are urgently needed to invest in the transition, and the potential impact of their use – which could kill us all very quickly; particularly if nuclear weapons are used. John Bellamy Foster’s Notes on Exterminism for the Twenty First Century Ecology and Peace Movements should be required reading for both movements.

Because this military is not sitting idle. The first phase of the Wars for the New American Century – in the form of the War on Terror since 2001 – have been calculated by Browns University at 4.5 million people; three quarters of them civilians killed by indirect impacts of US and allied military interventions. The scale of this is because doctrines like “shock and awe” are not simply an impressive displays of explosive power, but specifically designed to smash energy and water systems, both clean water supply and sewage treatment, within the first twenty four hours of an intervention to reduce surviving civilian populations to a state of numbed misery and demoralisation. “Why do they hate us?” I wonder. 4.5 million people is about half the population of Greater London, or three quarters of the population of Denmark and twenty two times as many as have died in the Ukraine war so far (assuming total casualties of 200,000, most of them military on both sides). It’s a lot of people. *

Their deployment and use more widely against opponents that are more resilient than Iraq, Afghanistan or Libya- which this escalation of expenditure and increased integration of alliances makes possible – would, even if it did not go nuclear, be catastrophic both in its direct loss of lives but also in the disruption of global supply chains leading to widespread economic unravelling. According to the Australian Strategic Policy Institute, a war in the South China Sea that closed down shipping lanes would have a rapid impact regionally – “Taiwan’s economy would contract by a third, while Singapore’s economy would fall by 22%, according to the baseline estimate. Hong Kong, Vietnam, the Philippines and Malaysia would suffer falls of between 10% and 15%” – but would have a knock on effect everywhere else affecting 92% of global trade. The attempt in the Global North to set up “secure supply chains” – defining economic policy increasingly around military imperatives (“securonomics”) is not to avert such a conflict, but to make it economically manageable, and therefore more likely.

This scale of military expenditure also dwarfs their domestic investment in combatting climate change, urgently needed because the wealthiest countries put the heaviest weight of emissions on the rest of the world, both historically and through their per capita footprints now: let alone helping Global South countries develop without reliance on fossil fuels. This has a wider implication, with the UN Sustainable Development Solutions Network reporting that progress towards the UN Sustainable Development goals has been static for three years.

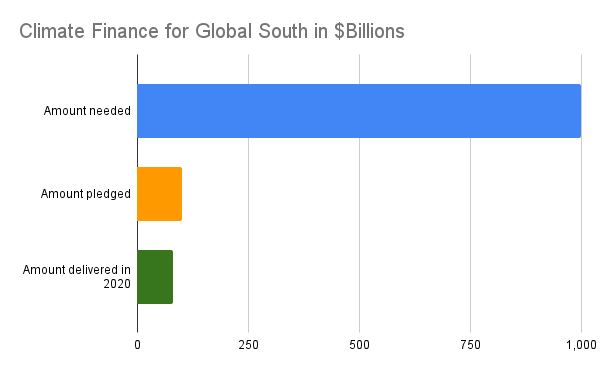
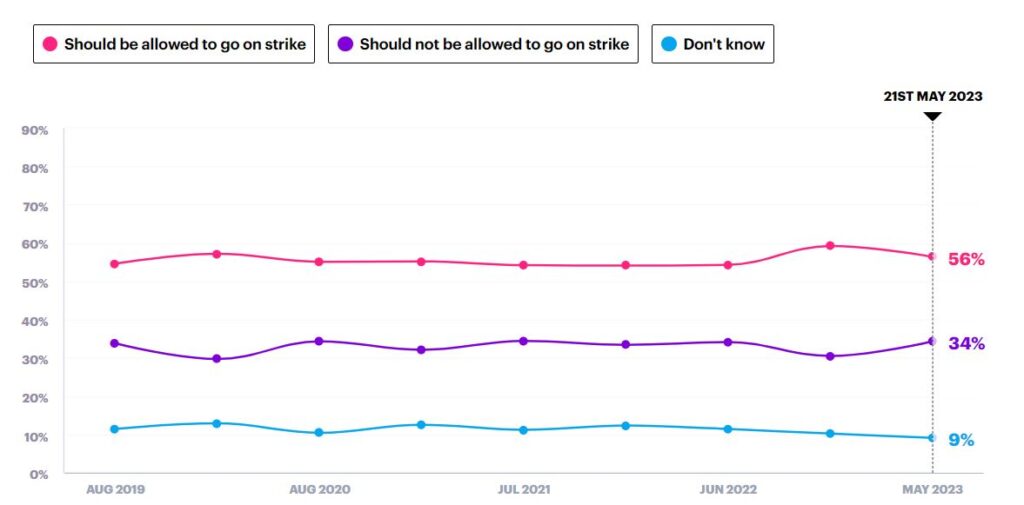
Pledged to commit $100 billion a year to help the transition in the Global South, more than ten years ago, they have never been able to eke out this money, have never hit the target, have tried to use loans (debt trap) instead of transfers, sought to apply conditions and control. The US contribution to that is now aiming for just over $11 billion by 2024. This is now reckoned to be a tenth of what’s needed. This is despite 66% of their populations agreeing that this support should go in, and only 11% against. The contrast with the $77 billion they have stumped up to fight the Ukraine war with no trouble at all in the last year is quite startling. News that Finland is planning to cut development aid to countries in Africa that don’t line up behind the Western line on Ukraine is an ominous sign of how far backwards this could begin to go; with any attempt at global governance through structures like the UN abandoned and notions of international obligation and mutual humanity giving way to even more overtly colonial attitudes and practices than we already have. Although the notion that the Global North can “build a wall” and keep the human consequences of climate breakdown out is a fantasy – as the climate is breaking down behind the wall too – it probably won’t stop them trying.

The USA and its allies pose themselves as “Global Leaders”. They could and should be, as they are the countries with the greatest concentrations of wealth, power and technical know how, communications and education, but they are falling horribly short; because they see leadership as the same thing as dominance – and subordinate everything else to that.

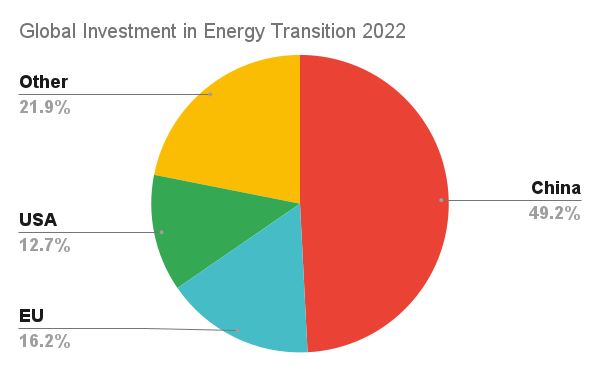
In fact, in 2022, China – usually presented in our media as a negative force on climate – invested 70% more in renewable energy generation than the USA and EU combined, just under half the global total on its own. Next year, according to the International Energy Agency, China will account for 70% of new offshore wind, 60% of new onshore wind, and 50% on new solar PV installations. So, the “international leaders” have a lot of catching up to do.

The US and EU are some way behind, and nowhere near where they need to be. Instead of investing on the scale needed to hold the global temperature increase below 1.5C, they are tooling themselves up militarily to try to deal with the consequences of failing to do so; in an effort to sustain their global dominance. If they are leading us anywhere, its to Armageddon.

A report from the US military in 2019 sums up the paradox. Reflecting that, if climate breakdown continues at its present rate, countries that are already water stressed will be getting beyond crisis point within two decades and that this will lead to “disorder”. Their conclusion was that this means that

1. they will be intervening in these crises, and

2. will therefore need to build themselves in a secure supply chain of water so that the troops who are dealing with people in crisis because their environment has run out of it, will have enough to keep them going in the field!

Reflecting further, that on our current trajectory, climate impacts within the United States itself would lead to infrastructure breaking down, followed by the social order breaking down, followed by the military itself breaking down; as it faced overstretch trying to maintain order as civil society failed. Nevertheless, they also note that the rapidly increasing melt of the Arctic ice shelves and permafrost means that new sources of the fossil fuels that are causing the crisis in the first place to be available for exploitation and that a key task for them would be to make sure that the US gets the lion’s share of them. As a study in self defeating thinking, it can’t be beat.

To repeat the point at the beginning, regardless of anyone’s stance on any given war taking place now, and who should “win” it, its this drive and acceleration of military spending that the climate and peace movements should be combining to hold back – both to avert the growing risk of conflict, because arms races tend to end in wars on the momentum of their own dynamic (which requires a lot of demonisation and conflictual stances to fuel and justify it) and to allow saved funds to be used to avert the climate crisis itself. A bottom line demand is that the military carbon boot print must be accounted for in the Paris Process and a mechanism agreed for reductions to a common per capita level, combined with common measures and investments for increased global cooperation in lock step with it.

*Casualty figures in Ukraine are easy to come by but hard to trust. 200,000 assumes a parity between the Ukrainian and Russian militaries; whereas figures from Mossad, among others, indicate significantly lower Russian losses (at perhaps a fifth to a third of the Ukrainian level) so 200,000 may be a high estimate. One notable feature of this war is that civilian casualties have been a fraction of the military losses – the opposite of the trend from the mid twentieth century onwards; during which “there has been an increase in civilian fatalities from 5% at the turn of the 19th century to 15% during World War I (WW I), 65% by the end of World War II (WW II), and to more than 90% in the wars during 1990’s, affecting more children than soldiers”. From https://www.frontiersin.org/articles/10.3389/fpubh.2021.765261/full#B12

The above article was originally published here on Urban ramblings.

The trends are becoming clearer – British public support the strikes

By Kerry Abel

In March Ipsos last published polling outlying public attitudes towards strike action but hasn’t followed up, despite rail strikes ongoing into June 2023 and nurses and junior doctors engaged in ballots for pay and against the under-funding of the NHS. Much of the media coverage has trailed off too. We can assume this is because all the trends show that working people standing up for fair pay through their trade unions still have support from the public.

It was clear at the height of the cost of living, trade union fight back when inflation was high and pay offers were low or non-existent that the Conservative government hoped to rely on the old tropes of blaming hard line unions and that the public would fall in line and agree with how inconvenient it all was. This has led the Tories to putting the Minimum Service Levels Bill through Parliament instead of focus on the job at hand of talks to resolve the disputes.

The public however didn’t agree and vox pop after vox pop showed the general public reluctant to disagree with the trade unions. Faced with a barrage of scandals from the Tory party over their handling of the pandemic, aided and abetted by a decade of Conservative austerity, when asked to choose on balance who they side with, the side that has come out winning in 2023 is trade unions.

What the polling says

YouGov provides some evidence of the trends over the last year, all pretty much saying the same thing. 

When asked a series of questions from several angles about support for trade unions, which sections of industry should be allowed to strike and where the Labour Party – the party set up by the trade union movement – analysis of the results point us in the same direction.

The chart below, from YouGov, tracks the opinions of all adults. For further details visit the YouGov site here: Do Trade Unions play a positive or negative role in Britain today?

The view that trade unions play a positive role has had greater support than the view that they play a negative role this last 12 months. Those thinking they play a positive roll edging up from 32% – 38% since June 2022 and those thinking trade unions play a negative role has also risen, from 26% to 33%. Despite the negative trend going up over 12 months, this has dipped since November 2022, the period which saw most of the strikes.

When YouGov asked for a breakdown of which workers should be able to strike, all groups of workers who’ve taken strike action over the last year were supported by 50% or more in May 2023, including doctors, nurses, rail and Tube workers, teachers, civil servants and air traffic controllers. In each of these groups of workers more people thought they should be allowed to take strike action than those who thought they should not be allowed. The only group of workers where more thought they should not be allowed to take strike action were police officers, however even here those who support police being allowed to strike has increased this past year from 38% to 44%. The charts below, from YouGov, tracks the opinions of all adults. For further details visit the YouGov site here.

When asked if trade unions face too many restrictions, public opinion has marginally more shifted towards the government’s view than the union as to whether it is too hard or too easy for the unions to take strike action, meaning slightly more have believed the government than the trade union side in the media battle of words on this issue. The chart below, from YouGov, tracks the opinions of all adults. For further details visit the YouGov site.

Whether the Labour Party – the party set up by the trade union movement – should align more closely with the trade unions. Analysis of the results point us in the same direction (see here: What relationship should Labour have with the Trade Unions?) And whilst it’s true that the highest percentage was ‘don’t know’. From those who did answer, those who think there should be a closer relationship has gone up starkly from 16% in June 2022 to 23% in May 2023 and those who think the link should be more distant or broken have gone down significantly losing 5 points and 4 points respectively in the same time period. The chart below, from YouGov, tracks the opinions of all adults. For further details visit the YouGov site.

The case is made by the government that trade unions are anachronistic and out of touch, however the public think differently. When asked Do Trade Unions reflect ordinary working people in Britain today? support for trade unions has gone up marginally in a year. Considering this has been a year of a huge upswell in strike action that has undoubtedly affected British people in the pocket, their travel and their healthcare, this is no small trend. And those saying they don’t think trade unions reflect working people has dipped since the strikes got going. The chart below, from YouGov, tracks the opinions of all adults. For further details visit the YouGov site.

The world economic crisis is caused by G7 policy, causing hardship in the richest countries, misery in the Global South

By Michael Burke

The world economy as a whole is suffering a period of significant economic slowdown and surging prices. The effects of these trends are uneven. In general workers and the poor in the richest countries are getting poorer as real incomes fall. In many countries of the Global South the situation is much worse, with outright misery commonplace along with the growth in hunger.

The causes of the crisis have generally been obscured. A number of spurious explanations have been put forward as to the cause of the crisis; the war in Ukraine, ‘bottlenecks’, wage inflation, even bad weather.

The true cause of the crisis was the synchronised economic stimulation policies of the G7 countries, both monetary and fiscal policy, without any corresponding increase in Investment. Equally, as the G7 countries have largely been unwilling to unwind or reverse these policies the crisis has persisted for far longer than many had hoped or forecast. Inflation has generally remained persistently higher than forecast, and the policy response of higher interest rates will only exacerbate the slowdown without addressing the underlying cause of inflation.

Unless that policy mix in the G7 changes, prices will continue to rise at a destructive rate even as inflation slows and the world economy will remain sluggish or stagnant. Yet there is no sign of current policy being reversed.

Instead, there is a general trend, which began in the US to add protectionism to the toxic mix. This was marked by the introduction of the US’s ironically named ‘Inflation Reduction Act’, which is thoroughly protectionist. Other G7 countries and the EU as a whole are responding in kind. This is a recipe for deepening economic crisis, not alleviating it.

Exploding Myths

The myths about the causes of the crisis are now so well-established in both economic debate and popular discussion that it is necessary first to debunk them. Fortunately, this is a relatively easy task, by reference to the facts.

Chart 1. below shows the year-on-year growth rate of consumer prices (CPI) in the US economy. US CPI growth hit a low of 0.2% in May 2020 as the economy had slowed sharply following the failed attempts in curbing the Covid virus and lockdown. But once lockdown was ended and (as we shall see) economy policy changed, then US prices started to rise rapidly. By February 2022 CPI had reached 8%, and eventually peaked a few months later at 8.9%.

Chart 1.  US Consumer Price Inflation (percentage change, year-on-year)

February 2022 is an important date in the mythology of the current crisis, because it was at the end of this month that Russian forces moved into Ukraine and began this phase of the military conflict. The logical problem with ascribing the surge in prices to the war, as most Western commentators have done over a prolonged period, is that the inflation wave began almost two years earlier, in May 2020 as the Chart shows.

In addition, the bulk of the rise of in prices took place before the war, from 0.2% to 8%. Finally, inflation has actually been subsiding for most of duration of the war, from June 2022 until now.

A similar pattern is identifiable in the other advanced industrialised economies, with some national variation, as shown in Chart 2 below. The rise in inflation was not caused by the war. So the claims by President Biden and other who have called it, ‘Putin’s gas price rise’, are simply to deflect responsibility.

At most, some prices of some important commodities received an initial push higher because of the war, but that effect has long subsided.

Chart 2. US Consumer Price Inflation (percentage change, year-on-year)

The rise in inflation was not caused by the war

Another of the widespread false explanations offered is that there was a sharp rise in ‘bottlenecks’ that occurred during the lockdowns in the G7 countries and elsewhere. All manner of supply disruptions did take place during the lockdowns. But it is possible to discount genuine factors such as the difficulty of shipping finished goods, for example. An unwanted build-up of unsold finished goods would have the effect of lowering prices, as producers discounted prices to shift goods.

Conversely, if producers cannot easily access either basic commodities or intermediate goods (goods which require further manufacture before they become a finished good), then they will tend to bid up prices and so add to inflationary pressures.

Yet, according to data from the World Trade Organisation (WTO) the shortage of these inputs was both shallow and short-lived. Production bottlenecks did not cause the rise in global prices, as shown in the WTO chart reproduced below.

Chart 3. World Exports of Commodities and Intermediate Goods, quarterly, US$ trillions

Source: WTO

The remaining explanations advanced include the weather and wage inflation. It seems inevitable that climate change will cause large-scale and severe economic disruption. But the climate crisis is a continuous process and there are no specific weather patterns which would have caused such a sharp, global rise in prices. This is especially true as the major commodities initially leading prices higher were oil and gas. Climate change cannot explain the slow decline in inflation which is under way.

In contrast, there has been the rise in widespread labour shortages reported in many countries, and a genuine labour component of what can be described as ‘bottlenecks’. However, in the G7 countries which have led prices higher, there is no evidence of an effect on prices, particularly the price of labour.

Instead, what has taken effect is a large downward pressure on real wages in many of the G7 countries. This is inexplicable to those who argue that wages are set by the laws of ‘supply and demand’. If that were true shortages of labour would lead to higher wages. In reality, wages are set through the all-round struggle between classes. The policy pursued by the G7 governments is to lower real wages.

Chart 4. below is reproduced from the International Labour Organisation (ILO) Global Wage Report 2022-23.

It shows the medium-term growth in real wages globally. 2022 was unprecedented in falling global real wages. This did not occur even in the Global Financial Crisis of 2007-08. (Note too that global real wage growth in real terms is on average 0.6% lower when China is excluded. So much for the idea that China’s high levels of Investment are detrimental to popular prosperity).

Chart 4. Global Wage Report 2022-23 (ILO)

G7 policy caused this crisis

This factor is crucial in understanding the dynamic of the current crisis. Through the mechanism of inflation, in which real wages and other fixed incomes are lowered while profits are allowed to rise sharply, there is a sharp redistribution of incomes from workers and the poor towards big business and the rich.

The subsequent policy of raising interest rates by the central banks is billed as curbing an inflation that was created by official policy. But the further effect of those interest rate rises is to transfer incomes and wealth from small businesses, mortgage-holders and consumers to banks, big businesses and the owners of capital.

Naturally, G7 governments themselves are reluctant to accept the blame for the crisis. This leads to the string of explanations that have been offered that do not at all correspond to the facts.

However, in some of the more secluded areas of public debate where policy is discussed by those who advise policy makers in the leading economies and away from mass access, the veil has occasionally been lifted to reveal the true picture.

Below are small extracts from two research papers, which speak for themselves:

“Our findings suggest that fiscal stimulus boosted the consumption of goods without any noticeable impact on production, increasing excess demand pressures in good markets. As a result, fiscal support contributed to price tensions. Indeed, focusing on inflation through February 2022 which does not capture many disruptions associated with the war in Ukraine, we show that countries with large fiscal stimulus, or with high exposure to foreign stimulus through international trade, experienced stronger inflation outbursts.”

Fiscal policy and excess inflation during Covid-19: a cross-country view, FEDS Notes, Board of Governors of the Federal Reserve System

And

To mitigate the health and economic fallout from the COVID-19 pandemic, governments worldwide engaged in massive fiscal support programs. We show that generous fiscal support is associated with an increase in the demand for consumption goods during the pandemic, but industrial production did not adjust quickly enough to meet the sharp increase in demand. This imbalance between supply and demand across countries contributed to high inflation. Our findings suggest a sizable role for fiscal policy in affecting price stability, above and beyond what a monetary authority can do.”

Demand-Supply Imbalance in the COVID-19 Pandemic: The Role of Fiscal Policy, Economic Research, Federal Bank of St Louis

Here the central bank economists and analysts could not be clearer: It was the role of G7 governments in stimulating the economy without any corresponding increase in production which caused inflation. Or, it can be put in another, starker way. The policy in the G7 was to stimulate Consumption, not Investment and the result was inflation.

However, it has been left to one of the world’s most senior central bankers to admit the role of the central banks’ monetary policy, not just government fiscal policy, in causing inflation:

“….monetary and fiscal policy stimulus deployed during the pandemic gave inflation an even larger, and certainly more enduring, unexpected push. As a reminder, policy interest rates were lowered to zero, and often below. Central bank balance sheets ballooned. Fiscal stimulus since the start of the pandemic has exceeded 10% of GDP in many advanced economies – a push previously seen only in wartime.”  –

Monetary and fiscal policy as anchors of trust and stability, speech by Agustín Carstens, General Manager, Bank for International Settlements, at Columbia University, New York, 17 April 2023.

In fact, it has for some time been shown that it was G7 policy, both excessive government Consumption and monetary stimulus without Investment, which was the real cause of the crisis. Under the self-explanatory title, Global economic destabilisation was made in the US not in Ukraine, John Ross demonstrated that it was the reckless monetary and fiscal policies of the US which was the main cause of the crisis.

To this we can now add the following subsidiary but important points:

  • This completely reckless policy was shared across the G7 in varying degrees
  • All other explanations for the crisis have been shown to be false
  • That the crisis was caused by G7 policy is now admitted, discreetly, by the central bankers themselves.

What next?

The G7 central bankers have decided to attempt to curb inflation by increasing borrowing costs rather than reining in excessive monetary stimulus or publicly suggesting that governments do the same with fiscal stimulus (which has overwhelmingly gone to big business). Never once have they suggested addressing the ‘demand-supply’ imbalances they have identified by increasing supply, that is, by significantly increasing Investment.

In the process of pushing interest rates higher, it is widely understood that interest rates charged to borrowers have risen far greater than the savings rates. The result is a huge increase in the profit margins of the banks. Just as with the profiteering of energy firms and both food producers and retailers who have taken advantage of the initial price surge by fattening profit margins, G7 governments could step in and impose price controls and windfall taxes, nationalising those who will not comply. But they have chosen not to.

This itself reveals that the current crisis is an all-round class offensive, which in a period of economic stagnation blatantly enriches further big business and the rich at the expense of impoverishing workers and the poor.

As noted earlier, this same offensive now includes increasing protectionism. Biden explicitly sold the Inflation-Reduction Act as a measure to protect household incomes and American jobs. It will do precisely the opposite.

Trump’s earlier protectionism raised prices and did nothing to protect jobs. As tariffs are paid either by importing businesses or consumers, domestic prices rise. At the same time, jobs tend to be exported to lower-tariff markets. Trump boasted that his protectionism would push GDP growth to 4% or above. In reality, average annual growth in his presidency was under 2.3% and continued the long downtrend in US growth rates.

This was predictable and predicted. That type of protectionism (of existing industries) has never worked, and the last time it became universal policy in the industrialised countries in the 1930s it led directly to slump followed by world war.

Bidenomics embraces Trump’s protectionism on a larger scale. European and British leaders pretend to welcome the measures while pleading for special treatment and exemptions.  The upshot of this protectionism will be slower growth, fewer good jobs and higher prices than there would have been otherwise.

Global South debt

Yet, despite this level of economic difficulties, it is many countries in the Global South which will bear the brunt of the G7-induced crisis. In its recently released Global Economic Prospects the World Bank suggests that the economic growth of the Global South excluding China will fall from 4.1% in 2022 to 2.9% in 2023. The expectation is that the number of countries experiencing debt distress (and rising risk of default) will rise from the present number of 14.

The World Bank is clear that rising interest rates in the US are the cause of the nascent Global South debt crisis, even titling one chapter, ‘Financial spillovers of rising US interest rates’.  This is a valid assessment of the process, reflecting the fact that the overwhelming bulk of Global South international borrowing is denominated in US Dollars.

When US domestic interest rates rise, Global South borrowers are obliged to increase the premium they must pay over US debt. But this comes at a time when, as previously noted, growth is also slowing markedly. This economic slowdown also tends to depress US Dollar-denominated export earnings in the Global South economies. This in turn reduces their capacity to meet interest payments on existing debt or renew existing borrowing.

It is not the case that in general the Global South economies are relatively highly indebted. Taken in aggregate public debt in the Global South has been relatively stable and much lower as a proportion of GDP than in the advanced industrialised countries. This disparity is shown in Chart 5 below.

Chart 5. Public debt as a proportion of GDP in the advanced industrialised countries and in the Global South

Source: ILO

Naturally, there are specific instances of much higher public debt of some countries in both regions. But it cannot be said that it is generally high Global South indebtedness which is the cause of the debt crisis. It is the combination of factors of dependence on the slowing G7 economies, the impact of higher US interest rates and above all the existing levels of very high interest rates on public debt, whose gap over US domestic interest rates tends to rise even as US rates are rising.

In short, the crisis is caused by US dominance of global financial markets and the impact that has on the borrowing costs of the Global South. This aspect of the crisis is still developing and may have much further to run, depending on the trajectory of US domestic interest rates.

We are all going to pay the price for the failed economic ideology and reckless policies of the G7 governments and central bankers. But some will pay more heavily than others.