July 2012

The incredible shrinking UK economy – an update

The incredible shrinking UK economy – an updateBy John Ross
Earlier this year this blog published an article entitled ‘The Incredible Shrinking UK Economy’. It noted: ‘The magnitude of the blow suffered by the UK economy since the beginning of the financial crisis is very considerably minimized by not presenting it in terms of a common international yardstick. Gauged by decline in GDP, using a common international purchasing measure, dollars, no other economy in the world has shrunk even remotely as much as the UK.’ .
Data at that time was only available up until the end of 2010. Since then the World Bank has updated its data to cover 2011 and the pattern remains the same.
Taking first the situation of the world’s major economies, the G7 and BRICS, this is summarised in Table 1. The comparison made is between the last year before the financial crisis started, 2007, and the last available comprehensive international data – for 2011. As may be seen the $381 billion decline, in current dollar terms, of UK GDP is, without comparison, the worst of any major economy – indeed it is easily the worst in the world. As a percentage of world GDP the UK lost 1.6 percentage points – easily the worst performance of any European economy. The advance of all BRICS economies is also clear from this data.

Table 1

12 07 27 G7 & BRICS

Taking the situation within Europe this is shown in Table 2. As the UK, Ireland, and Iceland are the three economies which have suffered the biggest losses in GDP in dollars during the financial crisis this table may also be taken to show the ‘sin bin’ of world economic performance. The way in which the UK economy has declined in absolute terms far more than any other European economy is again evident.

Table 2

12 07 27 Eurozone
Where does this leave the UK in the world rankings of economies? In terms of current dollar exchange rates. as shown in Table 3, the UK has slid from 5th to 7th position under the impact of the international financial crisis – being overtaken by France and Brazil

Table 3

12 07 27 Current $

However, as is well known, current exchange rates substantially understate the size of developing economies compared to calculations in internationally equivalent prices (Parity Purchasing Powers – PPPs). This is particularly strikingly the case for India which at current exchange rates is only ranked 10th but in terms of PPPs in 2011 overtook Japan to rank as the world’s 3rd largest economy . In PPPs the UK has declined from 7th to 9th position – also being overtaken by France and Brazil on this measure.

Table 4

12 07 27 PPPs

The data is therefore clear. In terms of its real international position the decline in the position of the UK is by far the worst of any major economy. There is no reason to change the analysis. In terms of international comparisons the UK’s is truly ‘the incredible shrinking economy’

*   *   *
This article originally appeared on the blog Key Trends in Globalisation.

The UK’s budget deficit is rising not falling

The UK’s budget deficit is rising not fallingBy Michael Burke
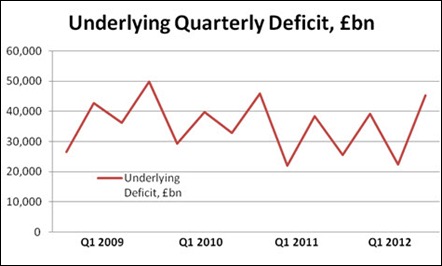
The latest public sector borrowing data shows that the UK budget deficit is widening once more. Indeed despite a series of accounting adjustments which obscure the true picture, it is clear that the underlying trend is also towards rising, not falling deficits.

The Office for National Statistics reports that the June public sector borrowing total was £14.4bn, £500 million higher than in the corresponding month in 2011. However monthly data are erratic and subject to significant revision. Taking the data for the first 6 months of this year as a whole is more meaningful and shows that the deficit over that period is £37.3bn.

But this total is flattered by the strange decision relating to the acquisition of the Royal Mail Pension funds ahead of planned privatisation. In effect the government has decided to include the assets of this fund, but not its much greater pension liabilities in its own accounts. This and another smaller transaction lowered government borrowing by £30.3bn. The underlying deficit, excluding these transactions is therefore £67.6bn in the first 6 months of this year.

This compares to a deficit of £60.5bn in the first 6 months of 2011. The deficit is rising, not falling.

Figure 1

12 07 22 Chart

Factors Affecting Borrowing

This deterioration in the deficit places British government finances in a growing band of European economies where sharp cuts in government spending are leading to economic contraction, which in turn produces widening deficits.

This should come as no surprise. As the crisis is effectively an investment strike by capital, spending cuts by government will only lead to a further decline in private investment. The reason this logic has taken some time to work through in Britain is due to a number of factors. These are primarily the zig-zag in government policy, which initially saw an very modest increase in government investment under Labour and so produced a reduction in the deficit. This was compounded by the uniquely high level of inflation during the British slump, which eroded the real value of all government spending.

SEB has previously shown that the very moderate increase in government investment from the 2009 Budget under Labour was the catalyst for a modest economic recovery. Because of the increase in government spending (including allowing welfare payments to rise automatically as unemployment and poverty increased) the Treasury forecast that the deficit would rise to £178bn in the following financial year. In the event, the deficit began to decline and was £158bn for the financial year.

In addition, the effects of economic growth are felt on both sides of government accounts. Expenditure is lower than it would have been because more are in work and the benefits’ bill falls. Revenues are higher because incomes, profits and consumption all raise the level of tax revenues.

It is widely known that government policies have led to economic stagnation. Yet it is only now that the deficit has started to rise. The British economy has grown by just 0.5% in the two years since the Coalition came to office. But in nominal terms, before taking account of inflation, the GDP has increased by 6.1%. This surge in inflation during the slump is highly unusual, placing Britain on a par with countries such as Iceland. Britain has an incredible shrinking economy when measured in international currency terms.

Domestically this is reflected in a surge in inflation. While severely denting the purchasing power of all those on fixed or low-growth incomes, the fiscal effect was to increase nominal government revenues by £56bn over the last 2 years. This compares to annualised nominal growth in GDP of £88bn.

The Treasury’s estimate is that every £1 increase in economic activity will lead to a 50p increase in government revenues. In fact the increase over the last two years has been 64p (£56bn of revenues of £88bn increased output). However, government current spending has also risen by £42.3bn over the same period. This is an inevitable consequence of the savings (i.e refusal to invest) by firms.

This points to the essential fallacy of all ‘austerity’ measures, whether from the Coalition’s frontal assault, or the slightly shallower, slower cuts favoured by current Labour policy. Even nominal growth will largely be reflected in increased government revenues. But spending cuts have the effect of weakening economic activity and so drive up government expenditures.

Even in the narrow terms of reducing the deficit, the only effective prescription is growth. The most effective means of promoting growth, as even the cautious 2009 Labour Budget shows, is for the government to increase investment.

What the world economy should learn from China

What the world economy should learn from China

By John Ross
I have a new article at the Guardian’s Comment is Free analysing China’s economic success both during the international financial crisis and in general since since 1978. It analyses the theoretical bases of China’s economic policies in terms of both Chinese and Keynesian economic theory. The article starts:
‘Few things better illustrate the difference between the state of China’s economy and that of the rest of the world than the fact that its newly announced GDP growth figures of 7.6% were analysed as a “slowdown”. In any other major economy this would have been considered blistering growth threatening overheating. Instead, it is clear China has room for further stimulus measures in the second half of the year.
‘Indeed, as the international financial crisis has unfolded, there have been few starker contrasts than those between China, the US and the EU. Europe has combined loose monetary policy with little or no stimulus to the productive economy – the “austerity” approach. The result has been that the EU’s economy shrank by 2% over four years – the UK’s shrank by 4.4%. The US has combined loose monetary policy with a consumer stimulus delivered via the budget deficit. The result? The US economy has grown by 1.2% in four years. India, which followed the US model of a budget deficit delivering a consumer stimulus, saw its growth decline from 9.4% in the first quarter of 2010 to 5.3% in the first quarter of 2012.
‘Meanwhile China, which combined expansionary monetary policy with an investment-led stimulus, has experienced more than 9% annual average growth throughout the four years of the financial crisis.’
The rest of the article can be found here.
12 07 14 Comment is Free

T Walkerhttps://www.blogger.com/profile/11107827543023820698noreply@blogger.com0