August 2018

Sustaining the economic recovery in Portugal

By Tom O’Leary

Portugal is finally on the brink of ending the slump that began with the Great Recession at the start of 2008. But the economy remains far from a full recovery and important challenges lie ahead for the Left-supported government.

In the 1stquarter of 2018 the level of Portuguese GDP rose once more and is now just 0.75% below its level of the 1st quarter of 2008, which was immediately followed by recession. At some point this year the economy will finally surpass its pre-recession peak level. The low-point of the recession was reached in 4th quarter of 2012.

From the pre-recession peak in early 2008 to the low-point of activity and the end of 2012 the economy contracted by 9.6%, one of the sharpest falls in the whole of Europe (although less than half the depth of the Greek catastrophe). Since the end of 2012 the economy has been expanding.

The content of the crisis was twofold. Consumption fell by €15.1 billion, taking both government and private Consumption together. Investment fell by the even greater amount of €16 billion, even though Investment was a far smaller proportion of GDP. In percentage terms Consumption (private and government combined) fell by 9.7% in the slump, in line with economy as a whole. Investment fell by a far greater amount in percentage terms, down 36.25%.

As with other countries, the main driving force of the Portuguese crisis was therefore the slump in Investment. Chart 1 below shows the change in real GDP and its components during the slump. Net exports rose over the period, partly off-setting the sharp falls on other GDP components. But this was overwhelmingly due to a slump in import demand, not a surge in exports.

Chart 1 Change in Real Portuguese GDP and its Components in the Downturn, €bn

The impositions of the Troika have had a devastating effect on the Portuguese economy. The ‘bailout’ was not for Portuguese workers and the poor. It was a bailout of the creditors of the Portuguese government, who included both Portuguese and international banks, as well as investment and hedge funds, and other vultures. Vicious austerity was the price the Portuguese population was made to pay. They were also burdened with the debts of the creditors.

It is important to register the actual timeline and causality of the crisis. The Portuguese government did not apply for Troika a bailout until April 2011. The government had already imposed austerity measures of its own under the pressure of European Central Bank, the ratings’ agencies and others. Before the bailout of creditors the economy had already contracted by 3.1% and Investment had fallen by 20%. This was a crisis initiated by Portuguese and international big business, and a government acting in their interests. The Troika formalised and deepened that process.

Turning to the recovery, as Chart 2 below shows, that expansion has clearly accelerated since the beginning of 2016. This coincides with the new government in office, the Socialist minority government supported by the Left Bloc, the Communists and the Greens.

Chart 2 Portugal Real GDP Index

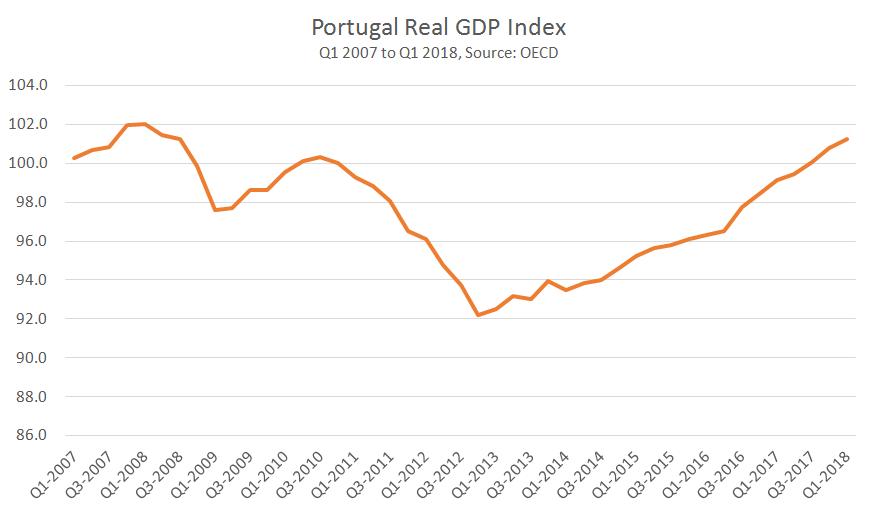
The acceleration under the Socialists is clear from the evidence. In the first 3 years since the economy began to expand once more, from 2013 to 2015 GDP rose by just 4.2%. But the signifcant acceleration in growth from 2016 onwards means the economy has expanded by 5.3% in little over two years.

The sharp change of policy under the new government is associated with the acceleration of growth. The Socialists, and the other parties supporting it in forming a government, stopped imposing new austerity measures. This alone has been enough to prompt an economic recovery.

To be clear, it is not increased government spending which has caused a recovery. The government has not increased its own Consumption at all. According to OECD data the annual level of government Consumption was €34.256 billion in the 4thquarter 2015, the last of the outgoing government. It was barely changed at €34.494 billion in the 1st quarter of 2018. The idea that increased government ‘stimulus spending’ has prompted Portugal’s recovery is not factually correct.

Instead, the government stopped imposing new austerity measures. This allowed a rise in private Consumption, and an increase in Investment, which is shown in Chart 3 below. Investment remains very far from recovery. But it has been on an accelerating trend. In the 3 years after 2012 when the economy began to expand once more, Investment rose by 9.0%. In little more than two years of the Socialist minority government investment has increased by 14.6%.

Chart 3 Portugal Real Gross Fixed Capital Formation Index

The decisive factor in continuing to ensure sustained growth will be to extend and improve this upturn in Investment.

As already shown, the fall in Investment was the decisive element in provoking the recession. The major fall in living standards came later, imposed by the Troika. In order to maintain recovery, raise living standards and undo the impact of the crisis, the further expansion of Investment is required.

Before the crisis, Investment comprised over 22% of GDP. It is now just 16% of GDP. If that Investment share of GDP is not restored or improved, it will be difficult to sustain the same pre-crisis levels of growth in living standards. General government Investment (Gross Fixed Capital Formation) has only just begun to turn up. Chart 4 below shows the Nominal level of general government Investment.

Chart 4. Nominal Portuguese Government Gross Fixed Capital Formation, €bn

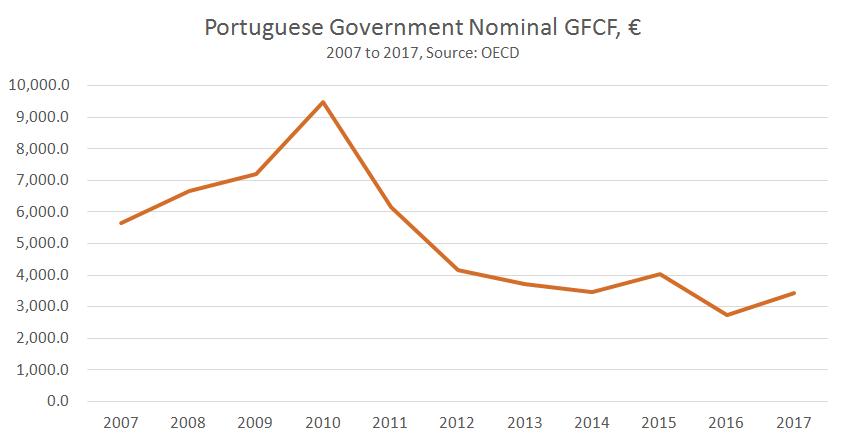
Given the time leads for Investment (in transport, infrastructure, affordable housing, ports and so on) the new government can only be responsible for the level of public Investment in 2017. This showed a modest upturn.

The private sector cannot be relied on to maintain increased Investment. The Government must significantly increase its own Investment to maintain recovery over the medium-term, and to underpin rising living standards.

The IMF has called on the government to increase lending to small and medium-sized enterprises (SMEs). This is entirely the wrong prescription. SMEs will never deliver the large-scale Investment the economy requires, or direct towards the areas required, in housing, infrastructure, transport, new technologies and so on. Instead, the government should invest on its own account to achieve the increase in the productive capacity of the economy that is required.

How precisely that is achieved would require detailed knowledge greater than the current author’s. But the following options would come under consideration:

*Borrowing for investment – a public sector budget surplus is now expected and Eurozone government interest rates are extremely low

*Pressing for increased investment from the European Investment Bank and other supranational bodies

* Using remaining state-owned companies to increase their own investment

*Encouraging productive (not speculative) Investment in the real economy through Foreign Direct Investment.

Other avenues may also be possible. The decisive issue is to maximise the level of Investment to boost sustainable growth and living standards. This is the major challenge ahead.

Jeremy Corbyn is right – manufacturing matters

By Tom O’Leary

The multi-faceted attack on Jeremy Corbyn’s leadership of the Labour Party continues to include unjustified attacks on his economic policy. The liberal press, led by The Guardian and The Independent mounted a completely specious attack on his economic policy, even claiming that he was adopting the economic nationalism of Donald Trump.

Anyone who read the speech would know this is untrue. Instead, Corbyn was offering a sharp critique of the ruling economic ideology, which has for decades argued that finance and banking was the key to prosperity. “We’ve been told that it’s good, even advanced, for our country to manufacture less and less and to rely instead on cheap labour abroad to produce imports while we focus on the City of London and the financial sector,” Corbyn said.

But advocates of that economic model Britain, which has effectively adopted since Margaret Thatcher in the 1980s, also hit back. Because of the crash, their overt rallying cry cannot be to subordinate everything to the banks and the finance sector, which was Thatcher’s rallying call. Instead, it is to downplay the role of manufacturing and deride any attempt to revive it. It is also claimed that services are much more important. As banking, finance and their related services such as financial accounting, financial law and so on, are the largest, most profitable parts of the services sector, it is easy to see that this is the Thatcherite argument in a new, less open form.

The verdict of history

Thatcherism was a disaster for the British economy. This can be gauged on the actual performance of the economy during and since her time in office. The explicit claim for her project was that it would end Britain’s role as ‘the sick man(!) of Europe’ and its relative economic decline. In fact, the Thatcherite project of privatisation, union-busting, deregulation and lower government investment and spending led to even lower growth. This is despite the fact that she enjoyed the enormous windfall of North Sea oil revenues, which only started to gush as she entered office.
Chart 1 UK GDP 1948 to 1979
The period after the Second World War happens to divide into two neat periods until the 2008 crash, both of 30 years duration. 1948 represents the beginning of ONS GDP data. Thatcher came to office in 1979 and British economic policy has been dominated by Thatcherite ideology ever since, despite repeated changes of government. The crash of the 2008 and subsequent recession and stagnation can be traced back to those policies.

The verdict is clear. In the 30 years prior to Thatcher UK GDP rose by 145%. In the 30 years including her tenure and subsequently the economy grew by just 114%.

Far from reversing the relative decline of the British economy, the Thatcherite model accelerated it.

This can be seen starkly in the relative decline of manufacturing over the same period, shown in Chart 2 below.
Chart 2. UK Manufacturing, 1948 to 2017
In the 30 years prior to Thatcher, British manufacturing output more than doubled, rising by 123%. In the 30 years that included her terms in office and subsequently, manufacturing output rose by just 16.1%. From the recession onwards it has also remained in a downturn, falling by a further 5.9% since 2008.

Why manufacturing matters

The Thatcherite, or neoliberal argument against manufacturing is that it is old-fashioned and outdated. Modern economies, it is argued are increasingly based on services.

It is true that in all almost all advanced industrialised economies workers are increasingly employed in services sectors of the economy. Yet almost every other OECD economy has a greater proportion of manufacturing in GDP than the UK’s miserably low level of 9.2% (World Bank data). Germany’s manufacturing content is more than double that level at 20.7%. Chart 3 shows manufacturing as a proportion of GDP in selected industrialised economies.
Chart 3 Manufacturing Share in GDP of Selected Industrialised Economies
Because manufacturing requires a larger scale of fixed investment than service sectors (sometimes vastly more) the value created by each manufacturing workers is far greater than the average worker.

The greater output of manufacturing as compared to services sectors allows both greater reinvestment and higher pay. Crucially, manufacturing outputs are also the inputs for a host of other sectors, including energy, construction and many service sectors themselves, including transport, storage, communications and distribution. A weak manufacturing sector hampers the ability to develop all these other sectors.

This is nothing to do with economic nationalism. On the contrary, as an advanced industrialised economy, the manufacturing sector in Britain is one of the sectors most integrated with the world economy. It is often an important link in a Europe-wide or even global supply chains. To take the car industry, about one-third of all inputs to the British car industry are imports. At the same time, almost 80% of all cars produced here are for export, and 55% of all engines manufactured here are for export.

The complexity of these supply chains and the interconnection of markets can be highlighted in the following way: In 2016 the top 5 UK goods imports were all manufactures, electrical machinery, mechanical machinery, cars, ‘other manufactures’ and medicinal and pharmaceutical goods. Together they accounted for 42.9% of all imports and amounted to £185 billion. They are almost mirrored by the top 5 goods exports of mechanical machinery, cars, electrical machinery, medicines and pharmaceutical goods and aircraft, which together accounted for 45.4% of all exports and amounted to £132 billion.

It is not the case that British Minis are being sold Germany, while German BMWs are being sold here. The reality is that components of both are researched, designed, tested and manufactured in both countries, and many more besides. The value added per British car worker is almost £100,000 per annum, which as far greater than the UK workforce as a whole (by more than 50%). A decisive element of the high value-added is this integration in highly specialised multinational supply chains.

Participation in the international socialisation of production/division of labour is decisive for the development of the economy, on which prosperity depends. Anything that develops manufacturing, one of the sectors most linked to the world economy, will enhance that process, which is what Jeremy Corbyn proposes to do. By the same token, anything that blocks or interrupts the economy’s links to the rest of the world will also hit manufacturing hard.