Part of the false propaganda about the cost of living crisis that we are being subjected to by the government is the line that there are “global headwinds” beyond their control that require the working class to get worse off; possibly indefinitely.
The “headwind” most often identified as causing the increase in the cost of energy is the war in Ukraine.
It is – however – never suggested that a better course for the UK government would be to seek to resolve and deescalate the war – so that people in Ukraine and Donbass can live in peace, and a mutual security arrangement made with Russia; to allow decreases in military spending on both sides which could be spent on solving the problems humanity has rather than adding to them.
This will be even more the case next Winter if there is no end to the war in the meantime, or sanctions are maintained as a form of self-harming pressure in the aftermath. The OECD projects that inflation will slowly subside through 2023 to 2024, but also notes that next Winter is likely to see a further spike in oil and gas prices if the war continues and also if China’s continuing economic growth raises demand for energy. This is very likely, and puts the OECD prediction in question.
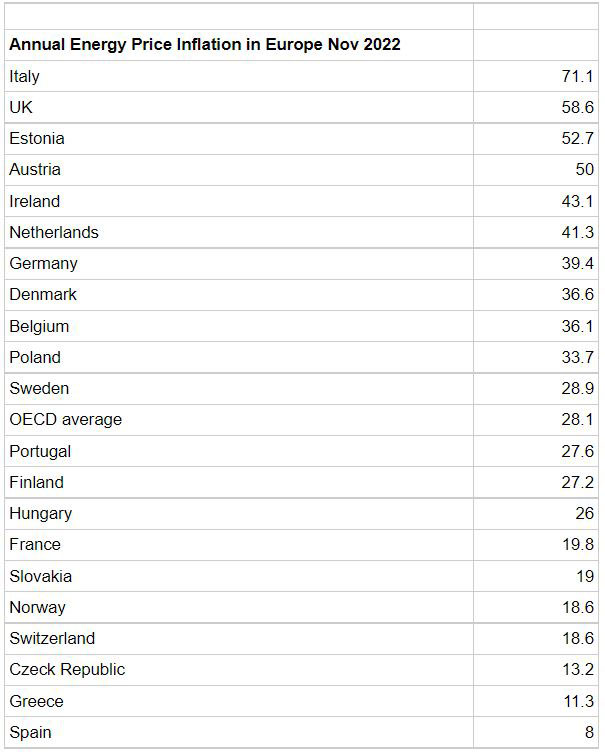
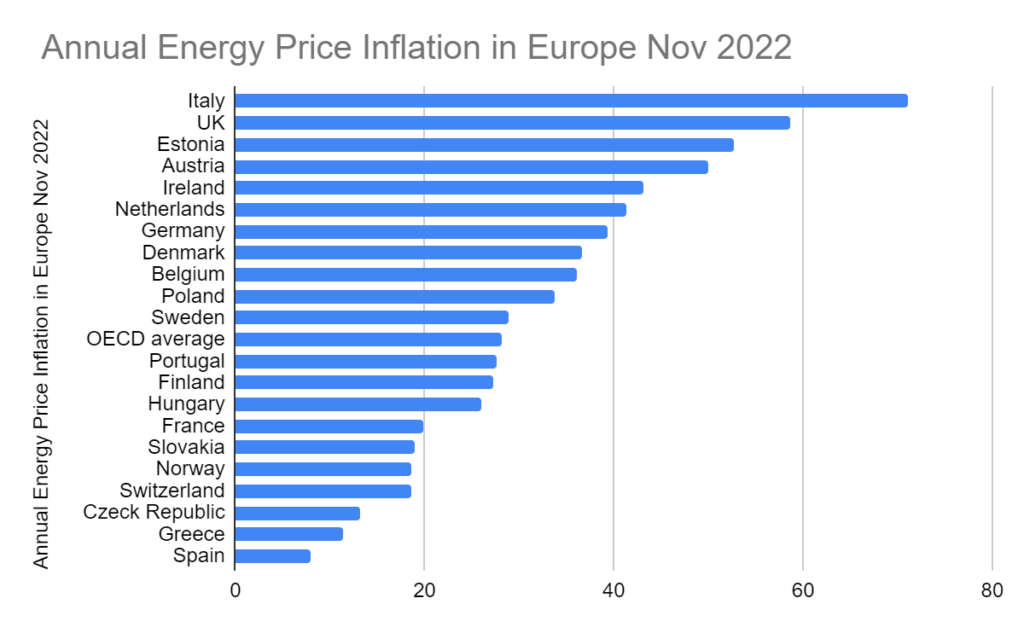
In the meantime these “global headwinds”, that the British government blames for high energy prices, seems to affect some countries far more than others, in particular the UK. As we can see from this table, there is a range of annual energy price inflation in Europe that rises from 8% for Spain to over 70% for Italy, with the UK as second worst. These figures can be further investigated and compared with other countries globally here.
See below for this in graphic terms that are easier to see at a glance. The UK energy consumer price inflation rate, in fact, is more than double the OECD average. Spain is in a particular position because it gets 90% of its gas from Algeria and is not connected up to the rest of the EU, but Germany in December 2021 got 32% of its gas from Russia compared to the UK’s 4%, so, why are prices rising so much faster here?
The UK got just 4% of its gas supply from Russia before the war, whereas Italy got 40%, which was average for the EU. At present the UK imports 50% of its gas, mostly by pipeline from Europe, but increasingly in the form of LNG, which arrives by ship from the USA, Qatar. This will increase quite quickly as North Sea production runs down; which could hit zero by 2030. It is already down to a third of what it was in 2000.
As the price of gas is set globally, regardless of where it is produced, enhanced domestic supply would have practically no impact on prices; which disposes of another myth used to try to drum up support for more North Sea gas fields or fracking. Local supply is not cheaper.
The price of gas also fixes the price of electricity, even when generated by far cheaper renewables. This is because the sources with the lowest marginal costs will be on stream all the time. This will be renewables because, once the turbines are up or the panels in place, there is no charge for the wind or sun, whereas fossil fuel plants have to pay for burning their fuel. But, although capacity is rising sharply, with six times as much as in 2010, we do not yet have enough renewable capacity to cover most of the demand most of the time. So, more expensive sources have to be brought online to fill the gaps. As the price in every half hour period is set by the marginal cost of the last generating unit to be turned off to meet demand – which is invariably a gas power plant with high marginal costs – that keeps the cost of electricity that high regardless of how it is generated. A different method of pricing to take account of the lower costs of renewables, could reduce prices and would be facilitated by public ownership of power generation.
The dizzyingly high level of energy price inflation in the UK is down to government policy choices.
As the OECD points out: “The untargeted Energy Price Guarantee announced in September 2022 by the government will increase pressure on already high inflation in the short term, requiring monetary policy to tighten more and raising debt service costs. Better targeting of measures to cushion the impact of high energy prices would lower the budgetary cost, better-preserve incentives to save energy, and reduce the pressure on demand at a time of high inflation.”
The energy price guarantee amounts to a subsidy paid to energy suppliers to avoid taxing the windfall profits of the energy producers. With these companies netting £170 billion in profits, a serious windfall tax at 100% on these, with no loopholes encouraging suicidal fossil fuel exploration, could more than meet the cost of the existing cap – £39 billion up to April 2023. If done preemptively it would cut that cost out of the inflation rate. A choice not to do this indicates that the government wants inflation to bite into the incomes of the working class as a means of levering resources up towards profits.
A better targeted measure that would meet social need and cut inflation is the TUC’s proposals for a fairer energy system which would:
Take the Big 5 energy retailers and other failing retailers into public ownership, at a similar cost (under £2.85bn) to what Government already spent on keeping failed energy supplier Bulb in business;
Task publicly-owned energy providers with offering a social tariff capped at 5% of income for low-income households;
Recognise that energy is a common good: restructure tariffs to provide all households with an initial free energy allowance, and increase the cost per unit for high-consumption households.
This would:
Protect all low-income households with fairer bills and a social tariff
Deliver lower bills and a faster climate transition through the rapid rollout of fully-funded home energy efficiency retrofits
Ensure that energy is a public good and that energy retail is both democratically accountable and transparent
The collapse of the Truss and Kwarteng economic project was one of the most swift and spectacular in modern history, which has left its mark in terms of inflation, interest rates on government debt and perhaps most of all on the private pensions sector, which was caught out by speculative investments that went badly wrong.
Given the far-reaching consequences of the failed experiment, the Truss/Kwarteng period has been strangely under-analysed. Perhaps this is because leading figures on the economic right were implicated in the debacle, such as Patrick Minford and various acolytes in the City.
But one central aspect of the policy, known by its supporters as ‘deficit-financing’ is also widely advocated on the left, and is a mainstay of ‘keyenesian’ economic thinking. In fact, it was this central part of the policy which was the immediate cause of the spectacular blow-up. As a result, it is worth examining in some detail.
The long tail of ‘deficit-financing’
‘Deficit-financing’ is actually government borrowing to fund Consumption. Almost no serious economist of any school believes there is any rational basis for concern about borrowing for Investment.
As long as the average returns on Investment exceed the average rate of interest on government debt, Investment returns will be positive and the economy will benefit. In addition, government has a very significant advantage over the private sector as a proportion of all Investment outlays will be returned in the form of taxes (income tax, National Insurance, VAT and other revenues).
In contrast, government borrowing to fund Consumption was the norm across the advanced industrialised countries in the period after World War II. This was billed as ‘demand management’, where governments believed they could manage the cyclical turns in the economy by raising/lowering their level of borrowing and so adjust the level of total Consumption in the economy. It did not prevent steady economic slowdown and occasional crises over that period.
At the beginning of the 1980s the Reagan/Thatcher offensive included efforts to cut government Consumption. Although the rhetoric against the previous consensus was severe, along with the effects on some components of government Consumption, the attempts to curb either total Government Consumption or public sector deficits met with only patchy success. On the political right, the Reagan/Thatcher ideology has remained largely dominant.
However, much of the Western political left, seeing the effects on public services or unemployment from the attempts to curb government spending, have tended to hanker after a return to the post-War consensus. The left has favoured government Consumption, or ‘deficit-financing’ as a result. Furthermore, some on the left have even tended to judge government policy favourably if the deficit is rising, and unfavourably if they are falling.
Apart from not producing prosperity, the left supporting government Consumption and rising deficits is very strange for another reason. The level of government borrowing is actually a key prop for the financial sector, a large part of whose income is interest payments on government debt. Persistent government borrowing for Consumption has allowed the finance sector to become bloated in many leading economies, not least in Britain.
Borrowing and prosperity
The increase in the productive capacity of an economy is the prerequisite for sustainable growth in prosperity. Without increasing the amount of labour in the economy, the productive capacity must be increased by Investment. Aside from labour inputs, Investment is the single main determinant of growth and prosperity.
In contrast, Consumption is not an input to growth and its growth will not cause greater prosperity. The post-World War II consensus and much of the Western left still labours under the illusion that the opposite is the case. This can be demonstrated in a real world experiment.
At almost the same time as the Reagan/Thatcher offensive in the leading Western economies there was also adopted the ‘reform and opening up’ process in China. As a result, we now have a global economic experiment lasting more than 4 decades on whether growth in prosperity is Consumption-led or Investment-led.
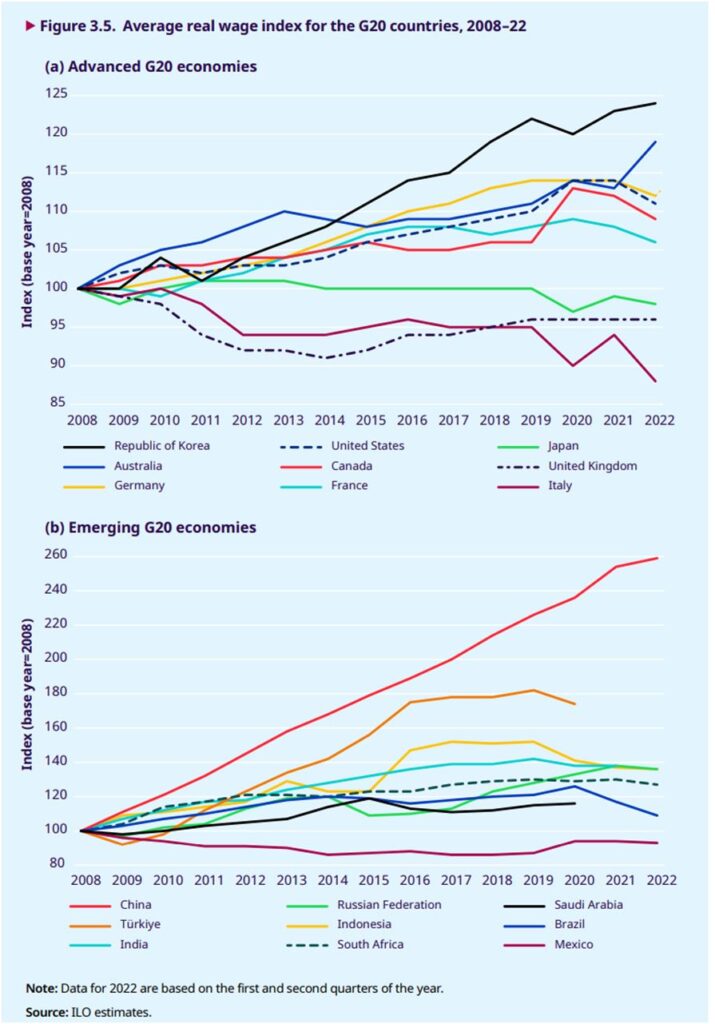
Charts 1 & 2. Average real wage index for the G20 Advanced & Emerging economies, 2008 to 2022,
Source: ILO
Here, real wages can be taken as a proxy for general prosperity, including the capacity for growth in household Consumption (comparable data for total government Consumption is not available across countries).
What is clear is that the growth of real wages in the G20 advanced economies has been extremely weak ever since the global financial crisis. No country in that group has reached 25% real wage growth. The US has achieved just 11% real wage growth over that period and is currently falling. In Japan, Britain and Italy real wages have actually fallen outright over that period.
There is a very different pattern in the emerging G20 economies. Indonesia, Russia, Turkey and India all have real wage growth above the best performer among the advanced economies, South Korea. And all of them are vastly outpaced by China, where real wages have risen by 1.6 times over that period.
At the same time, it is widely known that China has a significantly higher proportion of GDP devoted to Investment than the leading Western economies. It is frequently attacked in the Western financial press for its ‘excessive investment’. In fact, this is the official US position over many years, with the US Council on Foreign Relations arguing that not only China’s Investment but also its savings are too high!
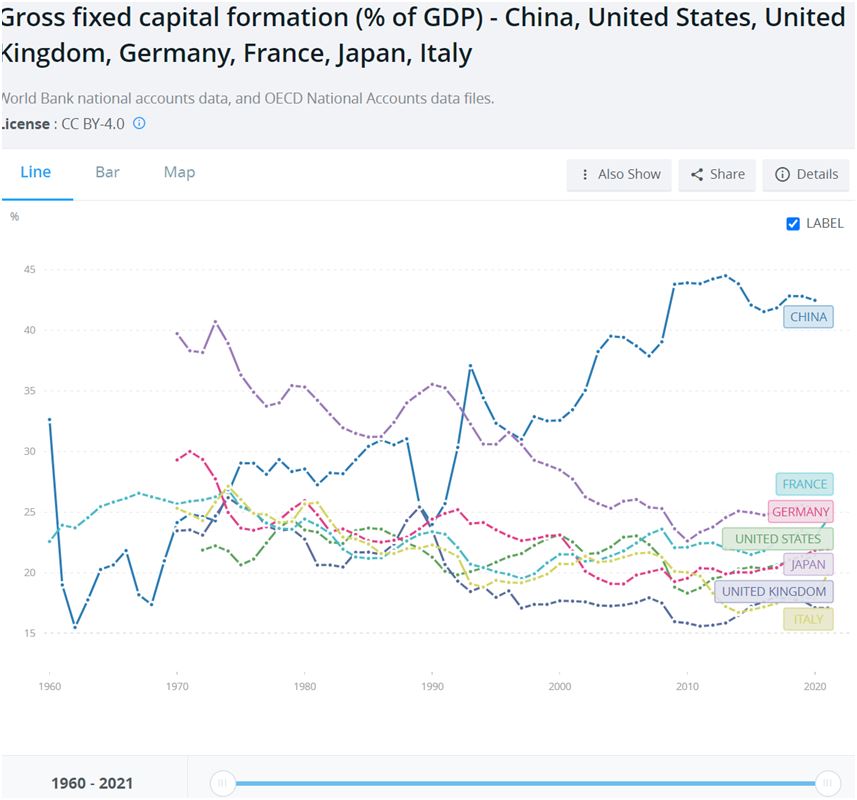
However, it has already been noted that China’s wage growth is far in excess of the wage growth in the G20 advanced economies. Yet it can also be shown, so too is China’s Investment rate far higher. This is shown in Chart 3, below.
Chart 3. Gross Fixed Capital Formation, % GDP, in China and the G7 economies
Source: World Bank
Over the period shown, there is a general downward trend in the proportion of GDP devoted to Investment (Gross Fixed Capital Formation, GFCF) across the G7 economies. This was accompanied by the significant deceleration in the GDP growth of these economies over the same period, which is still taking place.
Lower Investment as a proportion of GDP accompanied by lower GDP growth is not coincidental. Bearing in mind that net Investment adds to the productive capacity of the economy (the ‘means of production’) it is entirely logical.
Yet at the same time, the trend in China has been in the opposite direction, with all the positive consequences for growth and prosperity that should be widely known. Naturally, as the proportion of GDP devoted to Investment in China has risen, the proportion of China’s GDP devoted to Consumption has necessarily fallen.
This apparent paradox, rising wages and Consumption taking place while Consumption falls as a proportion of GDP raises crucial questions of both economic theory and policy. In fact, there is no paradox.
The crucial point is that proportions are not the same as growth rates. Consumption and prosperity have grown at extraordinarily impressive rates in China because an increasing proportion of the economy is devoted to Investment. This rising proportion of the economy for Investment means a greater increase in the means of production, which allows the greater production of goods and services both for Consumption and for re-Investment.
Naturally, under certain specific and limited circumstances stimulating Consumption can induce growth, if it supports a rise in Investment. This might include examples where consumers had lost confidence because of some shock, and required a catalyst to Consume more or save less. But these incidents are time limited and based on a certain set of conjunctural circumstances. Consumption cannot drive growth because it is not an input to it. All strategies based on the assumption that it can have tended to result in failure.
The effectiveness and sustainability of all borrowing, whether for government, business or households is determined by these fundamental points. If borrowing is conducted for Consumption (from which, by definition there is no monetary return) it cannot be sustainable. If borrowing is conducted for Investment, as long as the return on Investment exceeds the cost of borrowing, then it will be effective and sustainable.
Under those circumstances there should the greatest optimal amount of borrowing, in order to maximise the rate of Investment growth, and ultimately maximise the growth in prosperity.
For government, Consumption, or current spending should be financed by taxation. In advanced industrialised economies it will be generally the case that good levels of public services generally need high levels of taxation.
Three different increases in the public sector deficit
There are three recent examples of deficit-financing, government borrowing for Consumption, from which there can be drawn important lessons.
In the current period, the pandemic and the Western governments’ disastrous response to it has produced a challenge to the Reagan/Thatcher ideology. The lockdown policies were too negligently porous to prevent the spread of the virus. As a result they were also extremely damaging economically. This was lethally damaging to public health and highly negative to economic activity.
A combined public health and economic crisis ensued. Western governments have been focused on the economic crisis.
One immediate consequence of this failed pandemic policy was to produce an extraordinary increase on Government Consumption spending. This was supposed to deal with some of the health consequences of the pandemic, to bail out firms and to boost Consumption in specific sectors (from hospitality, to restaurants, to housing, to car production and other areas). As we will see, the policies adopted were very far from a success.
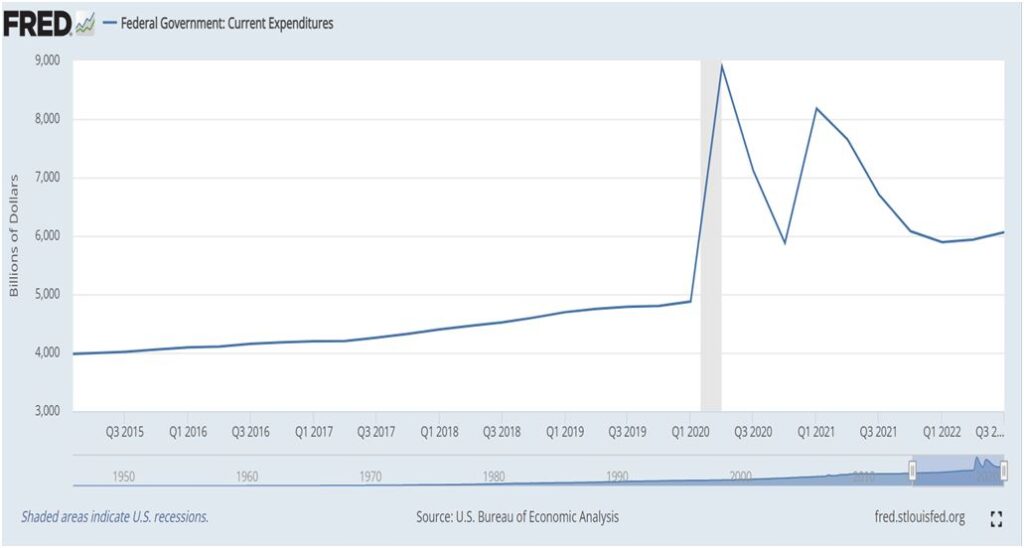
In the US, this huge boost to Government current spending during the pandemic was repeated shortly afterwards, in order to boost the economy coming out of lockdown. These huge increases in US Government Consumption are shown in the chart below.
Chart 4. US Federal Government Spending, US$bn
Source: FRED
In the 4 years prior to the pandemic US Federal Government Consumption rose gently from $4trillion to $4.8 trillion. In the following year it surged to $9.8 trillion and is now rising once more, well above the pre-pandemic trend.
It should be noted that there was no comparable increase in Government Investment in any of the G20 advanced economies.
For opponents of all government spending, whether Consumption or Investment, the Truss/Kwarteng experiment seemed to demonstrate that, in an era of free-flowing capital the bond markets will not allow a surge in government spending. Instead, this Reagan/Thatcher argument runs, they will punish profligate governments by refusing to buy the debt and/or demanding much higher interest rates to hold that debt. But this was not the US experience during its twin Consumption and borrowing binges related to the pandemic.
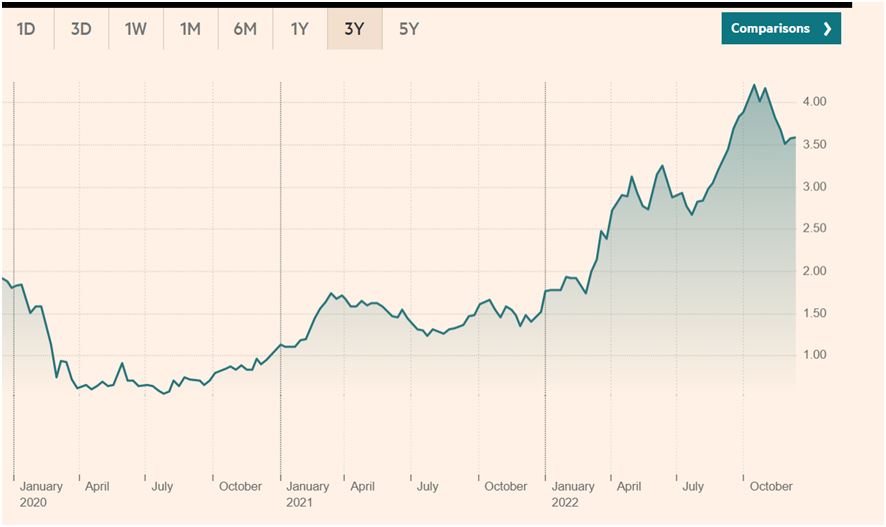
This is shown in Chart 5 below. In fact, there were two very distinct responses in financial market, and movements in government bond yield in opposite directions.
Chart 5. US-10 year Treasuries’ yields, %
Source: FT
The surge in borrowing began in the 1st quarter 2020. However, the first response of US Treasuries’ yields was to fall, not to rise. Two years later, in January 2022 they were still no higher than they had been prior to the pandemic, as shown in the chart above. Over that period, given the emergency nature of the borrowing to prop up the business sector and the absence of viable alternatives, bond yields had not risen.
It was only in the 2nd quarter of 2022, as it became clear that the increase in Government Consumption was not a one-off that yields on US government debt began to rise sharply. This took yields up from 1.5% to 3.5%. Yet these seemingly small numbers, when combined with the total level of government borrowing, represent a huge drain on resources.
The Congressional Budget Office (CBO) estimates that the net effect of increased debt and higher interest rates would drive up net interest costs from well under 10% of Federal government revenues to over 40%. As noted previously, the rise in interest payments in this way naturally supports the growth of the finance sector at the expense of the productive economy. Even the US government eventually found that there was not an unlimited capacity to borrow to finance Consumption.
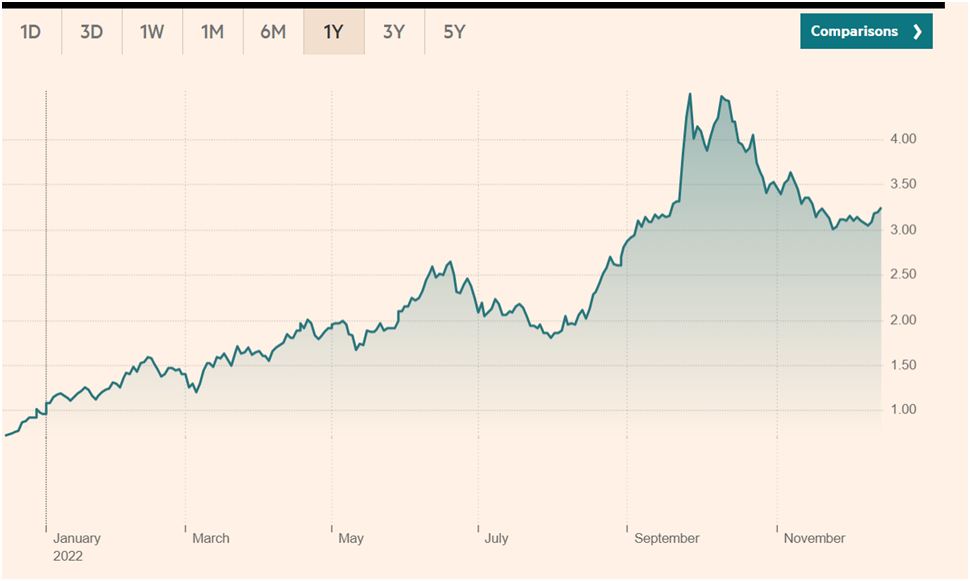
Closer to the present period, Liz Truss’s premiership became one of the shortest in British history because it was directly brought down by global financial markets’ reaction to her own economic policy. The policy was also a version of ‘deficit-financing’. It may have been modelled on the recent experience in the US. However, this type of increased Government Consumption was not in the form of public services, but on tax giveaways to big business and the rich amounting to £75 billion.
It is widely understood that there was a significant and negative market reaction to that policy. While the currency initially plummeted, it has since recovered after Truss and Kwarteng were both displaced.
Chart 6. UK-10 year Government Bond yields, %
Source: FT
The reaction of the bond market to the British deficit-financing experiment was also swift and brutal. The rout in the bond market was only halted with the ousting of both Truss and Kwarteng, and the equally swift pronouncement from their appointed successor Sunak that he would cancel this deficit-financing (which is sometimes called ‘tax spend’, meaning tax giveaways).
In these two transatlantic experiences, the rise in yields in the US and Britain appear to be rather similar. Both jumped from about 1% to about 3.5%. But this actually masks a very different reaction in the bond markets.
First, the rise in US Federal government spending continues (not least after the military Budget was increased by 8% to $858 billion for 2023). The British government was very rapidly obliged to drop its planned increase in spending/tax giveaways entirely.
Secondly, the relative sums involved are qualitatively different. An increase in the budget deficit of £75 billion is equivalent to approximately 3% of British GDP. In the US, the cumulative rise in Federal Government Consumption Expenditures over the previous trend now amounts to $16.6 trillion (author’s calculations) between 1st quarter 2020 and 3rd quarter 2022. This is approximately equivalent to 66% of current US GDP.
The US government can get away with a certain level of deficit-financing in the current period, although it pays a significant price for that in the form of much higher debt interest payments. The British government, seeking to do a much more modest version of the same policy found it could not do anything at all, with the negative financial market reaction doing away with both the policy and its parliamentary architects.
Conclusion
Investment in the productive capacity is the main determinant of economic growth, so borrowing for Investment is sustainable and is generally required in order to achieve growth (unless Investment can be financed from own resources).
Consumption is not an input to growth. So, borrowing for Consumption will not lead to increased growth and is therefore not sustainable.
The US and other Western economies have allowed a significant rise in the proportion of the economy devoted to Consumption. This has led to weak growth in the economy and in measures of prosperity such as wages over the medium-term. By contrast, China has had much stronger growth based on increasing Investment as a proportion of the economy. This in turn has enabled strong economic growth, as well as growth in real wages and in prosperity.
The policy of deficit-financing, or increasing borrowing to finance Government Consumption, in the Western economies has not led to improved growth over the long run. In the recent period, Western governments borrowed to save the economy form the effects of their lockdown policies in the pandemic. There was no negative impact on government borrowing costs in response.
However, there was a costly negative response when the US repeated the borrowing, and interest payments will now consume a greater part of government revenues as government borrowing costs have risen.
Even so, is the current era this type of deficit-financing is only open to the US because of the role of the US Dollar which continues to dominate global capital flows. This includes global bond portfolios. In a certain sense, many investors are compelled to buy US government debt, although they may demand a higher interest for doing so.
This is not an option that is available at all to other countries, such as Britain, whose currencies do not play that role, who have very few forced buyers and who have removed all capital controls.
This is a key lesson for the Western left. It cannot advance on economic policy by clinging to the failed nostrums of the post-World War II consensus. In particular, borrowing for Consumption is counter-productive in terms of growth and prosperity. Therefore it cannot at all be used to transform the economy to operate in the interests of working people and the poor. Consumption must be financed from taxation, heavy taxation if appropriate.
Growth and prosperity are determined by Investment. Therefore ,borrowing should in general be reserved for Investment, which should be utilised to the maximum sustainable capacity to optimise growth. This in turn leads to growth in prosperity, Consumption and wages.

Recent Comments