October 2016

No pointers to a successful Brexit

No pointers to a successful BrexitBy Tom O’Leary

Brexiteers’ crowing over the latest GDP data and the decision by Nissan to invest further in its Sunderland plant is utterly foolish. The negative impact of the vote will take place primarily over the long run, will be felt in terms of trade and above all in investment, and will accelerate after Article 50 is invoked and most especially if Britain actually leaves the EU and the Single Market, scheduled now for some time in 2019.

Yet even in the latest events there are clear signs of the problems that will mount. As a series of company announcements have already shown, the first is that prices will rise. By how much is not solely due to the 17% devaluation of the pound but will also be determined by the trend in global commodities’ prices. The certainty is that prices will be much higher than they otherwise would have been, lowering living standards and real incomes.

GDP

The GDP data also point to the problems ahead. Aside from the services sector, the rest of the economy fell into recession, as shown in Chart 1 below. Taking the growth rate from a year ago, services have expanded by 3%. But industrial production is just 1.2% higher, manufacturing is 0.4% lower, construction is down 0.2% and agriculture is 1.4% lower.

Chart1. GDP and Components Growth Rate in Q3 2016
Source: ONS

If the services sector itself is examined, it can be seen that the hotels, restaurants (the sectors that benefit from tourism) grew rapidly and along with the business services and finance. These two benefited from the sharp devaluation of the pound and the interest rate cut by the Bank of England. Together these two sub-sectors contributed 0.3% to GDP growth. The rest of the economy grew by just 0.2%. 

Over the long run, as Nigel Lawson was forced to discover, it is not possible to build a ‘candyfloss economy’ based entirely on services. Not only are the productive sectors high value-added, high productivity and higher paid, without them an economy becomes entirely subject to the gyrations of the world economy and world prices, the weakest link in any general crisis. As a result it is not possible to build prosperity over the long without manufacturing and production. In fact the entire British long-term economic crisis that culminated in the referendum vote is characterised by this decline of the productive sectors and the over-dependence on services.

Nissan

The Nissan deal has been kept secret. The Times reports that Nissan was provided with a written assurance that it would face no detriment in its trading position in the UK. There is speculation that this could be financial compensation for any tariffs, a promise that the car industry will be exempt from tariffs, or a pledge for indirect subsidies via R&D or similar areas.

One of the fantasies of the Brexiteers is that leaving the EU will allow the UK to set its own rules. The ‘hardest’ Brexit of all is to fall back on WTO rules. But there is a clue in the name. The WTO has, among other things a plethora of ‘anti-dumping’ rules. Any subsidy to any particular firm or sector would breach those rules, leaving the UK open to penalty under WTO rules and anti-dumping suits by any country which was importing those goods. The same would apply to any government providing R&D subsidies. Nissan will be aware of all this, even if UK ministers for Brexit are not. It can only be imagined that it has received a promise that the government will do all it can to remain in the Single Market. We shall see.

Corbyn is right. Migrants don’t drive down wages

yesCorbyn is right. Migrants don’t drive down wagesBy Tom O’Leary

In his recent speech to Labour Party conference Jeremy Corbyn said, “It isn’t migrants that drive down wages, it’s exploitative employers and the politicians who deregulate the labour market and rip up trade union rights.” This is excellent and entirely correct. It is probably the best statement ever made by a Labour leader on this issue.
It used to be regularly argued, and not just by far right or fascist groups, that immigrant workers take British workers’ jobs. This has more recently been supplanted with the notion that migrant labour has driven down wages. Both are equally wrong.

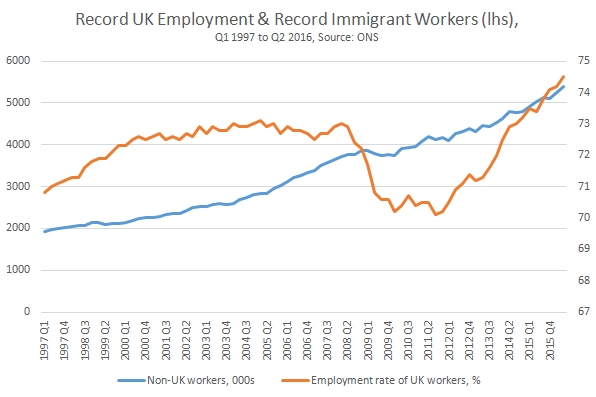
The claims that immigrants take jobs became harder to sustain as the level of the overseas migrant population reached record highs in Britain at the same time as a record high level of employment overall and a record high for employment of UK-born workers. Even so, the most recent Tory party conference tried to revive the racist claims, with lists of foreign workers, removing overseas doctors from the NHS and prioritising immigration controls over economic prosperity. Some of these have already fallen apart while they would all be deeply damaging to the UK economy, as well as fanning the flames of racism.

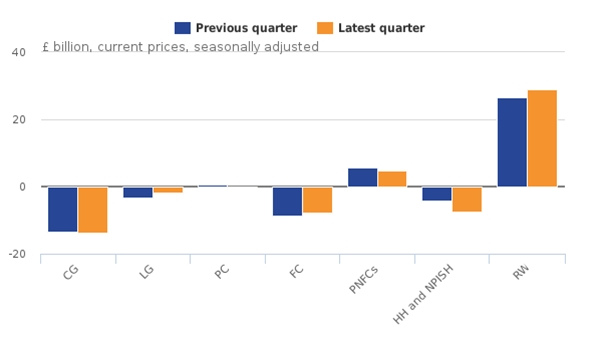
In fact, as shown in Chart 1 the record number of migrant workers now coincides with a record employment rate for workers in the UK. Since the beginning of 1997 the number of migrant (non-UK born) workers in the UK has risen from just under 2 million to nearly 5.5 million in mid-2016. At the same time the employment rate of workers in the UK has risen from 70.8% to 74.5%, a new all-time high (the unemployment rate is also close to its all-time low at 4.9%). No-one is having their job taken by a migrant worker.

Chart.1 Record Employment Rate in UK, % & Record Level of Migrant Workers, 000s
 

Instead, the anti-immigrant rhetoric has more recently focused on the claimed negative impact on wages arising from immigration. As this false idea has some sway even in the labour movement it is worth dealing with the false economic logic which forms its basis.

Employment and wages

The false claim that immigration drives down wages has long been exposed as relying on the ‘lump of labour fallacy’ . The long history of capitalism in general is that more and more workers across the globe are brought into production. That is still happening to this day. At the same time, for the overwhelming majority of those workers their material conditions have risen enormously over the same period. The growth of the workforce has been matched by the growth in the work available. This is because of the growth of the productive capacity of the global economy, in which workers fight for a share. 

Instead the attack has switched to the alleged impact of immigration on wages. As the discussion of this issue is so loaded with emotion and confusion in a country like Britain, it is important to set out some clear points of reference.

Objectively, there is no difference between a worker who travels ten miles, hundreds of miles or thousands of miles for work. There is of course no difference in terms of their skin colour, religion, gender, sexuality or nationality. Wages in any city or town are not more or less affected by the immigration of a worker from the next county than from a different continent.

Yet the idea that wages are driven down by immigration, that the price of labour (wages) is determined by the increased supply of labour from migration is closely related to the lump of labour fallacy. They both depend on the notion there is a fixed amount of work or fixed amount of wages, and that in both cases these are adversely affected by increasing the supply of labour through immigration. For the lump of labour, now read the ‘pool of wages’. These are false notions.

Wages have an absolute floor and an absolute cap. The absolute floor is set somewhere below the minimum levels of subsistence for the continued existence of the workers. In some cases, where slavery existed within capitalist production such as in the Southern United States or the European colonial powers’ operations in Africa and elsewhere, the workforce had to be constantly replaced as lives were destroyed in the production process. 

The absolute cap on wages is set by the absolute level of value created by all firms (which each individual firm shares in). Firms cannot sustainably increase the level of wages beyond the total value created, otherwise all firms would go bust. In addition, the value created will tend to rise as capital is accumulated over time (even though, as now there may be distinct periods of crisis when there is little or no accumulation). As capital accumulates and the productive capacity of the economy rises, the absolute cap on wages will also rise.

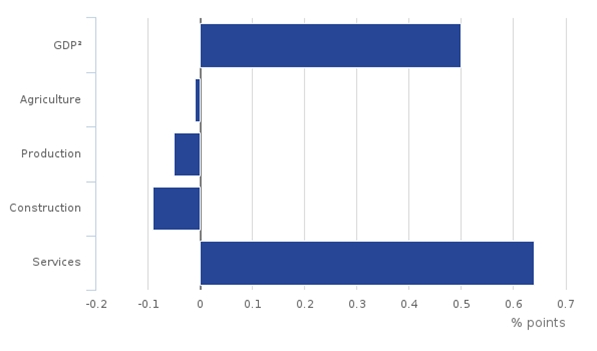
Yet most wages are set well within those bounds and by different factors. It is widely understood that there are two principal destinations for the value created in an economy. In Marxist terms, these are the value created by labour a portion of which is claimed by the capitalists, ‘surplus value’. In mainstream economics there is instead a focus on the labour share of national income and capital’s share of national income. Income is not the same as value so these are an only approximate guide to total value created and the portion claimed as surplus value.

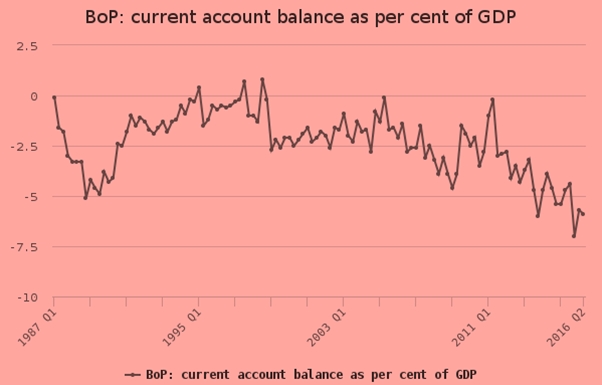
These proportions or ratios of value/income are not stable over time. In the Western economies the labour share of national income has been falling for a prolonged period. Chart 2 below shows the OECD estimate of the labour share of national income in selected groups of OECD economies from 1969 to 2014.

Chart 2 Labour Share of National Income, 1969 to 2014
 

As the chart shows there has been a dramatic decline in the labour share of national income. This is sometimes and mistakenly attributed to the forces of globalisation, that somehow workers in poorer countries have ‘taken the jobs’ or driven down wages in the advanced industrialised countries. This is simply a geographic variant on the ‘lump of labour’ or ‘pool of wages’ notions.

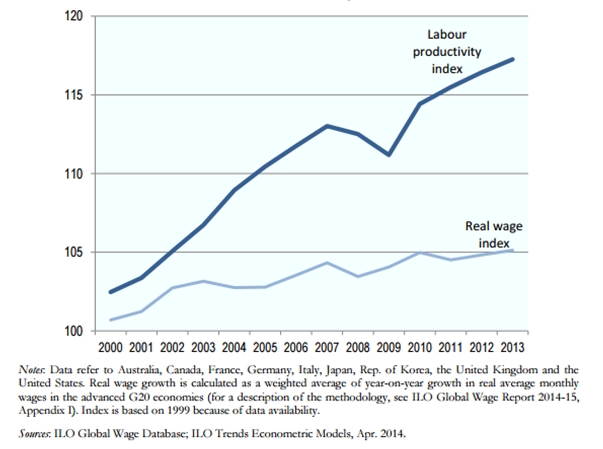
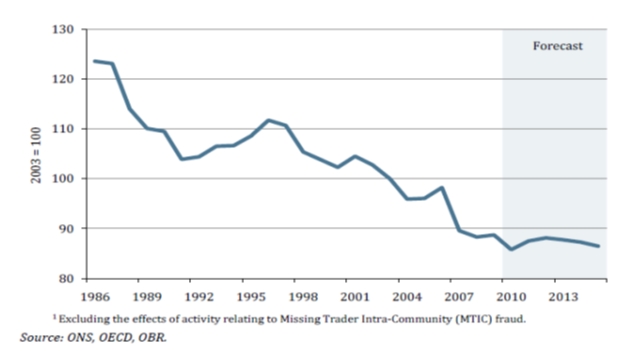
Chart 3 below the level of labour productivity in the G20 economies and the real wage index from 1995 to 2013, which includes the period which is regarded as one of accelerating globalisation. If labour in the advanced countries was being undercut by labour in poorer countries it would be extremely difficult for there to have been a rise in labour productivity in those countries. Production, especially high-value production would have been shifted overseas.

Instead, the chart shows that the rate of exploitation in the G20 increased over the period. A greater proportion of the value created by labour was claimed by capital as surplus value; the capital chare of national income rose.

Chart 3 Labour Productivity and Real Wage Index 1995 in G20, 1995 to 2013
 

Struggle

As the chart shows, the output per worker in these advanced economies rose more than three times as fast as the rise in real wages, which were close to stagnation. The workers in the advanced industrialised countries were not being undercut by workers in the ‘Third World’. They were being robbed even more by their employers in the advanced countries.

Within the absolute caps and floors set for wages by the value created by labour within all firms and the subsistence of the workers, the general and continuous contest between labour and capital over the share of that surplus is set by the class struggle. Over a prolonged period this is a struggle the capitalist class has been winning in the advanced industrialised countries.

In the OECD economies the proportion of workers in part-time employment has risen from 5.4% in 1960 to over 20% in 2015. Union densities were 35.6% in 1975 and had fallen to less than half that, just 16.7% by 2014. It is not workers outside the advanced industrialised countries who have lowered wages in the G20 countries. It is the capitalist class in the G20 which has robbed workers of a greater proportion of the value they create.

Of course, it is in the interests of those same capitalists to foster the idea that someone else is to blame. This partly accounts for the tenacity of these very false ideas. It also explains why far right and fascist groupings are tolerated or even promoted by big business, sometimes even funded by them.

But it is impermissible for the labour movement to adopt these ideas or even to adapt to them. This is not primarily a question of political morality, although that should enter calculations. The reason the labour movement as a whole should thoroughly reject any notion that jobs or wages are lost to migrant workers is primarily self-interest.
There is no example anywhere in history of a ruling class that offered to make one section of workers better off at the expense of others and that made good its promise to the former. Yes, it is possible to systematise discrimination against one of more sections of workers and make their lives an absolute misery, or even worse. But the distractions of racism, xenophobia, frenzied attacks on religious or national groups and so on are precisely that; designed to distract from the absence of any strategy to lead society out of its morass. The workers not directly under attack are only ever relatively better off. Their absolute conditions never improve as a result, and often worsen. The poor whites of Southern United States were immeasurably better off than the black slaves. But their living conditions did not improve, and ultimately the whole parasitic, bloodthirsty society had to be crushed by the industrial North.

If the labour movement pays the slightest lip service to these lies it does itself great injury. It disarms itself in the class struggle by agreeing that it is foreign workers, not rapacious bosses who have driven down wages, increased rents and increased prices. 

In fact the true position is that migrants add to net prosperity for the whole of society. Even if that view is not widely accepted in Britain, we may soon be provided with incontrovertible proof that it is correct. Unfortunately, this may well be a negative proof, as the Tory Government clearly aims to reduce immigration even at the expense of falling living standards. A position that used to be confined to UKIP’s cranks is now government policy. All our living standards will fall further as a result, if this policy is implemented. The labour movement has every reason to oppose its implementation.

Don’t be fooled: Tory austerity will continue

yesDon’t be fooled: Tory austerity will continueBy Matt Willgress

AT THE recent G20 summit, the new Tory Prime Minister Theresa May refused to rule out more austerity — including cuts to welfare — if the British economy suffers as we approach Brexit, and last week’s Conservative Party conference has confirmed that the new government is still tied to the failing, ideologically driven austerity agenda of the Cameron and Osborne years. 

Even ex-chancellor George Osborne had announced in March that he had “no further plans to make welfare savings” before the 2020 general election. 

Last month May said: “Obviously we have to look and see what happens in the economy and how the economy does start to move — if there is any further movement post the Brexit result. 

“Obviously anyone will be looking very carefully at how the economic situation pans out.” 

May also made it clear that there will be no end to Tory austerity, saying: “What I’m clear about is we’re going to continue as we have done in government over the last six years — ensuring that we’re a country that can live within our means.” 

This followed the new Chancellor Philip Hammond saying that he may have to “reset” the government’s tax-and-spend policy if the economy starts to go downhill this autumn. 

Indeed, the government has also said that the decision on whether to make such changes to tax-and-spend policy will be made in time for the Autumn Statement on November 23. 

Contrary to many mainstream media reports that austerity is now over, which were repeated again throughout the Conservative Party conference, the government is not only refusing to offer any guarantees regarding further cuts, but it should also be remembered that this is despite the continuous Tory attacks and cuts since 2010, and the fact that deep further cuts are already underway or due to come.

Last week’s Tory conference further showed that the government is still tied to austerity and has no grasp of the scale of the challenge facing the British economy in terms of chronic under-investment. Take for example housing. 

The Tories then announced £2 billion of public money for housing and £3bn in private-sector loans to small builders. 

This would only build 33,000 houses over five years and is totally inadequate. This is in a situation where we need 200,000 new homes to be built a year just to stand still. 

In contrast to this approach, what most serious economic analysts are agreed on is that the economic uncertainty following the EU referendum result means that the British economy needs more investment, not more cuts.

Investment has fallen in all G7 economies, but British levels of investment are 4 per cent of GDP below the average. 

Just to make investment in Britain up to this level you’d need £80bn additional investment per year over a parliament. In contrast to the failed Tory approach, Jeremy Corbyn’s re-election and the policies set out at this year’s Labour conference have seen us stake out how a Labour government would deliver a £500bn public investment programme to build our infrastructure, manufacturing and new industries, moving us to a low-carbon economy, delivering good jobs and tackling the housing crisis.

This is the credible — and transformative — economic strategy that Labour needs for a general election victory and will raise living standards in Britain. 

Therefore, our urgent work in both opposing the cuts nationally and in our communities, and popularising a progressive alternative to ideologically driven austerity, becomes even more vital, alongside building electoral support for Labour. 

Following this summer’s leadership campaign and party conference, the Labour Assembly Against Austerity (which brings together support for the People’s Assembly Against Austerity movement within the Labour Party) will continue a series of campaign initiatives and events to bring about this change and win the argument that austerity is a political choice, not an economic necessity. Please join with us!

· The Labour Assembly Against Austerity is hosting a major national conference on Saturday October 22 entitled Winning With Jeremy — Labour’s Alternative to Tory Austerity. Initial speakers include: Jon Trickett MP, Diane Abbott MP, Richard Burgon MP, Catherine West MP, Professor Victoria Chick, Christine Shawcroft of Labour NEC, TSSA general secretary Manuel Cortes and Unite assistant general secretary Steve Turner. 10am to 5pm at Student Central, Malet St, London, WC1E 7HY. Register online at www.labourassemblyagainstausterity.org.uk or on the door (Tickets £10/7).

This article was first published by the Morning Star, where it can read here.

Pounded by Brexit

Pounded by Brexit
By Tom O’Leary

The British economy is extremely dependent on inflows of overseas capital. As a result, it is one of the last countries that should ever contemplate leaving the EU without a serious plan for reviving the economy with investment and trade. As we now know, no such plan exists, serious or otherwise. Instead the theme of the Tory party conference was not ‘Britain open for business’ or a similar claim of questionable authenticity. The message from the Tories was simply ‘foreigners go home!’.

Unfortunately, for the overwhelming bulk of the citizens of this country wherever they were born, the practical understanding of economics by major international investors is considerably greater than the leadership of the Tory party. Those overseas investors whose willingness to lend to Britain is decisive for living standards understand that any country whose government insists on cutting itself adrift from the world’s largest trading bloc, is reckless about its economic planning and which is determined to push out a section of its workforce vital to its prosperity will not hold the same attractions for investment as previously.

Chart 1 below shows the financial balances of different sectors of the economy over the last two quarters. The Rest of the World represents overseas investors, by far the biggest lender in the economy as a whole. In the first and second quarters of this year overseas investors lent the UK economy £26.5 billion and £29 billion respectively, much larger than in the same period last year. Without this lending the other sectors of the economy combined would have to sharply increase their own savings/reduce their borrowings. This would entail a sharp reduction in expenditure, either falling Consumption or falling Investment or both in order to bring the domestic sectoral borrowing and lending into balance.

Chart 1. UK Net Sectoral Lending, Q1 2016 and Q2 2016, £bn
CG + Central Government, LG = Local Government, PC = Public Corporations, FC = Financial Corporations, PNFCs = Private Non-Financial Corporations, HH and NPISH = Households and Non-profit sectors, RW = Rest of World
Source: ONS
 
Net borrowing from overseas is the necessary counterpart of the huge current account deficits the UK economy has been incurring. The current account is the sum of all payments between an economy and the rest of the world, comprising its net trade balance and its balance on financial transactions. The current account deficit reached a new record low at the end of 2015 at 7% of GDP, although it has since recovered modestly (which may be a seasonal effect).

The sharp deterioration in the current account balance has arisen because the persistent trade deficit has combined with a fall in the level of payments from overseas that the UK economy receives from its holding of overseas financial assets. This seem to be linked to the shrinking and international retreat of the UK-based banks in the wake of the financial crisis and their forced sale of overseas assets, or their most profitable assets.

 
Chart 2. UK Current Account Balance, as % of GDP
Source: ONS

The UK economy is therefore extremely vulnerable to any decline in an overseas willingness to lend. If this occurs it must be countered by a relative decline in living standards, a forced reduction in expenditure (private or public, Consumption or Investment) and higher interest rates to attract overseas investment, or some combination of these.

There is of course no zero bound on the lending of overseas investors to the UK. Instead of merely reducing their lending and/or demanding a higher interest rate to do so, they may become net sellers of the considerable UK assets they have built up over previous decades, pausing only to pick up some newly cheap assets on the way. The Government’s resumed privatisation programme beginning with its remaining stake in Lloyds Bank might fit this description. But this in turn would cause further structural outflows from the UK economy as the yield on those cheaply-purchased assets flows overseas.

This is the importance of the sharp recent decline in the value of the pound and the rise on the interest rates on Government bonds (gilts). The rise in gilt yields means that taxpayers are forced to increase their interest payments, primarily to attract overseas capital. 

Sharp currency devaluations of this kind effectively reduce the international purchasing power of all income denominated in the domestic currency, in this case pounds. As a result, there will be improvement in the current account and trade balances, as imports become too expensive, some exports rise and the value of the yield on overseas assets increases when converted into pounds.

But this is in effect an enforced ‘improvement’. In popular phraseology, an economy living beyond its means has been forced to tighten its belt. Net domestic savings are negative, and overseas investors can choose not to lend to the UK economy. The occasion of this is the outcome of the Brexit vote and the Tory leadership’s determination to pursue ‘hard Brexit’.

It should be absolutely clear now to all except the wilfully ignorant that the current crisis actually impoverishes the overwhelming majority. All of these are Brexit effects, even before Brexit happens. The Tory party conference signalled that the priority would be anti-immigration, not pro-growth through the Single Market. Blocking access to the Single Market and attempting to lower immigration will both have the effect of lowering living standards further, even when the pound eventually finds a floor.

The alternative is equally clear. The UK should not leave the Single Market and should embrace its essential component Freedom of Movement as both are decisive for future prosperity. Logically, it would be foolish then to leave the EU which simply means having no influence or vote in future developments and would probably entail a sharply increased Budget contribution. Brexit is making us poorer.

Britain’s trading performance is making us poorer

yesBritain’s trading performance is making us poorer
By Tom O’Leary

Britain is not a great trading nation, or more accurately is no longer a great trading nation. Its exports are just one third of Germany’s. As recently as 1988 UK exports as a proportion of GDP were larger than Germany’s exports on the same measure. Exports can be a key driver of growth, for all countries. It is therefore extremely important to understand how that can be achieved in Britain and what both the scale and the scope of the problem is.

Some simple maths

It is sometimes argued, in what is described as growing anti-globalisation sentiment, that all nations cannot have export-led growth, or that the growth of trade is itself in some way exploitative. Both of these views are quite commonplace and wrong.

If the world economy were a zero-sum game, it would of course be true that the growth of one country’s exports has its counterpart in the decline of another country’s exports. But the world economy isn’t a zero sum game. What it actually leads to is the growth of another country or countries’ imports. This distinction matters.

If something is growing, such as world trade, it is possible for all countries to have rising exports. Further, if something is growing faster than GDP, such as trade, it is possible for all countries to have exports rising as a proportion of GDP.

This is exactly what has happened. Table 1 below shows the proportion of exports in the GDP of selected leading economies. In all cases exports have risen as a proportion of GDP.

Table1. Selected Economies Exports as a Proportion of GDP
Source: OECD

In all cases exports have risen as a proportion of GDP, although the growth of UK exports has been the weakest of all. But to be clear, if exports are rising as a proportion of GDP, this of course means the exports have grown faster than GDP for all these countries.

Unfortunately, the growth in the level of exports as a proportion of GDP in the UK has been the weakest of all these economies over a prolonged period. Exports have risen faster than UK GDP, but much less strongly than in other economies. Exports have not contributed as much to UK growth as they have in other countries. 

To avoid any misunderstanding that the growth of exports in these economies has been at the expense of other, poorer countries, Chart 1 below shows the proportion of exports in the GDP of all Low and Middle Income Countries over a similar period 1970 to 2015. Exports have risen strongly as a proportion of GDP for all Low and Middle Incomes in aggregate. Exports comprised 8.8% of GDP for this group of countries in 1970 and this had risen to 25.5% of GDP in 2015. This represents a rise of 290%. Low and Middle Income Countries have also experienced export-led growth. Of course, as with other countries this has declined from 2007 onwards as part of the Great Recession.

 
Chart 1. Low & Middle Income Countries’ Exports as % GDP
 
Some fundamental economics

It is only possible for the whole world to experience rising exports as a proportion of GDP if world trade grows faster than world GDP. This in turn implies that exports lead GDP growth and, furthermore, that the greater the participation of an economy in growing world trade the faster it will grow, all other things being equal.

This corresponds to the most fundamental laws of economics. These were first elaborated by Adam Smith in ‘The Wealth of Nations’, where he sets out what he describes as the division of labour as the most fundamental force in developing the productive level of the economy. This concept was itself developed by Marx in Volume I of ‘Capital’, where the socialisation of production brings in all the productive forces of a society, capital in all its forms as well as land and labour. For Marx, the motor force of economic development is the socialisation of production and is the economic basis of socialism, the integration of all production determined by the needs of society as a whole.

The growth of trade at a faster rate than GDP is just one aspect of the overriding importance of the (international) division of labour, or socialisation of production. Another is the growth of the capital stock (Marx’s ‘organic composition of capital’) at a greater rate than GDP, which is why the rate of investment is the second-most important factor in determining growth. A further factor is the importance of education, as labour becomes increasingly skilled in order to function in an increasingly complex and interconnected, or socialised economy.

This socialisation of production means that inputs grow faster than outputs. These inputs include both capital, including fixed capital and circulating capital, as well as the inputs of labour, both the numbers in work and their levels of skill and education.

All the preceding points made in relation to exports apply equally to imports. Indeed, they have to as the sum of world exports must equal the sum of world imports, even if the statisticians struggle to align the two. 

It would be one-sided and so false to examine only the growth of exports. Imports necessarily grow at the same pace, at least on a world scale. In addition, because production is increasingly socialised, it is necessary to import in order to export.

In general, the largest Western economies and the most productive are highly dependent on imports in order to export. The import content of exports tends to be around 25% of the total. According to the OECD in 2011 the import content of exports was 28.2% of the total. For the OECD as a whole, even in the relatively short period 1995 to 2011 the import content of exports has risen from 14.9% to 24.3%. This is shown in Chart 2 below.

 
Chart 2. OECD Countries Import Content of Exports, Percentage
 
The rise in the import content of exports is rising extremely rapidly as the world economy becomes increasingly integrated. The partial exception to this general rule is the US, which also has an increasing import content, but the proportion was only 15% in 2011. This is because the US has built a somewhat more self-contained, but nevertheless vast, continental-sized economy. 

Just as both exports and imports are rising faster than GDP, the import content of exports is also rising even faster than exports/imports themselves. So, the import content of exports is the fastest-growing aspect of the all the OECD economies’ growth. This provides a clear indicator that inputs grow faster than outputs, and that the socialisation of production is a fundamental factor in the development of the productive capacity of the economy.

There are a number of consequences that flow from this factual and theoretical analysis. One of them is that the idea of a national-based economic revival is a pipedream and that restricting imports in an advanced economy in order to boost economic activity is a backward-looking fantasy. It would cut any an economy off from the most advanced technologies and the integrated supply chains which increasingly determine world economic activity. Therefore, for any economy the key task is ensure its optimal insertion into the world economy under the most advantageous circumstances.

In addition, efficiency of all investment is a function of its access to the most productive (efficient) capital equipment in the world. A relatively poor country would be able to increase production much more effectively with access, say, to the most advanced harvesting machines, than if it expended far greater sums in creating its own inferior equipment. This is the same analogy as Adam Smith’s pin maker transposed to a national or international scale. (Although for a developing economy a period of protection for one or two sectors may be necessary or desirable as they ready to enter the world economy).

The contrary policy where import substitution is the dominant trend has been tried and failed miserably on numerous occasions. The collapse of Argentina’s relative economic wealth under Peron and others, or the stagnation of Franco’s Spain all testify to the bankruptcy of this policy when it is adopted wholesale and pursued vigorously. The modern exemplar would be North Korea.

The UK example

Data already shown in Table 1 indicate that the UK economy had by far the greatest proportion of exports in GDP of any of the major economies in 1970. It still has one of the larger export shares of the leading economies but it has experienced a sharp relative underperformance of its growth compared to other countries.

Chart 3 below shows the sharply declining UK share of world exports markets and the Office for Budget Responsibility’s own assumptions of further decline. In the index the 2003 level equals 100. The data are stark, showing that the UK’s export share of world trade has fallen by 30% in 30 years.

Chart 3 UK’s Share of World Export Markets, 2003 = 100
Source: OBR

Throughout the crisis a number of ideas have been advanced regarding both its source and the cures. However, many of these are simply incapable of addressing the chronic decline in export competitiveness. The notions that the UK could reverse its plummeting export performance by monetary measures, or by reversing ‘financialisation’, or by boosting ‘demand’ or by tax reform, however laudable they may be in themselves, are frankly silly.

The crisis of British export performance is a crisis of competitiveness brought on by lagging productivity. This is itself is caused by very low relative levels of UK investment. With the exception of Japan, the rest of the G7 countries have higher productivity than the UK. France, Germany and the US are all more than 30% more productive, as shown in Chart 4 below.

Chart 4. UK and G7 Productivity, UK=100
 

Productivity, output per hour worked, is determined by the amount or sophistication of machinery and equipment in the production process, as well as the skills of the workforce. More or better machinery requires investment. This in turn is a function of the level of investment, both in capital and in the skills and education of the workforce. Taking only the former, it is easy to see why UK productivity languishes so lowly in the international comparisons and why its export growth has been so limited. Chart 5 below show the proportion of GDP devoted to investment (Gross Fixed Capital Formation) in the G7 economies (of course the level of Chinese investment and its export growth are considerably higher).

Chart 5. GFCF as a Proportion of GDP in the G7 economies
 

In 2014 the proportion of GFCF in UK GDP was just 17%, compared to over 21% for the G7 average. Simply in order not to fall further behind would require increasing UK investment by approximately 4% of GDP, or £75 billion a year. To actually begin to close the productivity and competitiveness gap would require significantly more, at least £100bn additional investment per annum. This is the task facing the UK economy if policy is aimed at benefitting from the growth in world trade.

The apparent Tory Party U-turn on public investment is in reality a purely rhetorical one. In his day Osborne too was fond of donning a hard hat and talking about investment. But under current plans public sector net investment is due to reach new all-time lows under this Government. The £2 billion promised for housing builds very few houses and does not register at all in measures of investment as a proportion of GDP.

Separately, the accumulation of all investment (the capital ‘stock’-Smith, the ‘organic composition of capital’-Marx) is itself dependent on the size of the market. What has become known as ‘economies of scale’ is in reality the level of productive capital appropriate to the scope of the market in which it operates.

The largest market in which the UK economy can operate with its current level of productive capacity is the EU. If it were going to flourish in a global market it would need to compete with countries such as India or China, where investment as a proportion of GDP ranges from 33% to 43%, led by state investment, which no-one intends.

Conclusion

Therefore, given current levels of UK investment membership of the EU and single market is vital to maintain even the economy’s current level of integration in the international division of labour and into global supply chains. If other countries have higher levels of investment, UK levels of wages will converge to their level simply in order not experience a catastrophic loss of competitiveness.

This analysis also highlights the scope of the challenge facing the next Labour Government. £75 billion a year in public sector net investment and rising is required simply in order not to experience further declining competitiveness. Membership of the EU and the Single Market are both vital to medium-term economic prospects. Otherwise, the long-term relative decline of the UK economy, its productivity and living standards will continue.