January 2014

World Bank sees a ‘turning-point’ in world economy

.857ZWorld Bank sees a ‘turning-point’ in world economyBy Michael Burke

The World Bank has recently released its updated forecasts for the world economy. Two key features of the forecasts have received the greatest attention. The first is that the World Bank describes the overall trend in the world economy as at a ‘turning-point’ and secondly that this is led by a recovery in the advanced industrialised countries, or High Income Countries in the World Bank’s categorisation.

In terms of the forecasts, global GDP growth is expected to advance from 2.4% in 2013 to 3.2% this year rising to 3.4% in 2015 and 3.5% in 2016. Within that the Developing Economies are expected to grow by 5.3% in 2014, accelerating to 5.5% and 5.7% in 2015 and 2016 having grown an estimated 4.8% in 2013. But the bigger contribution to global growth is expected to come from the High Income Countries (HICs) which grew by just 1.3% in 2013 (estimated) rising to 2.2% in 2014 and 2.4% in both the following years.

So global growth is only ‘led by’ the HICs in the sense that the modest acceleration in projected growth is from the low base of 2013, a rise from 1.3% to 2.4%. By contrast the Developing Economies as a whole are expected to accelerate from 4.8% in 2013 to 5.7% in 2016, a rise of 0.9%. As a result the growth gap between these two key categories of the global economy narrows from 3.5% to 3.3%, on World Bank forecasts.

Over the medium-term the compound effect of growth differentials of this magnitude is very large. If a 3.3% differential in growth were maintained over 25 years, the Developing Economies would double in size relative to the HICs.

Turning to the performance of the HICs alone, the chart below shows World Bank data for their gross savings and investment (Gross Fixed Capital Formation) as a proportion of GDP (left-hand side). The growth of GDP is the grey line shown on the right-hand side.

What is clear is that all three variables are in a downtrend. That is, both the cyclical high-points and low-points become progressively lower over time. The slump in activity in 2008 and 2009 is the exception not the rule. The rule is a steady downtrend in activity.

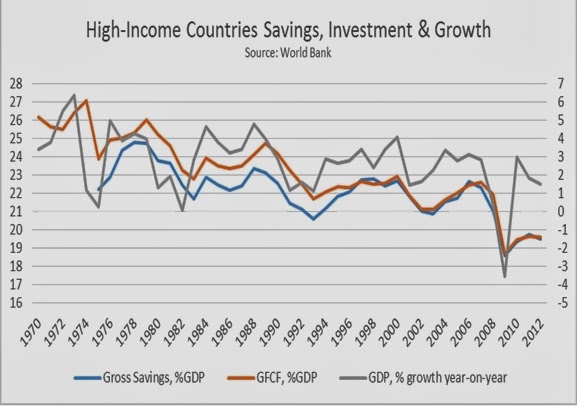
Savings are the basis for investment. Of course savings can be supplemented by borrowing but as both the interest and principal on debt must be repaid at some point, debt can only serve to reschedule the time when savings are used for investment.

It is the declining proportion of GDP devoted to investment which is the primary determinant of the slowdown in GDP growth. All output is either consumed or it can be saved for investment purposes. It is only with the accumulation of capital through investment that economic activity can expand.

GDP growth in the industrialised countries is in a long-term downtrend because economic activity is determined by the declining rates of savings and investment. The ‘turning-point’ for the HICs may only be growth is no longer falling. But it is not in an uptrend.

Developing Economies’ Turmoil

However it is also notable that from the mid-1970s to the late 1990s investment exceeded the gross savings of the HICs. This can only arise by the HICs drawing on the savings of other countries and using them for investment. The last great wave of savings flowing from the Developing Economies to the HICs (primarily the US) was in 1997 and 1998, through the Asian financial crisis. Since that time savings and investment have been almost identical.

The World Bank among others highlights the risk that talk of a recovery in the industrialised economies will combine with reduced money-creation (‘tapering’ by the US Federal Reserve) to place some of the Developing Economies in severe difficulties. Some Developing Economies have low savings levels and are highly dependent on inflows of foreign capital to finance overseas debts or trade deficits, or both. The risk is that savings flowing into New York, London and other financial centres from the high savings economies (mainly in Asia) will stay there and not be recycled to the Developing Economies that require them. Financial markets have already identified a hit-list of potential casualties.

The graphic below from the Financial Times highlights some of those economies. The currencies of Indonesia, South Africa and Turkey have all fallen by approximately 20% versus the US Dollar in the last year. Other countries on this list include Brazil, India, Chile, Hungary and Poland.

The financial market speculators and the FT may not be proved correct. Certainly some countries listed have ample foreign exchange reserves to meet external funding needs for quite some time. It is also possible that they could come to some bilateral arrangements with high-savings economies who might choose to invest directly in these economies. Of these high-savings economies China is the most important.

Even so it is noteworthy that chaos and dislocation has already begun in some Developing Economies because of developments in the indistrialised countries led by the US. The HICs have a feeble economic recovery that does not threaten to break out of the long-term downtrend. But the weakness of savings and investment in the industrialised economies is so marked that any upturn comes at the expense of growth and living standards in some Developing Economies.

The ‘turning-point’ that the World Bank speaks of is unlikely to be a return to robust growth in the industrialised economies. The greater risk is that it is actually a new round of turmoil for many of the Developing Economies.

How bad will it get?

.690ZHow bad will it get?By Michael Burke

Chancellor George Osborne has recently been promoting two ideas. One is that a recovery is under way and the other is that further cuts in government spending are needed, up to £25bn.

The contradictory nature of those two statements tells us something important about the nature of the current recovery and the actual content of economic policy. It is clear that however weak the current recovery is, the overwhelming bulk of the population will not benefit from it. Austerity policies have always been aimed at transferring incomes from labour and the poor to capital and the rich. So for example, a VAT increase was said to be necessary to cut the deficit yet was simultaneously implemented with a cut in the corporation tax rate which reduced government revenues by almost exactly the same amount.

The popular shorthand for this is a recovery solely for the 1%. The class content is clear. The policy is designed to boost capital at the expense of labour and its allies.

Austerity is not at all designed to boost total economic output, in which capital might be one of the beneficiaries. The reason is simple. In the ordinary course of events an economic downturn or slump leads to a fall in profits far greater than the fall in output. A simple recovery in output could entrench that for a prolonged period.

So, the owners of a car firm sell cars worth £1,000 million in a year. Their main costs are all the inputs of labour, capital and raw materials amounting to £800 million. But these largely to tend to stay the same or even continue to rise a little when the downturn occurs. Suppose sales fall by 10% to £900 million. Input costs are unaltered in aggregate. Now profits are only £100 million and previously they were £200 million. On a 10% decline in sales, profits have fallen by 50%. Profits fall faster than output.

From the owners’ perspective the danger is that over the next period everything, sales and input costs all rise at the same rate. If so, once they have more or less recovered to £990 million in sales (an increase of 10%) the costs of labour, capital and raw materials will have risen in parallel by 10% to £880 million. Where the profit margin was previously 20% now it will be just 11%. Austerity policies are designed to avoid this permanent and unacceptable decline in the profit rate by pushing costs lower (or increasing unpaid labour though zero hours contracts, unpaid overtime, reduced pension benefits, etc.).

There is no shortage of capital to invest. SEB has previously shown that British firms are sitting on a cash mountain as are firms in nearly all the Western economies. But it is imperative from their perspective to permanently lower costs, most especially labour costs before resuming investment.

To date this project has met with only limited success. Profits, as measured by the Gross Operating Surplus of firms is £14bn lower than in the first 3 quarters of 2008 when the slump began.

This explains the weakness of the recovery as firms continue their investment strike. The NIESR chart below will be familiar to many readers. It shows the current slump in relation to the most severe recessions of the 20th century. Although not as severe as the Great Depression the current crisis has lasted considerably longer. All prior slumps had led to a recovery after 4 years (48 months). By contrast the current downturn remains 2% below its pre-recession peak. It will be at last 6 years before there is a recovery of the previous level of output.

Source: NIESR

It may be useful to delve further back in history for comparison. Between 1879 and 1893 the British economy grew by just under 13% in what has become known as the Long Depression. Even if growth in the 4th quarter of 2013 was reasonably strong, for the year as whole GDP would be 2.5% below the level of 2007 a full 6 years later.

The current cycle is compared to the Long Depression in the chart below. For the time being, even this comparison is not encouraging as the current slump is currently more severe.

There can be no suggestion that any previous recession can be mechanically extrapolated in order to suggest the path from the current crisis. But the comparisons do provide a context for the both the severity and duration of the current slump. They also belie any nonsense from the supporters of austerity about the strength of the current recovery.

The recovery itself remains dependent on a revival in investment. This is not the same as an upturn in ‘demand’, which is comprised of both consumption and investment. Household consumption has almost completely recovered its prior peak and government consumption is at a new high. The fall in investment more than accounts for the entire fall in GDP. The fall in business investment alone (not including government or household investment) exceeds the fall in output.

This is also true historically. After contraction the British economy crawled along at a snail’s pace for a further decade in the Long Depression. It only began to grow robustly from 1894 onwards. Through most of the Long Depression investment continued to decline. It was only when investment recovered its pre-recession peak in 1894 that the economy began to grow robustly. This relationship between growth and investment during the recession and recovery of the Long Depression is shown in the chart below.

The structure of the British economy is very different now and so too is its weight and role in the world economy. Then increased exploitation of a growing colonial empire combined with increased military spending were key components of the recovery. Britain’s relative economic decline since then means that option is closed.

Even with increased imperial exploitation it required a full recovery in investment to end of the Long Depression. Unless and until there is a full and robust investment recovery the British economy is set to remain in an Osborne-recovery, weak and solely for the 1%.