October 2013

Labour Assembly Against Austerity

.698ZLabour Assembly Against Austerity

Labour Assembly Against Austerity

Speakers

 9am – 5pm, Saturday 9th November
Birkbeck College, Malet Street, London WC1E 7HX

Speakers include:


Ken Livingstone
Owen Jones
Francesca Martinez
Steve Turner (Unite)
Ann Pettifor

Diane Abbott MP
Katy Clark MP
Jeremy Corbyn MP
Frank Dobson MP
John McDonnell MP
Michael Meacher MP

Professor Keith Ewing
Tosh McDonald (ASLEF)
Peter Willsman (CLPD)
Adrian Weir (Campaign for Trade Union Freedom)
Catherine West PPC
Cat Smith PPC
Murad Qureshi AM
Heather Wakefield Unison

Shelly Asquith
Daniel Blaney
Michael Burke
Mike Hedges (Unite)
Conrad Landin
Cllr Alice Perry
Christine Shawcroft (NEC)
Cllr Kate Taylor
Marsha-Jane Thompson (Defend the Link)

Sessions:

  • The economic alternatives to austerity
  • Housing – solving the crisis
  • No to privatisation – keep health and education public
  • Opposing austerity – defending public services and the welfare state
  • Defend the link – defend trade union rights
  • No scapegoating – immigrants and claimants are not to blame
  • Fund public services not war
  • Ending austerity – Labour policies to win in 2015

£10 full price / £5 concessions
Register now

Visit LabourAssemblyAgainstAusterity.org.uk

Speakers

Labour Assembly Against Austerity –  a forum for Labour Party members to discuss alternatives to austerity and the policies Labour needs to stimulate growth, jobs and rising living standards.

The Labour Assembly Against Austerity is an initiative of Next Generation Labour in support of the People’s Assembly Against Austerity movement and is supported by Unite, UCATT, BECTU, CLPD, Labour Representation Committee, Left Futures, Chartist, Labour Briefing Co-op, Morning Star, Red Labour & Sinistra Ecologia e Liberta UK.

The cash hoard of British firms

.030ZThe cash hoard of British firmsBy Michael Burke

The crisis of all the western industrialised economies is one brought about by the refusal of firms to invest, an investment strike. SEB has previously shown that for the Western economies as a whole the investment strike is leading to two simultaneous trends. While the portion of profits that remains uninvested is growing, payouts to shareholders are reaching record levels and there is a growing cash mountain held by firms.

This article in The Guardian by the present author highlights that process in Britain.

The chart below illustrates the growth of uninvested profits (and does not appear in The Guardian article).

 
In 1970 the level of investment in the economy (Gross Fixed Capital Formation) was equivalent to over two-thirds of the gross profits of firms (Gross Operating Surplus). By 2000 this investment ratio (investment as a proportion of profits) had fallen to a little over half and declined a little more by 2007, just before the slump. But in 2012 the investment ratio had fallen to just 43%. If this investment ratio were to return now to the 1970 rate, the level of investment would rise by £122bn, or nearly 9% of GDP.

£75bn

There happens to be a neat coincidence between the current crisis and the combined hoarding cash and the payout to shareholders. Up to the 2nd quarter of 2013 (the 3rd quarter data are not yet available) investment had fallen by £75bn, far more than the decline in GDP (now at £40bn). £75bn is almost exactly the same rate at which companies’ cash hoard has been growing annually since the crisis began in 2008. It is also slightly exceeded by the anticipated payout to shareholders in 2013 of £80bn. Far from being ‘no money left’ these two sources alone, shareholder dividends and the growing cashing mountain, are double what is required to resolve the current crisis.

Recently government ministers have taken to begging companies to invest their cash mountain, after cajoling and bribery have both failed. This can be illustrated through the government policy of cutting corporate taxes and the fallacy that this will spur investment. In 1970 corporation tax was 40% and it has been slashed by this government on the road to a 20% rate, but the investment rate has fallen by around one third.

None of these government efforts will work. Privately owned firms are driven by the concept of ‘shareholder returns’, which is itself counterposed to economic well-being for the overwhelming majority of the population. For them, only the restoration of profits will encourage investment, not pleas for the general good.

The soaring level of uninvested profits, and their diversion towards dividends and a growing cash mountain is the great disappearing trick of the current economic crisis. Until it is resolved the fundamental source of the crisis will remain unaltered.

The cash hoard of Western companies

The cash hoard of Western companiesBy Michael Burke

Supporters of ‘austerity’ would have a very strong argument if there really were no money left. In that case, opponents of current policy would be left arguing only for a fairer implementation of those policies, or that perhaps they could be implemented more slowly.

This is not the case. Firms in the leading capitalist economies have been investing a declining proportion of their profits. This is the cause of the prolonged period of slow growth prior to the crisis and a number of its features such as stagnant real wages, so-called ‘financialisation’ and the growth in household debt.

This negative trend of declining proportion of profits directed towards investment reached crisis proportions in 2008 and is the cause of the slump. As a consequence of the sharp fall in this investment ratio there has been a sharp rise in the both the capital distributed to shareholders and in the growth of a cash hoard held by Non-Financial Corporations (NFCs). This cash hoard is a barrier to recovery, releasing it could be the mechanism for resolving the crisis.

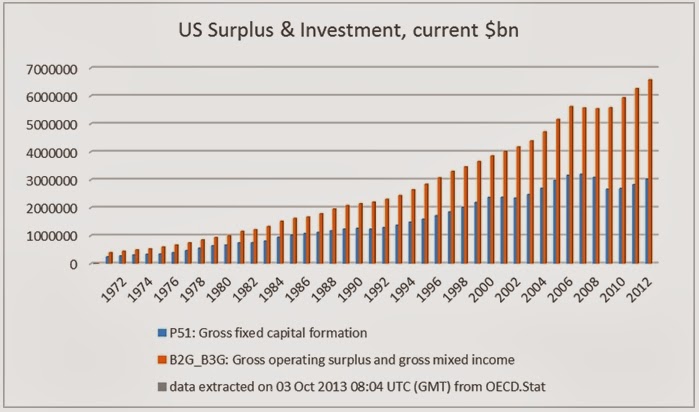
The chart below shows the level of surplus generated by US firms (Gross Operating Surplus) and the level of investment (Gross Fixed Capital Formation) for the whole economy. Since the former are only presented in nominal terms, both variables are presented here in the comparable way.

Fig.1

 
The nominal increase in profits has not been matched by an increase in nominal investment. In 1971 the investment ratio (GFCF/GoS) was 62%. It peaked in 1979 at 69% but even by 2000 it was still over 61%.

It declined steadily to 56% in 2008. But in 2012 it had declined to just 46%.
In a truly dynamic market economy there is nothing to prevent the investment ratio from exceeding 100% as firms utilise resources greater than their own (borrowing) in order to invest and achieve greater returns.

Therefore even an investment ratio of 69% is sign of a less than vigorous market economy.
However the subsequent decline in the investment ratio to 46% is a sign of enfeeblement. If US firms investment ratio were simply to return to its level of 1979 the nominal increase in investment compared to 2012 levels would be over US$1.5 trillion, approaching 10% of GDP. This would be enough to resolve the current crisis, although it would not prevent the re-emergence of later crises.

Distribution of profits

The uninvested portion of firms’ surplus essentially has only two destinations, either as a a return to the holders of capital (both bondholders and shareholders), or is hoarded in the form of financial assets. In the case of the US and other leading capitalist economies both phenomena have been observed. The nominal returns to capital have risen (even while the investment ratio has fallen) and financial assets including cash balances have also risen. One estimate of the former shows the dividend payout to shareholders doubling in the 8 years to 2012, an increase of US$320bn per annum.

The growth of cash balances is shown in the following data from the Federal Reserve. They are the changes in key balance sheet aggregates for US non-financial corporations from 2008 to Q2 2013.
Change in Balance Sheet Components, US NFCs, 2008 to Q2 2013, US$bn.

2008 Q2 2012 Change
Total assets 29,881 33,662 3,781
Total net assets (deducting liabilities) 16,656 19,470 2,814
Non-financial assets 16,945 17,686 741
Financial assets 12,937 15,975 3,038
-checkable deposits 14 386 372
-time deposits 382 597 215
-non-financial item:
Business equipment
3,896 4,191 295

Source: Federal Reserve

Total assets of US NFCs have risen by nearly US$4trillion over the period which is equivalent to approximately 25% of US GDP. The increase in net assets of US$2.8bn (after accounting for the rise in liabilities over the same period) is more than accounted for by a rise in financial assets of over US$3 trillion. 

By comparison the rise in the current cost value of business equipment has been less than one-tenth that (and is accounted for by inflation).

Within the rise of financial assets, cash or near-cash instruments have contributed a rise of nearly $600bn (the biggest single contributor in the accounts is ‘miscellaneous financial assets’).

Generalised phenomena

The same is true in other capitalist economies. In 1995 the investment ratio in the Euro Area was 51.7% and by 2008 it was 53.2%. It fell to 47.1% in 2012. In Britain the investment ratio peaked at 76% in 1975 but by 2008 had fallen to 53%. In 2012 it was just 42.9% (OECD data).

The cash hoards are no less striking. The total deposits of NFCs in the Euro Area rose to €1,763bn in July 2013 of which €1,148bn is overnight deposits. This is a rise of €336bn since January 2008, nearly all of which is in overnight deposits, €306bn. In Britain the rise in NFCs bank deposits has been from £76bn at end 2008 to £419bn by July 2013.

In reality, this extraordinary accumulation of cash by NFCs began well before the immediate depression in 2008, along with the slump in investment. Both of these merit further elaboration elsewhere.

Conclusion

The profitability (profit rate) of US firms and firms in other Western economies has fallen, and even the absolute mass of profits fell for a period in the recession. While the former has not recovered, the latter has. But this has not led to a corresponding rise in investment and the investment ratio has fallen sharply.
The destination of of these uninvested profits is twofold. Owners of capital are in receipt of record payouts. And the financial assets of NFCs have risen dramatically, often primarily cash as firms are unwilling to risk any type of investment.

This hoarded store of capital is both the main impediment to recovery and the potential source of resolving the current phase of the crisis.

Four important graphics from the OBR

Four important graphics from the OBRBy Michael Burke

The latest publication from the Office for Budget Responsibility (OBR) is a strange document. It is a Forecast Evaluation Report which examines its series of completely wrong forecasts since it was established. Its firm assessment of these wildly over-optimistic forecasts is that it is not because it underestimated the impact of austerity, but then provides no other explanation for its consistent errors.

Despite this the OBR does provide some useful data on the economy and presents them in a very useful way. Below are a number of graphics taken from the latest publication.

Chart 2.1 (from the NIESR) shows the latest slump in historical context. The British economy is still 3.3% below its previous peak. In every other recession the lost output had been recovered after no more than 4 years. The current slump s already more than 5 years old.

Chart 2.23 shows how much further ‘fiscal tightening’ (combined spending cuts and tax increases) has been implemented and how much is still to come. The Fiscal Year 2012/2013 ended in April this year. By FY 2017/18 the fiscal tightening will be more than 3 times as great as the fiscal tightening already completed. If these plans are implemented, either by the Tories or by Labour, the next government will be implementing austerity measures twice as severe as anything seen to date.

The key problem for the whole economy remains one of contracting investment. In Table 2.1 the OBR shows that in the latest data business investment is the only component of GDP which has been negative. It also overwhelmingly accounts for the shortfall in growth relative to the OBR’s own forecast, 4% of total shortfall of 5.7%.

This is illustrated graphically the chart below, which highlights the components of growth relative to OBR forecasts. It is clear that business investment (blue) accounts for the bulk of the shortfall, with most of the remainder accounted by the shortfall in net trade (red). This is related to the fall in investment and the declining international competitiveness of the British economy.


What the OBR calls ‘Total Government’ has been the prop for the economy over the entire period compared to its own forecasts. But in reality there is no such thing as Total Government in terms of economic activity. The activity of Government, like every other economic agent can only either be consumption or investment.

SEB has previously shown that the government is increasing its consumption while cutting its investment. This is leading an economy-wide rise in consumption and an economy-wide decline investment.

Exceptionally weak growth caused the lack of business investment, a recent increase in government consumption combined with continued reductions in its own investment and the threat of much greater austerity to come; these are the prevailing trends in the British economy.

Osborne boosts consumption while cutting investment

Osborne boosts consumption while cutting investmentBy Michael Burke

In a recent piece for The Guardian the argument that government spending led the very weak recovery has been reviewed in the light of the publication of the final GDP data for the 2nd quarter of 2013.

Because of revisions to the data, it is no longer statistically correct that the entirety of the recovery is accounted for by government spending. The final release from the Office for National Statistics (ONS) shows that real government current spending began to rise after the 3rd quarter of 2011. By the 2nd quarter of this year government consumption had risen by £7.7bn. Over the same period real GDP has risen by £11.7bn. As a result, the rise in government consumption accounts for two-thirds of the weak recovery over the same period.

It remains the case that the rise in government day to day spending led the recovery. It began to rise in the 4th quarter of 2011 whereas GDP did not begin to rise until the 3rd quarter of 2012, that is 3 quarters following the rise in government consumption.

Therefore it remains the case that it was not austerity that led to the very weak recovery. Instead, rising government consumption led the recovery and statistically accounts for two-thirds of it. Changes in GDP and its components are shown in the chart below, from Q3 2011 when government consumption began to rise.
 

Chart 1

 
It is notable that household consumption is also rising and is the largest single contributor to growth over the period. Meanwhile, despite all official claims to the contrary investment continues to decline.

Since the recession began in 2008 the total decline in GDP has been £52bn and despite all talk of recovery the economy is still 3.3% below its prior peak. This is the worst performance in the G7 apart from Italy.

The decline in investment is much greater than the decline in GDP. Over the same period the decline in investment (Gross Fixed Capital Formation) has been £64bn, which more than accounts for the entire decline in GDP. The decline in investment also led the slump as a whole. GFCF peaked in the 3rd quarter of 2007 and over that period has fallen by £71.4bn. The fall in investment more than accounts for the recession and led it. Business investment alone (excluding investment by both government and private individuals) fell by £43.2bn over the same period. By itself the decline in business investment accounts for the bulk of the contraction in GDP of £52bn. This is the source of the economic crisis, and is shown in the chart below.
 

Chart 2

 
Even while the government has been increasing consumption expenditures it has continued to cut its own investment. Since the 3rd quarter of 2011 government investment has fallen by £1bn and since the Comprehensive Spending Review of 2010 it has fallen by £4.4bn.

This reproduces all the worst aspects of British long-term economic decline. Consumption is rising while investment is falling. No economic theory supports the idea of consumption-led growth. This is for the simple reason that if the productive capacity of the economy is not being increased simultaneously through investment, then all that is being consumed is that productive capacity.

Despite much fanfare the government has not added any investment at all during its time in office. Much of the large-scale investment currently taking place such as Crossrail was inherited from the previous government and difficult to cancel. Where it could cancel investment it did so, such as the building programme for schools.

The government is content to cut investment while increasing its own consumption and belies any notion the deficit-reduction or sustainable recovery are the goals of economic policy.

To invest in plant, machinery, equipment (including transport equipment and facilities) is to expand the means of production. Since the whole purpose of austerity is to drive up the profit rate of private capital, increasing state-led investment is ruled out. This would place an increasing proportion of the means of production into state hands and not in the hands of private capitalists. It is also why the government is willing to cajole, subsidise and even bribe firms to invest but unwilling to invest on its own account. The lack of success in this field is attributable to fact that those same firms do not yet judge profits to have recovered sufficiently to risk increasing investment.

Therefore there remain only two paths out of the current crisis. The current weak recovery is only supported by increasing government consumption and is not sustainable (although it may be the intention to continue this up to the next election). The private sector-led resolution of this crisis sought by the government requires an increase in the profit rate to be achieved by cutting wages, lengthening the working day and scrapping existing productive capacity. The alternative solution remains state-led investment with the government directing investment in key sectors of the economy, taking over a number of them where necessary.