August 2019

‘Boosterism’ and economics, or exposing the lies of Boris Johnson

By Tom O’Leary

All good jokes summarise or tell us something new about our society, or the times we live in, or about human nature. There is a very old, and very bad joke (repeated by Margaret Thatcher, among others) that, ‘The problem with socialism is that you run out of other people’s money’. It is a bad joke because it relies on a number of falsehoods.

There never has been a genuinely socialist government in Britain, and the largest and most famous economic crashes in this country have nearly all taken place under Tory or Tory-led governments. These were the depression of the 1930s and Churchill’s return to the gold standard, the Barber boom of the early 1970s, the Lawson boom of late 1980s and the imposition of austerity in 2010. The sole exception to this pattern was the crash under New Labour in 2008, which had adopted the Tory mantras of privatisations, PFI and bank deregulation.

Now, the new Prime Minister has adopted an economic policy he describes as ‘boosterism’. Boris Johnson as PM, or even as an architect of economic policy is itself a joke in poor taste. But the definition of boosterism under Johnson is simply promising anything in order to gain popularity.

This is important to grasp, as Johnson is not simply continuing Cameron/Osborne austerity. First, he has to get elected and is willing to scatter promises to achieve that.

Boris Johnson has form in this area. There is no garden bridge over the Thames, there is no ‘Boris Island’ airport, firefighter numbers were reduced and fire stations closed despite pledges to the contrary, and police cuts were only reversed when it threatened his re-election. The pledges were false, even where significant amounts of public money were spent.

Johnson’s current lies

Boris Johnson has effectively come to office after a coup against the previous Tory leadership. The electorate have not endorsed as Prime Minister, even indirectly, and pollsters have noted that his ‘bounce’ in the polls is far lower than Theresa May’s and is already fading – Labour is once again frequently marginally ahead in national opinion polls.

Under these circumstances, and leading a government which is supported by a bare majority that is the result of bribes to the DUP, Johnson does what comes naturally. He lies. He has promised:

  • £1.8 billion for the NHS. This is a tiny amount compared to what the NHS needs and it has emerged since that £1 billion is not new money, and the source of the remainder has yet to be identified
  • A total of £6.3 billion (£2.1 billion of which is new money) to prepare for No Deal Brexit, despite claiming it was a ‘million to one chance’ against happening
  • 20,000 extra police officers, which is nearly as many as the Tories have cut since 2010, but says nothing about the similar numbers of police community support officers, and police admin staff that have also been cut over the same period
  • More prison places and longer sentences, even though there are no new prisons and they would take years to build
  • Full-fibre broadband across the country by 2025 – but no plan to achieve it, not even in outline, and no suggestion of the resources it would require
  • To ‘level up’ per pupil funding in schools (which is aimed at Tory voters in the shires who complain about the greater funding for inner cities’ schools). The estimated cost for secondary schools alone is just £50 million per annum, a pittance compared the £4.6 to 5 billion needed simply to reverse Tory cuts to schools
  • A tax giveaway to the higher paid, raising the higher tax band threshold from £50,000 a year to £80,000 (which benefits someone earning close to £80,000 or more much more than the benefit to those just above £50,000). There is no indication of the cuts elsewhere, to fund this giveaway, or a justification for the higher borrowing it would entail.

Politically, his agenda is aimed squarely at his own base, ‘with law and order’ measures to the forefront. Random stop and search will certainly increase the number of black and Asian boys harassed by police, but will do virtually nothing to halt crime, as Home Office analysis shows.

Boosterism and economic fundamentals

This string of false promises, untrue claims and distortions are widely believed to be associated with a planned general election campaign around the time of the Tories’ central project of a No Deal Brexit. As No Deal itself and the likely plans of a hard right Tory Cabinet represent a double blow to living standards, this will be discussed below.

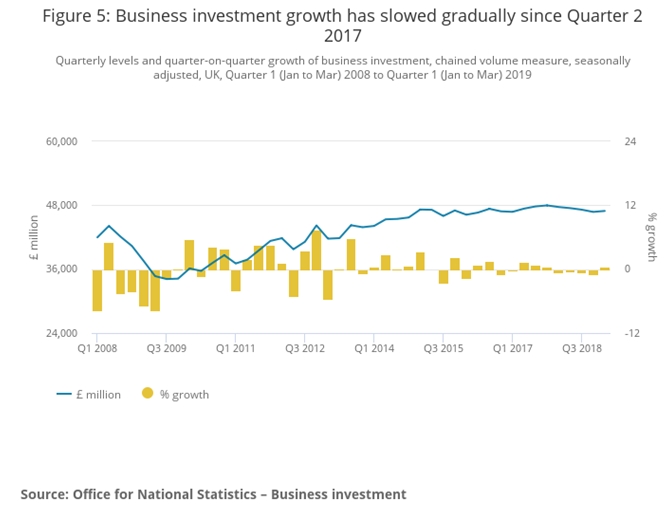
Yet, even before these two new blows to the economy and living standards, it is important to recall that the British economy is already in a crisis. The main source of this crisis is highlighted in Fig.1 below, reproduced from the Office for national Statistics (ONS). It shows that a weak recovery in business investment following the crisis of 2007 to 2008 has given way to outright stagnation and even decline. The economy has also begun to contract once more in the 2nd quarter of this year, in the recently-released preliminary data.

Chart 1. UK Business Investment

One way to illustrate how the weakness of business investment has been the main brake on growth and prosperity is by comparison. Fig.2 below shows that business investment has been far weaker than GDP growth since the beginning of the crisis. For illustration, business investment has also been far weaker than the growth in household consumption.

Chart 2. UK Real GDP, Household Consumption and Business Investment from Q4 2007 to Q1 2019

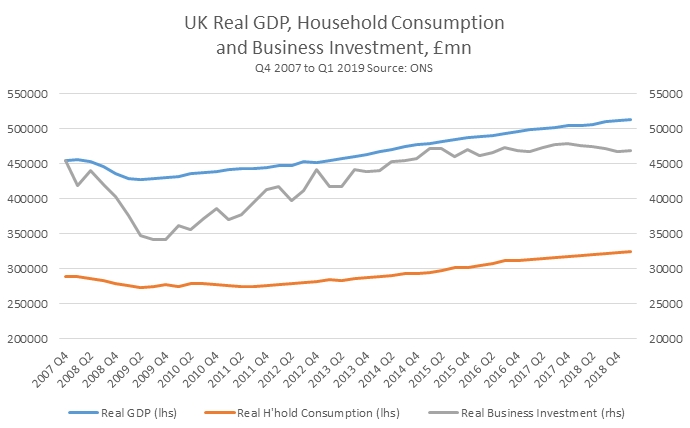
Since real Business Investment peaked in the 4th quarter of 2007 it has risen by just 3.25% to the 1st quarter of 2019. This is much weaker even than the growth in real GDP, which has risen cumulatively by 13% over the same period. In addition, it is often incorrectly asserted that the source of the crisis is the absence of ‘demand’, which is primarily Consumption. But real Household Consumption, which is the bulk of domestic demand has largely kept pace with the rise in GDP over the same period, increasing by 12.6%. In simple arithmetical terms, it is shown that the weakness of Business Investment is the main drag on UK growth.

But it is also possible to highlight this point in a more fundamental way. Consumption requires production – for most of us, even the apples we eat don’t just fall from the trees. They are commercially picked, processed, transported and sold by retailers. The main means of sustainably increasing that production is to add to the means of production through net investment, or to increase the number of hours worked.

Fig.3 below shows the growth rate in what the ONS calls the level of the capital stock (the means of production) over time, as well as changes in the net capital stock once the consumption of capital is taken into account. The consumption of capital is simply the capital that is used up in the production process, whether that is a rubber washer, a machine tool or a factory, which are each consumed or depreciated over different time periods.

Chart 3. Percentage change in growth rate of capital stock, net capital stock and capital consumption

The ONS summarises these trends as follows, “The UK’s net capital stock was estimated at £4.6 trillion at the end of 2017, increasing by 1.1% compared with 2016. Prior to the economic downturn, net capital stock increased on average by 2.0% per year, slowing to an average of 1.3% per year since 2010.”

Over the medium-term from 1997 onwards the annual growth rate of the capital stock has slowed from fractionally under 3% to just over 1%. As business is responsible for the bulk of the growth in the capital stock it is this prolonged deceleration in the growth of the means of production of the private sector that is the decisive factor in the medium-term slowdown and stagnation of the economy.

To raise the annual growth rate of the capital stock to 2% would require an additional £46 billion of fixed investment (which would itself need rise over time as this additional new capital itself depreciates).

Of course, set against this fundamental problem Boris Johnson’s ‘pledges’ of tax cuts for the rich and more spending on No Deal are simply another joke in poor taste. Failing to address this problem (unlike Labour, which promises to increase public investment) means that none of Boris Johnson’s pledges can possibly lead to economic growth or rising living standards over the medium-term. That is even without the damage from his central project, No Deal Brexit.

The threat of No Deal

A No Deal Brexit entails the severing of Britain’s close economic relationship with the EU, for the assumed benefits of a closer economic relationship with the US. But this is fool’s gold. In 2016, total UK trade with the EU (goods and services) amounted £554 billion, compared to £166 billion in total trade with the US (source, ONS).

There is no conceivable improvement in the trade relationship with the US that could even compensate for the likely fall in trade with the EU. At the same time, much of the country’s trade with other countries in the rest of the world is currently governed by trade agreements with the EU, and many of those are reluctant to offer the same terms to this country when it leaves.

More importantly, production in many sectors in the UK economy is closely linked through highly intricate supply chains to output in the EU. For many reasons, including geography these cannot be reproduced in supply chains connected with the US. Therefore any sector that has either tariff or non-tariff barriers will be faced with series of painful adjustments, including closure and relocation, with all the consequent loss of jobs.

There is too the obvious negative impact of the terms of any likely trade deal with Trump (and many of his possible successors). These range on everything from environmental standards to workers’ rights to food regulations and the accelerated privatisation of public services, including the NHS. In addition to China, Trump has already imposed tariffs and trade restrictions on neighbouring Mexico and Canada (effectively tearing up NAFTA), as well as India and the EU. This is in addition to the growing list of countries sanctioned for purely political reasons, such as Venezuela, Cuba, Iran, Syria and Russia.

But it is probably an error to assume that this government is even mildly uncomfortable with a US trade agreement that will increase fracking, sell off the NHS, reduce rights at work and allow US agri-business unregulated access to UK markets.

This is an ideologically hard right Tory Cabinet, many of whom, for example have explicitly advocated private health insurance or have financial links to it. Privatisations, fracking, ignoring the catastrophic risk of climate change and reducing workers’ rights can all contribute to an increase in labour exploitation and have the potential to boost profits.

For this government, and a small number of sectors, Trump’s demands can be seen as an opportunity, not a threat. The domestic beneficiaries of No Deal can include hedge funds and other speculative capital, private health insurers, private school owners and managers, frackers, sweatshop employers and landlords, as well as their apologists and PR agents.

For the overwhelming majority of the population a No Deal Brexit would have a very serious negative impact on living standards. It is also true of large sections of British capital. The fall in living standards has already been renewed with the fall in the pound leading to higher inflation and lowering real wages, as well as the job losses which have already begun simply from the threat of No Deal. No Deal will also reverse even the limited contribution to date of addressing the climate crisis.

Conclusion

Boris Johnson’s is a political campaign, where false promises are designed to win an election. They will do nothing to improve the economy or living standards for the vast majority.

Worse, his central project of a No Deal Brexit will deepen the economic crisis, by severing the closely inter-connected production supply chains within the EU. The replacement free trade deal with the US will only exacerbate the crisis and widen it to include policies which will add to the climate crisis, worsen public services and worker’s pay and conditions.

Labour already has the economic weapons to fight Johnson. Its fully-costed programme of measures to begin reversing austerity for the 2017 election amounts to £48.6 billion (pdf). This is massively greater than anything Johnson will ever promise, because it benefits workers and the poor the most. More importantly, as shown above, Johnson has nothing to say about raising the growth rate of the economy and living standards in a sustainable fashion. Labour does, with increased public investment and the National Investment Bank. It is also possible that Labour could build on its own successes of 2017, with additional funding for both, especially as interest rates are so low. But the defeat of No Deal is the next decisive step in Labour’s anti-austerity fight.

Why the US economy is slowing – how it will affect the trade war and China

By John Ross

The following article was written before the announcement of the latest US GDP figures, which showed the US economy slowing from an annualised 3.1% growth in the 1st quarter of 2019 to 2.1% in the 2nd quarter. This new data clearly confirms the analysis in the article. The Chinese version of this article originally appeared in Chinese in China Finance.

The Federal Reserve’s shift towards cutting interest rates

The US Federal Reserve’s sharp turn in summer 2019 towards cutting US interest rates immediately affects China and the global economy via numerous channels. But in addition to short-term effects, the reasons for the Federal Reserve’s policy change casts a clear light on the US economy’s medium- and long-term growth perspectives. Both aspects will affect China-US trade negotiations. This article therefore examines the fundamental growth trends in the US economy leading to the presidential election.

Why did the Federal Reserve make a sharp policy turn?

The Federal Reserve’s summer 2019 shift was an abrupt reversal of the Fed’s previous policy. During 2018 the Fed carried out four interest rate rises, clearly reflecting an estimation that the US economy had strong upward momentum and it was necessary to take prudent steps to head off overheating. Even as late as May 2019 Fed Chairman Powell said weak inflation was transitory – implying there was no reason to cut interest rates.

By June 2019, in contrast, the Federal Reserve press conference was universally interpreted as indicating the Fed would cut rates – the Fed funds futures market pricing in three quarter-point cuts in 2019, including 100% odds for a quarter-point cut this summer. A 0.25% rate cut was duly carried out at the July Fed meeting.

There are two interpretations of this radical policy change. The first is that it was a response to temporary non-fundamental trends in the US economy – short-term effects of the trade war, loss of momentum by US share markets etc. In that case the US economy may be anticipated to rapidly recover from such problems. The second interpretation is that the Fed was responding to much deeper trends slowing the US economy in 2019 – in which case the question becomes how deep is this slowing likely to be?

This difference overlaps with the fact that throughout the recent period two different perspectives for the US economy in 2019-20 have been put forward. The first, that of the Trump administration, argued that due to US tax cuts the US economy would accelerate in 2019. In March 2019, in its official budget forecasts, the administration projected 3.2% US GDP growth in 2019 and 3.1% in 2020 – both faster than 2018’s 2.9% and in line with President Trump’s claim that the US economy would grow at least 3% a year during his presidency.

The second perspective, held by the IMF, the present author, and others, was that the US economy would experience downward pressure in 2019. In that case, of course, the Fed’s policy shift was a response to deeper more powerful trends in the US economy.

Recent negative trends in the US economy

Recent US data is clearly in line with this second perspective. US total industrial production, including oil and gas, stalled after the end of 2018 – by May 2019 it was 0.9% below December 2018’s level. The decline in US manufacturing production, 1.5% in the same period, was sharper. In April 2019 US manufacturing production was 4.8% lower than its level more than 11 years previously in December 2007 – Trump’s policy to strongly revive US manufacturing production had failed.

Taking PMIs, the US Composite PMI was  51.5 in June 2019 – the second lowest since 2016. The US manufacturing PMI in the same month fell to its second lowest level since 2009 – 50.6… By the 1st quarter of 2019 the annualised growth of US fixed private investment had fallen from 9.9% when Trump was inaugurated to 1.5%.

President Trump demands the Fed cuts interest rates

These negative economic trends, in addition to direct effects, created strong political pressure on the Fed – President Trump launching a public campaign to force the Federal Reserve to cut US interest rates. The reasons for these attacks were clear. Opinion polls for Trump, leading to the official launching of his re-election campaign in June, were unfavourable. Leaks of his internal campaign polling showed the President had for several months been trailing Democrat Joe Biden. Recent polls showed President Trump trailing nine percent behind Democrat Bernie Sanders. Given negative poll ratings the prospects for the US economy in 2019-2020 were crucial for Trump’s re-election chances.

A recession in 2019?

Some major Western analysts believe that US economic slowing was so severe it indicated a US recession – two quarters of negative growth. For example, John Authers, Senior Bloomberg Editor for Markets, analysed under the self-explanatory headline ‘Markets Are Acting Like a Recession Is Unavoidable’:

‘would it be possible to explain what is going on in markets without making reference to the deteriorating U.S.-China trade relations? I am beginning to suspect that it would. Bond markets may be behaving as though they are bracing for something terrible to happen because traders are, indeed, scared that something terrible is going to happen.’

Quantitative analysis, however, indicates that any view the US economy will enter recession in 2019 is exaggerated. US growth in 2018 was 2.9%. Since the immediate aftermath of World War II, the largest deceleration in US GDP in one year compared to the previous one was 2.5% in 2009, under the impact of the international financial crisis.

However, in the 1st quarter of 2019 US GDP growth was 3.2%. For a recession to occur in 2019, between the 1stquarter and the 3rd quarter US GDP growth would have to fall from 3.2% to less than zero in only six months – a slowdown worse than during the greatest economic crisis for 80 years. Such a scale of economic deceleration is not indicated by domestic or international US economic imbalances.

Claims 2019 will see a US recession are therefore exaggerated, but there are clear reasons why the US economy will slow in 2019 and US growth will remain low in the medium/long term. This provides the background to Federal Reserve decisions.

Inaccurate claims by the Trump administration

To analyse accurately US economic dynamics, merely electoral propaganda claims by the Trump administration may be dismissed. Trump has claimed that ‘America’s economy is booming like never before’ but the reality is that under President Trump the US has experienced the slowest peak economic growth during any presidency since World War II. As demonstrating this casts a clear light on fundamental US economic trends, Table 1 shows peak growth under all US Presidents since World War II presented both in the way the US publicises economic growth, one quarter’s growth compared to the previous quarter presented at an annualised rate, and China’s method of comparing a quarter in one year with the same quarter in the previous year. Both show peak economic growth under Trump is lower than under every previous post-World War II US President. Taking 21st century presidents:

  • Using the US method of presenting data, peak growth under Trump of 4.2% was lower than 5.1% under Obama, George W Bush’s 7.0%, or Clinton’s 7.5%.
  • Calculated using real year on year growth, 3.2% peak growth under Trump was slower than 3.8% under Obama, 4.3% under George W Bush, and 5.3% under Clinton.

But peaks under 21st century presidents were much lower than under 20th century post-World War II US presidents. For example, peak growth under Nixon was 11.3% using the US method of presenting data. Peak post-World War II growth was under Truman at 16.7% using the US method of presenting data. Slow peak growth under Trump, of course, helps explain his relatively unfavourable position in opinion polls.

The slowing of the US economy

Turning to fundamental US economic trends, accurately analysing these requires distinguishing short-term business cycle fluctuations from medium/long term economic trends. The most accurate way to do this is to take a medium/long-term moving average of US growth – which eliminates effects of purely short-term fluctuations. Such measures show that taking either a 7, 10- or 20-year moving average gives the same fundamental result that long term US growth is slightly above 2% – a 7 year moving average shows annual average 2.3% GDP growth, a 10 year average shows 2.2%, and a 20 year average shows 2.1%.

Taking the longest-term moving average, 20 years, Figure 1 clearly shows that the fundamental trend of US economic growth in the last 50 years is significant deceleration. Annual average US growth fell from 4.4% in 1969, to 3.5% in 2002, to only 2.1% in 2019. In the last fifty years average annual US growth rate has fallen by more than half, explaining why US growth under Trump is the slowest under any US president since World War II but also showing that the deceleration under Trump is part of a longer-term US slowing.

This decelerating trend also demonstrates that 2.9% growth achieved by Trump in 2018, while slow by historical standards, was above current US annual average growth – with business cycle consequences analysed below.

Why is US slowdown occurring?

Given this long-term US economic slowdown, to understand US economic perspectives it is evidently crucial to analyse why this is occurring.

  • One explanation ascribes deceleration merely to specific contingent events – trade wars, European economic slowdown etc. If that is correct action by the US authorities, such as Federal Reserve interest rate cuts, may prevent any slowing and create strong US medium/long term growth.
  • The second explanation is that US economic slowing is due to deeper structural features. Indeed, that the US economy in 2018 grew faster than its medium/long term economic potential, and therefore the business cycle upturn in 2018 would be likely to be followed by a business cycle downturn. In that case, measures such as Federal Reserve interest rate cuts might sustain or increase US share prices, but they would be unlikely to halt downward pressures on US economic growth during 2019-2020.

To determine which perspective is correct, it is necessary to analyse the fundamental forces determining US economic dynamics.

Can Trump accelerate the US economy?

To ascertain the reasons for the US economic slowing Table 2 shows all major components of US GDP which are positively correlated with US economic growth during the last fifty years – i.e. factors which, if their structural weight in the US increased, would be expected to be accompanied by higher growth. This shows:

  • US government consumption has a positive but negligible correlation with US GDP growth – the highest correlation is 0.09.
  • US private inventory accumulation is strongly correlated with economic growth, but this merely reflects their strong correlation with the US business cycle. Private inventories are too small a percentage of US GDP to play a key role in US growth in anything other than the short term – in the 50 years 1968-2018 private inventory accumulation averaged only 0.4% of US GDP.

Leaving aside inventories, in the short term no component of US GDP has a strong correlation with US growth – i.e. in the short-term numerous factors affect US GDP growth with no single one playing a decisive role. Over a one to two-year period the highest correlation is only 0.26.

In the medium and long term, however, a very different picture emerges. There is a very high correlation between both US the percentage of net fixed investment (gross fixed investment minus depreciations) in GDP and net saving with GDP growth. Taking a 10-year period the correlation of the percentage of net fixed investment in US GDP with GDP growth is 0.69 – a very high correlation. Even taking a six-year period the correlation between net fixed investment and US GDP growth is 0.54.

Has Trump provided the basis for a serious US economic acceleration?

Data on the determinants of US growth, therefore, gives a clear picture:

  • Medium/long term US growth is primarily determined by net fixed investment. As Qing Yuan’s article in Quishi, ‘Several Issues That Need to be Further Clarified About Sino-US trade Frictions,’ noted regarding the US economy: ‘whether it will continue to prosper depends on the state of capital accumulation,’
  • In the short term no single factor is decisive in growth.

The standard caveat that correlation is not the same as causation is irrelevant in the present case – as the high correlation between US economic growth and net fixed investment means that it is impossible to substantially increase US economic growth over the medium/long term without increasing the rate of net fixed investment.

Therefore, data shows that only if President Trump could achieve a structural shift in the US economy to increase its level of net fixed investment could a substantial medium/long term US economic acceleration be achieved. But Figure 2 shows this has not occurred – US net fixed investment has fallen from 11.3% of GDP in 1966 to only 4.8% in 2019. This fall provides no basis for a medium/long term acceleration of the US economy – and this decline in net fixed investment explains the long-term deceleration of the US economy.

The state of the US business cycle

Turning from medium/long term developments to shorter-term perspectives for 2019-2020 the pattern of the US business cycle flowing from these fundamental trends is clear. Medium/long term growth, slightly over 2%, is determined by the US economy’s net fixed investment, with short-term business cycle fluctuations taking place above and below this long-term growth rate due to numerous factors. Figure 3 illustrates this short-term pattern of fluctuations. As shorter term fluctuations are simply oscillations around an average, when US growth is substantially above the average for any significant period it falls back towards the average, and when growth is substantially below the average for any significant period it then rises above the average – this process producing ‘reversion to the mean’.

Trump is experiencing a normal business cycle

These processes determine the short-term shifts in the US economy under Trump. To illustrate this Figure 4 shows year on year changes in US GDP under 21st century US presidents. This shows both the slower underlying growth of the US economy under Trump which was already analysed and fluctuations in the current business cycle. In the 2ndquarter of 2016, the US presidential election year, US growth fell to 1.3% – this extremely slow growth significantly contributing to Trump’s election victory. Such growth was far below the long-term US average – the 20-year moving average of annual average US GDP growth in 2016 was 2.4%. As 2016 was an extreme downturn of the US business cycle this was duly followed by a cyclical upturn in 2018. The increase in US growth in 2018 was not a fundamental growth acceleration but a normal cyclical upturn. It may indeed easily be verified that this upturn of the US business cycle under Trump was merely a normal business cycle one. US growth in the 2nd quarter of 2016 was 1.1% below its long-term average at that time. By the latest available data, for 1st quarter 2019, US long term growth had fallen to 2.1%. Merely to maintain a constant long-term average, therefore, a fluctuation upward of 1.1% would be expected. The 3.2% US growth in the first quarter of 2019, 1.1% above the US long term growth rate, is therefore exactly what would be expected for the peak of a normal business circle upturn – and did not represent an acceleration of medium/long term growth.

Trump’s response to economic downturn

That 3.2% year on year growth in the 1st quarter of 2019 indicates the normal expected peak growth in a US business cycle, however, has the conclusion that the beginning of a normal business cycle downturn would be expected – an undesirable development for president Trump given a presidential election in 16 months. The Trump administration will therefore do everything possible to attempt to delay this slowdown. Given that it rejects state intervention in the economy, and is already running a very large budget deficit, the only weapon available to attempt to limit an economic slowdown in the run up to the presidential election is interest rate reductions – hence President Trump’s public demand the Federal Reserve cut interest rates.

The IMF’s projections

It was shown it is unlikely there will be a US recession in 2019 but that, for business cycle reasons, the US economy will slow in 2019. Therefore, by how much will the US economy slow in 2019-2020?

A starting point may be taken as the IMF’s projections in Figure 5, which predict a fall in US growth from 2.9% in 2018 to 2.3% in 2019 and only 1.9% in 2020. This last figure is a whole percentage point below US growth in 2018 and would represent a major economic slowdown. However, this IMF projection looks slightly pessimistic for two reasons. First, it implies that US long term growth slows to only 2.0% by 2020 – there is no indication why this should occur given that US net fixed investment is low but not falling. Second it may be assumed that President Trump will do everything possible to prevent such a sharp slowdown in an election year. For these reasons it would appear reasonable to assume a slightly higher growth figure in 2019, say 2.5% – although the IMF figure is not unreasonable. Either trend, however, indicates that the Trump administration’s claims that US growth will accelerate are false. In summary, the Trump administration will be under downward economic pressure in the period leading to the Presidential election.

Conclusion

The conclusions are therefore clear.

  • The US economic upturn in 2018 was merely a normal business cycle and not any fundamental acceleration of the US economy. The long-term growth of the US economy continues to fall gradually.
  • As 2018 was merely a normal business cycle upturn it will be followed by a normal business cycle downturn – that is, while not facing a recession in 2019, the Trump administration will be under pressure of a slowing economy in 2019-2020.

The abrupt change in policy by the Federal Reserve in summer 2019 was, therefore, not a response to purely peripheral or short-term factors but was a response to deep seated processes slowing the US economy.

This article was previously published on Learning from China.