By John Ross
The new US GDP growth data released by the US last Friday entirely confirms the earlier analysis of ‘US growth under Trump is the slowest under any US President since World War II’ that:
· Peak US growth under Trump is the slowest under any US president since World War II.
· US growth during the present business cycle is the slowest in any business cycle since World War II.
Therefore, claims by the Trump administration of ‘historic’ fast US growth are simply a propaganda falsification – what is striking about present US growth is how slow it is by US historical standards.
To show the actual facts of US growth, taking the latest data and showing only US Presidents in the 21stcentury, Table 1and Figure 1show that, using the method by which the US prefers to present data, quarter on quarter growth at an annualised rate:
· Peak growth under Clinton was 7.5%
· Peak growth under George W Bush was 7.0%
· Peak growth under Obama was 5.1%
· Peak growth under Trump, in the second quarter of 2018, was 4.2%
The latest growth data under Trump, for the third quarter of 2018, shows a decline in the US growth rate to 3.5% – i.e. growth under Trump is already falling from its peak without having attained the levels under previous US presidents.
Detailed data on other US president’s since World War II, prior to the 21stcentury, is given in ‘US growth under Trump is the slowest under any US President since World War II’ and confirms peak US growth under Trump is the lowest under any US president since World War II.
An alternative method of presenting US data, in line with China’s and other countries method of presenting GDP growth, based on real annual average growth is given below – but as will be seen that makes no key difference to the result. The claim of historically rapid US GDP growth under Trump is therefore entirely fraudulent.
IMF data shows the exact opposite of Trump’s claims that US growth will accelerate under his presidency
However, while it is important to understand the latest quarter’s shifts in the US economy, even more important for successfully dealing with the Trump administration’s trade aggression against China, which is a threat to numerous countries, it is crucial to have an accurate understanding of the underlying dynamics of the US economy – as this both provides the objective context of the Trump administration’s actions and creates objective pressure on it. Such an analysis must:
· Understand the term long dynamics operating in the US economy which propel the Trump administration’s actions,
· Analyse the immediate situation within these trends which affect tactics in dealing with US trade aggression.
The earlier article‘US growth under Trump is the slowest under any US President since World War II’ demonstrated that because US growth under Trump is so slow by US historic standards, therefore within the ‘zero-sum game’ framework currently dominant within the Trump administration, this means that it cannot pursue competition with China via rapid US economic growth, but instead it can only attempt to slow China’s economy. This determines the aggressive approach of the Trump administration and explains its earlier rejection of proposals of ‘win-win’ solutions by China.
As will be seen the present article, within this long-term framework, examines the short-term situation of the US economy and therefore the pressures this creates on the Trump administration. As always in dealing with a serious matter in making such an analysis there is no virtue in ‘optimism’, and no virtue in ‘pessimism’, there is only a virtue in strict realism. Therefore, this analysis is not made using sources biased in favour of China but instead uses the data of the latest survey of the world economy by the IMF – a source which has in the past frequently overestimated US and Western economic growth. Analysis of this data shows in detail that the Trump administration has a temporary ‘window of opportunity’ during which it will benefit from a normal upturn of the US business cycle during the rest of 2018 and early 2019, before the US business cycle will begin to turn down and negative economic pressures will mount on the Trump administration. This means that in the US trade war, due to strong pressure this economic situation places on the Trump administration to go very rapidly, it is possible the latter’s short-term tactics will be aggressive. However, the negative pressures on the Trump administration will increase with time – that is in this struggle time is on China’s side.
The present analysis of the short term situation of the US economy in the business cycle shows the same pattern as the long term trends analysed in ‘US growth under Trump is the slowest under any US President since World War II’. That is, for propaganda purposes the Trump administration engages in falsification and distortion – of the type which led to President Trump being laughed at by international diplomats in his recent speech to the UN. This method was recently summarised by the US Nobel Prize for Economics winner Paul Krugman: ‘Do you remember political spin? Politicians used to deceive voters by describing their policies in misleading ways… But Republicans no longer bother with deceptive presentations of facts. Instead, they just flat-out lie.’. Faced with an administration which utilises such propaganda methods it is more than ever necessary to pursue the method of ‘seek truth from facts’ – and it is a duty of China’s media to present an accurate picture of the real situation of the US economy.
The latest IMF analysis of the world economy
The IMF’s new publication in October of its projections for the world economy is of particular importance as it covers almost the entire period up to the 2024 US presidential election – the period, therefore, not only of President Trump’s present term but of any possible second term. To be precise the IMF now makes projections from 2018-2023.
These projections are highly significant as although the IMF chooses not to make explicit comparisons of its projections for US growth to the claims of the Trump administration, for obvious reasons, the IMF’s data shows that it gives no credibility to the administration’s claims that it will produce a strategic acceleration in US growth. Indeed, the IMF’s projections, published to accompany its October World Economic Outlook, on the contrary project that the long term slowing of the US economy will continue to worsen under a Trump administration.
To give precise numbers, Trump projected that his presidency would lead to a strong acceleration in US GDP growth – stating, ‘I think you can go to 5 or 6 percent’. In stark contrast the IMF projects that average annual US growth until almost the end of even a second Trump presidency would be only 2.0% – less than half of the growth Trump claimed he would achieve. Furthermore, the long-term average US growth rate will continue to worsen – the 20-year moving average of US annual US growth is projected to drop from 2.4% in 2016, the last year before Trump became President, to only 1.9% by 2023.
It will be shown below that the facts of US economic performance under Trump are far more in in line with the IMF’s projections than those of the claims of the Trump administration – the latter have no factual basis. This article therefore systematically compares the projections of the IMF, and the facts of US economic growth, with the Trump administration’s claims.
Summary of US long term growth
Starting first with the facts of US economic growth under the Trump administration, as already noted the article ‘US growth under Trump is the slowest under any US President since World War II’ showed that far from peak growth under the Trump administration being fast, as it claims, it is slower than under any previous post-World War II US president. This is true whether this is measured by the way the US prefers to present data (a single quarter’s growth presented at an annualised rate) or the way China and other countries prefer to publish growth (actual year on year on year growth measured between the same quarters in two successive years). To briefly summarise data presented in detail in article ‘US growth under Trump is the slowest under any US President since World War II’!:
· Peak US growth under Trump (4.2%), calculated by the US method, was lower than under Obama (5.1%), George W Bush (7.0%), or Clinton (7.5%), let alone presidents such as Nixon (10.3%) or Truman (16.7%). Peak growth under Trump is the lowest for any of the 13 post-World War II presidents.
· Taking actual year on year growth, the maximum rate achieved under Trump is 3.0%. By this measure growth under Trump is also the slowest of any post-World War II US president – lower than under Obama (3.8%), George W Bush (4.3%), Clinton (5.3%), or, for example, Nixon (7.6%) or Truman (13.4%).
The precise present situation of the US economy will now be analysed within this long-term framework.
The long slowdown of the US economy
The slow US growth by historical standards under Trump is merely one part of the long deceleration of the US economy during the last half century – this long slowdown constituting one of the most fundamental features of the US economy. Taking a 20 year moving average, to remove any effects of short term business cycle fluctuations, Figure 2shows that annual average US growth fell from 4.4% in 1969, to 4.0% in 1978, to 3.3% in 2001, to 2.4% by 2016 – the last year before Trump became president.
In the context of this long-term US economic deceleration, the data in the latest IMF projection shows that long-term US growth will continue to decline further, to only 1.9%, by 2023 – i.e. the IMF is projecting that the US long term growth rate, far from accelerating under Trump, will actually fall further.
Projections for US per capita GDP growth
Even more striking in its consequences is the slowdown in US per capita GDP growth which flows from the IMF’s projections which is shown in Figure 3.
Because the US has relatively rapid population growth of 0.7% a year US per capita GDP growth is substantially below its total GDP growth. Figure 3 shows that US long term average annual per capita GDP growth fell from 2.8% in 1969 and 1978, to 2.4% in 2002 to only 1.5% in 2016. By 2023 US per capita GDP growth is projected to fall to only 1.1%.
Such a slowdown in US per capita GDP growth necessarily considerably impacts the domestic US situation – this is particularly the case as recent sharply increasing inequality means that for the majority of the US population living standards rises more slowly than per capita GDP. Whereas in the earlier post-war period more rapid US per capita GDP growth, and greater equality, could sustain US internal political stability, and widespread belief in the ‘American Dream’, the far slower per capita GDP growth of the recent period has necessarily been accompanied by increasing US domestic political tension – which is reflected clearly in the political and social clashes in numerous fields surrounding and following the election of the Trump administration.
US medium term growth
Turning to assess the objective ability of Trump to achieve his claims to lift the US economy to a fundamentally more rapid rate of economic development, with growth rates of 5% or 6%, it is worth first considering the situation facing his administration in light of long-term trends in the US economy.
As data and projections by the IMF are available for seven out of the eight years of a possible two term Trump presidency Figure 4 therefore shows the seven-year moving average of US annual economic growth. This, as with other measures, shows the US economy’s steadily slowing growth rate. On this measure, average annual US growth has fallen from 5.3% in 1968, to 4.4% in 1989, to 4.0% in 2000, to 2.2% in 2016 immediately before Trump came to office. To achieve growth rates of 5-6% over the period of a two-term presidency the Trump administration therefore would have to achieve rates of growth which have not been seen in the US economy for half a century – and in a situation where average US growth rates have been systematically falling for fifty years.
The IMF’s projections show absolutely no confidence in the Trump administration’s claims to be able to lift the fundamental US growth rate. On the contrary, Figure 4 shows that the IMF projects US annual average growth rates falling still further to 2.0% – compared to 2.2% in the last year before President Trump came to office.
 As two years of the Trump presidency are already passed it is also useful to consider the IMF’s projections for the next five years – Figure 5 shows this, together with historic data on average US annual average GDP growth over a five year period.
This data again shows the same declining trend of US growth rate as other measures. Taking a five-year moving average US annual economic growth fell from 5.9% in 1966, to 4.6% in 1987, to 4.3% in 2000, to 2.2% in 2016. The IMF projects US average annual growth will fall further, to 1.8% by 2023. Therefore, once again to achieve its claims, the Trump administration would have to achieve growth not seen by US economy for a half a century – the IMF clearly has no confidence in this and, on the contrary projects US economic growth falling further.
Trump and business cycle
Given the extreme divergence between the facts of US economic growth, and the projections of the IMF, compared to the claims of the Trump administration, why can the latter attempt to give any credibility whatever to what are clearly false claims? The answer is that the Trump administration attempts to put forward such false assertions by making claims regarding normal fluctuations in the US business cycle to disguise the real underlying trends in the US economy.
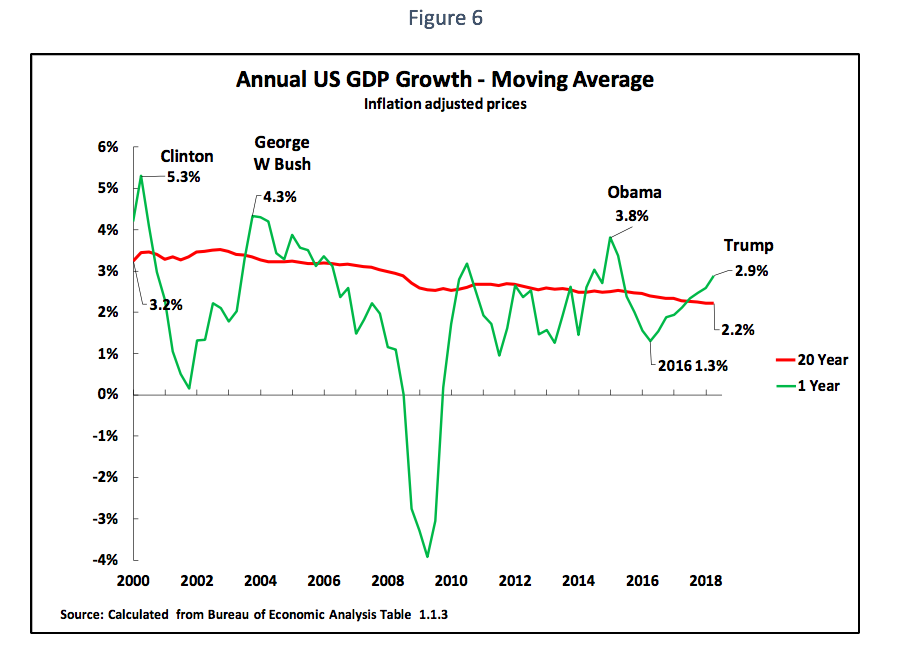
The means used by the Trump administration to attempt to conceal the real state of the US economy may be clearly seen by comparing trends in the US business cycle to US medium/long term economic growth. To demonstrate this Figure 6 therefore shows US year on year growth compared to a 20-year moving average of annual growth. This data confirms that factual trends in the US economy correspond to the analysis predicted by economic theory. That is:
· There are numerous short-term business cycle economic fluctuations determined by a wide range of fundamental and incidental economic factors (cycles in profitability and economic spare capacity, the situation in other countries, even the weather).
· But these are oscillations around a long-term growth trend determined by fundamental economic factors – that is the US economy’s growth is periodically oscillating above and below its medium/long term growth rate.
Therefore, to take simply the situation under 21stcentury US presidents, the explanation of the trends outlined earlier is shown clearly in Figure 6. During the 21stcentury the long-term annual average of US GDP growth has progressively fallen from 3.2% in 2000 to 2.2% in 2018. However, above and below this long-term average, which is determined by fundamental structural features of the US economy, there are numerous inevitable upward and downward business cycle fluctuations. This combination of long-term slowdown with cyclical fluctuations produced the declining peak year on year growth rates under US presidents already noted – 5.3% under Clinton, 4.3% under George W Bush, 3.8% under Obama, 3.0% under Trump. Such a combination of a falling underlying growth rate with cyclical oscillations therefore produces the trend of peak growth under each of these presidents being lower than the previous one.
The method of the Trump administration’s propaganda misrepresentation/fraud is to attempt to present purely normal upward short-term business cycle fluctuations as changes in the fundamental US growth rate. To be precise regarding the most recent period, as shown in Figure 6a downward oscillation in US economic growth in the second quarter of 2016 meant year on year GDP growth fell to an extremely low 1.3% – 0.9% below the 20 year moving average of US growth. Merely to maintain the 2.2% moving average of US growth it would therefore be necessary for US growth to rise to rise to approximately 0.9% above the 2.2% long term average – that is US growth could rise to approximately 3.1% without this indicating any fundamental acceleration of the US economy. Therefore, not merely is the 3.0% year on year growth rate under Trump in the third quarter of 2018 the lowest peak growth under any-US president since World War II but it is not even yet as fast as the approximately 3.1% growth in a quarter that would still indicate no acceleration in the US’s underlying growth rate – indeed growth under Trump could actually rise moderately further from its present level without this indicating any acceleration in medium/long term US growth.

The US business cycle
This fact that the present US growth rate under Trump, far from being exceptionally high, represents merely a normal upturn of the US business cycle of course has a corollary – that the US business cycle will turn down again. Figure 7 shows this is precisely the IMF’s projection. This calculates that after 2.9% growth in 2018 US growth will fall to 2.5% in 2019, and then 1.8% in 2020 and 1.4% by 2023.
It is, of course, possible to argue with some of the IMF’s detailed projections – for example the IMF’s projected decline of the US 20-year moving average annual growth to 1.9% by 2023, from 2.6% in 2016 before Trump assumed office, may be considered excessively steep and a 20-year growth rate of still slightly above 2% may appear more likely. Nevertheless, such details clearly do not alter the fundamental trend. There is no reason, either from previous trends in the US economy or from its fundamental structural trends, to believe there will be a fundamental upturn in US growth. All that has occurred under Trump is a normal upturn of the business cycle, which will therefore inevitably be followed by a downturn in the US business cycle.
Conclusions for US tactics in its trade aggression
To analyse implications for the US-China‘ trade war’, more accurately US trade aggression against China, IMF projections are fully in line with fundamental economic trends in the US economy – also providing an independent analysis of these. The IMF’s projections clearly totally refute claims by the Trump administration that it has created a fundamental acceleration in US growth and they instead give a clear perspective for the US economy during the period in which it is launching trade aggression against China. Taking individual years, they indicate:
· During the rest of 2018, due to the normal upswing of the business cycle, US growth should continue to be robust – which, of course, does not exclude disturbances in US financial markets.
· US growth during 2019 will be slowing compared to 2018 – with the implication that growth will be fast in the first half of 2019 and declining in the second half.
· By 2020 the US economy will be slowing significantly to only 1.8% growth – which implies per capita GDP growth of only just above 1%.
Taking this economic data in the context of the Trump administration’s trade aggression against China indicates that from a purely tactical viewpoint Trump has well timed the launching of his ‘trade war’ – and is attempting to gain from the purely normal upswing of the US business cycle. This means tactically for the Trump administration:
· Tariffs against China necessarily increase prices in the US, which puts downward pressure on US living standards, and tariffs and retaliation by other countries will lead to US job losses – as is now well documented by US media. However, the negative consequences of these effects for US living standards will be minimised by the upswing of the US business cycle – therefore allowing Trump to avoid some of the political unpopularity of tariff measures.
· The Trump administration’s tariffs have negative consequence for US companies – Ford, to take a single example, estimates that the tariffs will cost it a billion dollars. But the upswing of the business cycle while it continues will offset these negative effects.
· Given the upswing of the business cycle Trump hopes that US share prices will continue to increase – although, as share markets can anticipate economic trends, this is not certain.
· By misrepresenting the perfectly normal upswing of the US business cycle as an historic acceleration in the US economy the US hopes to be able to tempt other economies to enter into anti-China trade blocs with the US.
The problem for Trump, however, is that because what is occurring is a normal business cycle upswing, the cycle will inevitably turn down in 2019/20. This means that in this downswing of the business cycle:
· Tariffs will put upward pressure on US inflation – and therefore downward pressure on US living standards.
· The direct and indirect job losses from tariff increases will no longer be offset by rising employment created by an upswing of the business cycle.
· The downswing of the business cycle will put downward cyclical pressure on US share prices.
It is for this reason that the Trump administration has only a relatively short period during which the US business cycle will be aiding it. By 2019-2020 trends in the US business cycle will turn against the Trump administration. It is for this reason that the Trump administration is forced to attempt to go fast in its trade aggression against China – therefore time is against Trump, and in favour of China, in terms of trends in the US economy.
It is also for this reason that the Trump administration attempts to carry out systematic false propaganda presenting the purely normal upswing of the business cycle as a fundamental acceleration of the US economy. Given its short favourable window of opportunity it is necessary for the Trump administration to attempt to convey an image of the ‘historic’ growth of the US economy in order to bluff China into surrendering to US demands – therefore the US conceals that growth under Trump is the lowest under any post-World War II US president and that what is occurring at present is merely a normal upturn in what is the slowest business cycle since World War II.
Conclusions for China
In practical dealing with the US trade aggression there are numerous factors known only to those engaged in such discussions. Therefore, this article implies no position on any specific discussions with the US. There are also specifically domestic political factors in the US, such as the November mid-term US elections which are not analysed here. But evidently the fundamental economic situation in the US business cycle has a significant effect on the overall situation of US trade aggression against China. It is clear that:
· Analysis in China must estimate that at the present, due to the upswing of the business cycle, the US is at the peak of its favourable economic position in the trade war and the US economic position will weaken in 2019-20 as the US business cycle turns down.
· Due to this situation the Trump administration may adopt aggressive tactics in the short term so as to attempt to gain favourable results before its economic position weakens.
· It is of both international and domestic importance for China to show the falsity of US propaganda on its supposedly ‘historic’ growth so that – internationally as the US is attempting to lock other countries into trade pacts against China in part by claiming that the US economy is undergoing historically high growth.
For these purposes it is also crucial for China to have an accurate analysis of the state of the US economy. There is, in principle, little obstacle to achieving this. While extremely strong criticism may be made of the false propaganda claims of the Trump administration official US economic statistics are among the world’s most systematic. Similarly, IMF data and predictions are entirely public – which allows systematic comparison of IMF predictions with actual results. That is, the crucial data for analysing US economic trends is all public. Particularly in a time of US trade aggression it is therefore vital for China that its think tanks and research institutes carry out an accurate analysis of trends in the US economy.
* * *
This article was originally published in Chinese.
The above article was published first in English by New Cold War.


Recent Comments