With inflation rising unexpectedly in February (and at one of the fastest monthly rates since the beginning of the crisis) the question being increasingly asked is: are profits driving inflation? And the evidence increasingly suggests yes.
It’s certainly not wages. The IMF’s historical study of the relationship between wages and prices (79 periods of rising inflation, including Ireland’s experience in the 1970s) found almost no evidence of a wage-price spiral – an alleged phenomenon used to justify rising interest rates and wage ‘moderation’ (i.e. real wage cuts).
‘Wage-price spirals, at least defined as a sustained acceleration of prices and wages, are hard to find in the recent historical record . . .’
This is confirmed by Ireland’s recent experience. In 2022, inflation rose by 7.8 percent. Wages rose by 3.4 percent. No wage price spiral there. If anything, wages have had a disinflationary effect. But what about profits?
In the US, the Economic Policy Institute found that in the 18-month period between mid-2020 and the end of 2021, profits made up 54 percent of the increase in prices; wages made up only 8 percent.
In the UK, Unite the Union reported similar findings in the six-month period between October 2021 and March 2022: 59 percent of price rises due to increased profits; 8 percent for wages. The further found companies with increasing profits well above pre-covid levels.
The Australia Institute argued that the economy was experiencing a ‘price-profit spiral’ with wages contributing only 15 percent to higher prices.
The Financial Times recently looked at this phenomenon in an article headlined, ‘Unchecked corporate pricing power is a factor in US inflation,’ (behind a paywall). They published this graph on the front page. It shows after-tax profit margins in the US rising higher than at any time since 1945.
The ECB has acknowledged this phenomenon. Isabelle Schnabel, a member of the Executive Board of the European Central Bank, stated:
‘. . . on average, profits have recently been a key contributor to total domestic inflation, above their historical contribution . . . To put it more provocatively, many euro area firms, though by no means all, have gained from the recent surge in inflation . . . Poorer households are often hit particularly hard – not only do they suffer from historically high inflation reducing their real incomes, they also do not benefit from higher profits through stock holdings or other types of participation.’
And staying with the ECB, Reuters reported that at a recent retreat in Finland for the ECB’s Governing Board:
‘Data articulated in more than two dozen slides presented to the 26 policymakers showed that company profit margins have been increasing rather than shrinking, as might be expected when input costs rise so sharply . . . An ECB spokesperson declined to comment for this story.’
‘Some of the surprise stickiness in inflation was coming from goods inflation. This should have come down with the reopening of supply chains but has remained stubbornly elevated, a trend he (Philip Lane, ECB chief economist) associated with increased corporate profits. Yesterday his boss Christine Lagarde also raised the notion of companies profiteering on the back of inflation . . . ‘
Eurostat’s quarterly sector accounts gives us an aerial view of profits and wages in the non-financial sector. Focusing on our EU peer-group (other high-income countries) over the last two years up to the 3rd quarter in 2022 we find that:
Profits increased by 25.9 percent
Employee Compensation increased by 12.8 percent
Profits over this period increased at twice the pace as wages. We find a similar pattern if we go back over three years – starting in the pre-covid period of 2019.
What about Ireland? Irish profits data can be as unreliable as Irish GDP. It incorporates income that is produced in other jurisdictions but booked here to take advantage of our low tax.
These measure year-on-year averages. On average, profit margins made up over 60 percent of prices. It should be emphasised that this data relates to the domestically-owned sector – it doesn’t factor in multi-national profits.
However, it is certainly the case that the multi-national sector is more profitable than our domestic sector. And if we use corporate tax revenue as a proxy, we find that it has more than doubled between 2019 and 2022, implying that multi-national profits have more than doubled.
* * *
This price-profit spiral raises a number of questions for policy. If prices are not being driven by wage-fuelled demand, what is the point of ECB’s interest rate increases? The Reuters report went on to quote Paul Donovan, chief economist at UBS Global Wealth Management:
’It’s clear that profit expansion has played a larger role in the European inflation story in the last six months or so. The ECB has failed to justify what it’s doing [increasing interest rates] in the context of a more profit-focused inflation story.’
It is important to note that rising profits are not uniform across the board. We have less insight into the sectoral breakdown of profits than we have wages. The ECB’s Schnabel noted that it is larger, export-oriented firms that are benefitting the most with many smaller firm – in particular, in contact-intensive services (retail. Hospitality, transport, entertainment, etc.) – still struggling.
But there’s a more fundamental question: what is the point of profits? If profits are being direct into increasing dividends and senior executive pay, rather than its social utility (investment), then economies are suffering from a double whammy: profit-fuelled price increases and ECB interest rate increases.
Answering that question, however, calls for a far more radical review of how we run our economies. But the quicker we start that review, the quicker we can begin addressing a myriad of problems, including profit-fuelled inflation.
The above article was originally published here on Notes On The Front. Michael Taft is a researcher for SIPTU (Services, Industrial, Professional and Technical Union) in Ireland.
Hard up? Who is to blame? The economic consequences of the anti-union laws Online meeting 7pm Monday 27 March
Speakers: ● John Hendy KC, Campaign for Trade Union Freedom ● Diane Abbott MP ● Michael Burke, Socialist Economic Bulletin ● Alex Gordon, President of RMT Union
Chair: Sarah Woolley, General Secretary, Bakers’ Food & Allied Workers’ Union and Co-chair, Campaign for Trade Union Freedom
A joint event by the Campaign for Trade Union Freedom and Socialist Economic Bulletin. Details of this online event can be found on Eventbrite here.
About the Campaign for Trade Union Freedom The Campaign For Trade Union Freedom was established in 2013 following a merger of the Liaison Committee For The Defence Of Trade Unions and the United Campaign To Repeal The Anti Trade Union Laws. The CTUF is a campaigning organisation fighting to defend and enhance trade unionism, oppose all anti-union laws as well as promoting and defending collective bargaining across UK, Europe and the World.
Almost the only merit of the first Budget from Jeremy Hunt is the fact that it clarifies how austerity works. This austerity Budget, like all its predecessors, is not simply cuts, although these are numerous and deep. It is the transfer of incomes from poor to rich and from workers to business shareholders and executives. It is a conscious government policy; a class offensive.
So, a key reason why there was any money in the Budget is because of the renewed austerity offensive combined with very high inflation. Where Cameron and Osborne (and later May and Johnson) tried to force big cuts in spending, a combination of popular resistance and their own political weakness limited the effects to a degree. But the current inflationary wave magnifies the effects of austerity policies by cutting pubic spending in real terms.
Restraining public spending, including pay, while inflation is high puts a huge burden on both public services and public sector workers struggling with real pay cuts. But at the same time inflation raises government revenues such as income tax, self-assessment payments and VAT. It is that discrepancy -paid for by workers and all those who rely on public services, which allowed Hunt’s giveaways.
These giveaways amounted to £88.8 billion over the next 5 years, which is sizeable amount, about 0.75% of GDP each year. However, almost none of this will benefit ordinary households.
The big winners are companies. £29 billion is used in a revival of the failed idea that tax breaks will incentivise private sector investment. Polluters will also benefit through the fuel duty levy freeze (£15.1 bn), and the MoD will have an extra £11 bn to part-fund its adherence to US war policy against Russia and now China.
The sole vaguely progressive measure in the Budget is £18.1 billion to help with childcare costs. But this is over a 5-year period, which amounts to a cut-price, piecemeal and private sector set of measures that are much less effective than Sure Start, which the Tories have effectively abolished.
The aim is a purely political one, as the Tories are 33 points behind Labour among women (compared to 13 points among men). But even this has been botched for purely ideological reasons. Without new state provision and relying on private childminders means prices will be pushed higher as demand outstrips supply. Nurseries are actually forecast to close as a result.
The claim that consultants are leaving the NHS because they cannot top up their pensions is a blatant lie. It is a general benefit to the highest tax payers, so that they can shield their pay from income taxes. Pensions are also generally exempt from Inheritance Tax too. The class war aspects of this Budget are rather stark.
The Treasury documents show that the Tories will continue to squeeze public sector spending across the board – excluding Defence – and total public spending is projected to consistently fall as a percentage of GDP over each of the next 5 years.
Notably, they also intend further cuts in real pay in the public sector. There is a somewhat optimistic forecast of an average of 4.1% CPI inflation over the next year, especially as the starting-point could be close to the current 10%. But they have budgeted for just 3.5% for public sector workers’ pay in departmental spending, meaning another year of real pay cuts, bigger ones if inflation remains higher than forecast for longer.
They also specify that matching their forecast for inflation with pay rises would cost an extra measly £2bn (when they have just given away £88bn), but they refuse to do it. This indicates that they are aim for a permanent reduction in real terms pay, and are quite content to see further industrial disputes which they will make a key part of the next general election campaign.
The Tories have drawn a lesson from Cameron and Osborne years. It is not to give up on the policy of driving down the living standards of workers and the poor in the hope of boosting profits. Instead, it is to use inflation as a weapon in that fight, creating very deep cuts in public spending, and public sector pay.
This attack is what is funding the repeat of the failed policy to boost Investment by giving companies tax breaks. The British economy has an abysmal level of Investment – the lowest in the OECD as a percentage of GDP over 20 years. But the policy of tax incentives failed under Cameron and Osborne and there is no reason to believe this time will be different. Companies aim to make the level of Investment that is profitable. That does not tend to change at all with tax breaks – they are just pocketed, as Investment is driven by anticipated profits.
The £29bn could have been used for direct Public Investment. But cutting Investment is also a key part of the austerity policy. It is the counterpart to privatisation; the State ‘getting out of the way of the private sector’ in an effort to maximise the private sector’s profits.
It is notable that the reception to this Budget is much more hostile than previous similar packages, even from liberal circles. This owes almost everything to the breadth and militancy of the current strike wave. It is almost nothing to do with the Labour front bench, which has committed solely to reversing the changes to pensions and has failed to explain that it is a benefit for the 1%, while the entirety of the £88bn giveaway could have been used for pay, progressive redistribution and Investment.
However, that strike wave has created a new situation. The mass of the population feels they will be worse off. There is too a growing awareness that this is an orchestrated attack on living standards. The strike wave itself shows that there is not only an understanding that the government is responsible for the attack, but the working class is engaged in a counter-offensive of its own.
We are currently facing the most prolonged economic crisis in recent history, the most vicious attacks by a government determined to decimate living standards and clamp down even further on trade unions, and the biggest trade union resistance to that for decades. Naturally, each of these three is related.
The government has shown itself to be both intransigent and preparing for the long haul with renewed anti-union legislation. The labour movement is responding in kind and will need to be equally resolute and strategic.
There is no accident about the timing. Tories have long cherished the idea that there should be even greater curbs on trade union activity. But now we are in the middle of a huge strike wave and a prolonged economic crisis.
The anti-union laws already in place in this country are some of the most draconian in any advanced industrialised country. Research from ITUC, the international TUC, shows that this country is among the worst offenders in Europe when it comes to violating trade union rights.
The new additional minimum service level agreements to be imposed across large parts of the public sector are intended to ratchet these up. Notably, the legislation is not designed to have any impact on current disputes. The government clearly intends future fights.
The backdrop is that the British economy is experiencing a “stagflation” crisis, the combination of a stagnating economy and surging prices. In the most recent monthly data, the economy registered zero growth from a year ago, while consumer price inflation remains painfully high at over 10 per cent.
Worse, the current economic crisis is an extension of much longer trends, with no end in sight. Inflation will probably subside to some extent at some point but prices will not fall back. At the same time, British government subsidies and handouts to firms while cutting public spending and investment in real terms are a recipe for prolonged stagnation.
In response to the crisis, the government is trying to shift the burden of it onto the shoulders of workers and the poor. It has been intransigent on pay, interfered to block negotiations, in many cases refused to talk and is clamping down on trade union rights.
It has focused on the sectors the government directly or indirectly controls. It hopes that this will set a “going rate” across the economy well below inflation, for both the private and public sectors.
With this, the government hopes to both lower real wages across the board and keep them there by limiting the effectiveness of trade unions.
While the government is seeking longer-term solutions to the economic mess, so too the labour movement and its allies should examine alternative longer-term strategies, to keep the burden where it belongs, with big corporations, banks and landlords.
To some extent, this is a repetition of history. The inspiration for the current Tory policy stretches back to Margaret Thatcher. Then, as now, there was a string of legislation curbing the rights of workers to form unions or the rights of unions to organise their members for industrial action.
Thatcherism was also a response both to an economic crisis and a wave of trade union militancy which had resisted efforts to impose “pay restraint” which were designed to lower wages in real terms (after inflation).
Thatcherite ideologues claiming success for those policies ignore two key facts. The first is that Thatcherism benefitted from an extraordinary windfall of North Sea oil revenues that amounted to approximately 15 per cent of GDP during her time in office.
Secondly, taken as a whole, the three decades of Thatcherism and its legacy produced significantly lower growth than the three decades that preceded it. In the post-World War II period before Thatcherism, the British economy’s growth rate was about 3 per cent on average. Post-Thatcher it was less than two-thirds of that and has since slipped to below 1 per cent under austerity.
Yet the government is now doubling down on a policy which has failed.
The policy amounts to transferring incomes and wealth from poor to rich and from workers to big business. But the recent experience of the British economy is that this falling labour share of national income has also been accompanied by a private-sector investment strike.
The private sector does not feel compelled to invest if it is able simply to squeeze workers harder.
This is common across the G7 economies. But Britain is the worst example. The British economy lags behind even comparable countries which themselves have experienced a declining rate of investment.
According to the Organisation for Economic Co-operation and Development (OECD) from 1997 and 2017, the proportion of GDP directed towards fixed investment in Britain was the lowest in the OECD as a whole, at 16.7 per cent of GDP. The next lowest are Italy and Greece, both at 19.6 per cent of GDP.
This is a private-sector failure to invest in the means of production. It leads directly to an inability to increase production in any significant way. This in turn has produced economic stagnation.
It would be very difficult for any government to raise living standards and improve public services in these circumstances. But austerity deepens the crisis for the mass of the population while public services are in crisis. Take-home pay and welfare benefits have both been cut in real terms.
This chronic private-sector failure has now become acute. Therefore, the state must take the lead role in reviving the economy through investment while sharing incomes more equitably through redistribution.
The state has no compulsion to distribute returns to shareholders. It can raise its own level of investment and deliver the same effects as falsely promised on behalf of the private sector.
It can also borrow for investment as the private sector does, or should.
But public investment must also be restored. It has amounted to only 1 per cent of GDP for most of the last decade, compared to up to 5 per cent of GDP in the pre-Thatcherism period of much stronger growth.
A bold public investment programme would be a truly green and just transition in energy, transport and housing, with taxes on the banks and big firms to pay for the restoration of public services, a massive increase in publicly owned housing, and renationalised public services.
A key part of the revival of public services must be inflation-plus pay rises to recruit and retain workers. This should also apply to those sectors the government effectively controls, but where the private sector rakes off subsidised profits, such as rail, post and telecommunications.
In addition, existing and planned anti-union legislation should be scrapped, to allow organised workers to bargain collectively for decent settlements.
The government should also outlaw zero-hours contracts and other casualisation measures, and offer those on the minimum wage and benefits something like the pensioners’ triple-lock.
The fight-back against the government has begun and it is determined to block it. Everyone with an interest in opposing austerity and cuts to living standards should also oppose government anti-union legislation.
The Campaign for Trade Union Freedom and Socialist Economic Bulletin have jointly organised a meeting to develop the links between the anti-austerity struggle and the fight for union rights. Join us online on Monday March 27 at 7pm to find out more.
The collapse in rapid succession of Silicon Valley Bank and Signature Bank, the second and third largest bank collapses in U.S. history, fully confirms the extremely damaging character of the U.S. stimulus policies which were launched to attempt to deal with the economic consequences of the Covid pandemic. Indeed, the path from the errors of these stimulus packages to the collapse of the two U.S. banks is a particularly direct one. This therefore reinforces the importance of all circles in China understanding the errors of these policies – this is necessary as, unfortunately, some sections of the media in China have supported the type of erroneous stimulus packages launched in the U.S. and suggested that China should copy them.
A long analysis of the errors of these U.S. stimulus packages was already given in my article “Key lessons from the failure of the U.S. and success of China’s economic stimulus programs” so all the details included there will not be repeated here. This article will just deal with the links between the specific collapse of the U.S. banks and these errors in U.S. economic policy. It will also explain an apparent paradox. Why did these two banks collapse due to their involvement with what are generally regarded as the safest of all financial assets, U.S. Treasury bonds, and one of the riskiest of all financial instruments – crypto currencies?
U.S. propaganda compared to U.S. economic reality
In its recent political propaganda the U.S. has been claiming that its economy was doing well and the stimulus packages it launched during Covid were a big success. President Biden had done press conferences to make such claims. But anyone following money, and not words, knew this was not true. In addition to underlying negative structural trends in the U.S. economy financial markets were also sending out extremely clear signals of economic problems.
The most important of these was what might appear a very technical issue but is in fact deeply significant – so much so that it is well worth non-economists understanding it for reasons that can be explained in a short way. Readers will rapidly find out why this apparently technical issue in fact has extremely strong practical consequences. This issue is the inversion of the U.S. yield curve – that is, the creation of a situation where the interest rates on US long term bonds are lower than short term ones. As shown in Figure 1 this is an extremely rare event, it has only occurred four times in the last forty years, and is one of the clearest and most reliable indicators of serious problems in the U.S. economy.
Figure 1 shows over the long run the relation between U.S. long term, 10 year, and short term, two year, bond interest rates – that is, how much the two interest rates differ. As can be seen almost always U.S. long term interest rates are higher than short term ones. This is logical because the risk of lending money over a long period is greater than over a short period – so a greater reward, a higher interest rate, has to be paid to get someone to lend money for a longer period. But, as can be seen, on four occasions this normal relation has changed and short-term interest rates became higher than long term ones. On each of the three previous occasions this event, the inversion of the yield curve, was followed by very serious problems in the U.S. economy.
When the yield curve inverted in 1989 this was followed by recession in 1990.
When the yield curve inverted in 2000 this was accompanied by the severe dot com share price collapse and a sharp slowdown in the U.S. economy.
The inversion of the yield curve in 2006 was followed by the collapse of the U.S. sub-prime mortgage market, the 2008 financial crisis, and a severe U.S. economic recession.
What is notable is therefore not only the rareness of this indicator of yield curve inversion but also its reliability – that is, there are no occasions on which the yield curve inverted and this was not followed by a major crisis. It is because it is such a reliable indicator, and because it has always been followed by such severe economic consequences, that it is worth even non-economists paying great attention to this issue.
Therefore, when in July 2022 the U.S. yield curve inverted, this was a very clear signal that serious problems were developing in the U.S. economy. Furthermore, this inversion continued to worsen until it reached a peak of -1.09% on 8 March 2023. This was clearly indicating a serious problem and therefore that all the claims in words that everything in the U.S. economy was doing well were false.
Figure 1
From yield curve inversion to the U.S. banking crisis
The mechanisms that drove this inversion of the yield curve led directly to crises in both the Treasury bond market and in crypto currencies – and through them to the bank collapses.
As was analysed in detail in “Key lessons from the failure of the U.S. and success of China’s economic stimulus programs” in order to attempt to deal with the economic consequences of the Covid pandemic the U.S. launched large purely consumer focussed stimulus programmes. As, by definition, consumption is not an input into production this meant that an enormous boost was being given to the demand side of the U.S. economy, but no direct increase was being given to the economy’s supply side. The result of a huge increase in demand and no increase in supply was inevitable – rapid inflation.
To summarise the trends, which are analysed in detail in the earlier article.
In order to create the consumer stimulus the U.S. government increased its borrowing by an extraordinary 26% of GDP in a single year. Almost all this money was used to stimulate consumption, that is demand, and very little to increase investment, that is supply as well as demand.
Simultaneously the U.S. broad money supply was increased by 26% in a year.
The result was that between the 4th quarter of 2019, that is immediately before the pandemic, to the 4th quarter of 2022, that is the latest available data, U.S. consumption rose by a large $3,769 billion, but U.S. net investment, that is taking into account depreciation, fell by $93 billion. This produced the sharp increase in demand (consumption) with no increase in supply (investment).
As a result, U.S. inflation began to rise rapidly – increasing from 0.1% in May 2020 to 7.5% in January 2022. This timeline showed clearly that inflation was being created by U.S. economic policy and not by the Ukraine war – as that war did not break out until February 2022. U.S. Inflation then reached a peak of 9.1% in June 2022.
Raising interest rates
To attempt to control this inflationary wave the U.S. Federal Reserve then began to rapidly raise interest rates. These interest rate rises were the mechanism that led to the simultaneous crisis in the Treasury Bond markets and that for crypto-currencies – these in turn creating the bank collapses.
As Figure 2 shows, to attempt to control the inflationary wave created by U.S. economic policy, the Federal Reserve began to rapidly raise its interest rate. This increased from 0.25% in February 2022 to 4.75% in February 2023 – a rise of 4.5% in only one year.
Figure 2
With the massive issuing of Treasury Bonds to finance the huge U.S. government borrowing mentioned above, the price of U.S. Treasury bonds began to fall due to a huge increase in their supply. But the interest rate on a bond moves in exactly the opposite direction to its price – that is, as the price of U.S. Treasury bonds fell the interest rate paid on them rose. First, the interest rate on 10 year US Treasury yields began to rise – it had reached its lowest recent point at 0.5% in March 2020. Then the interest rate on two-year Treasury bonds began to rise rapidly, and this was then strongly propelled by the Federal Reserve raising its own interest rate – two-year Treasury Bond yields had reached their lowest recent point at 0.11% in February 2021. In July 2022, as already noted, two year interest rates rose above 10 year interest rates, inverting the yield curve. By 8 March 2023 the interest rate on a 10 year U.S. Treasury bond had risen from 0.5% to 3.98%, and the interest rate on a two year bond from 0.11% t0 5.09% – creating the 1.09% inversion of the yield curve.
Figure 3
The road to the bank collapses
These rises in interest rates then led directly to the bank collapses via two routes.
First, the sharp rise in interest rates on Treasury Bonds, and related financial instruments such as Municipal Bonds, was caused by their fall in price. Such bonds were held by banks as their “safest” assets. But this meant that the safest assets of these banks were falling sharply in value. As a result, if a bank had a large holding of such “safe” bonds its assets could became less than its liabilities – causing the bank to collapse. This was the chief reason for the collapse of SVB. SVB’s market value fell from $6 billion dollars to zero in a week.
Signature Bank was hit by another route – not through exposure to a “safe” asset but to one of the riskiest, that is crypto-currencies. Signature Bank, since 2018, was one of the few banks that accepted deposits of crypto assets. But crypto assets are subject to huge price fluctuations because they are not backed by physical assets – unlike, for example, gold. Rising interest rates already put the price of crypto assets under downward pressure and then they suffered a further deep crisis with the collapse of the FTX crypto exchange, which is at present the subject of a police investigation.
The rising interest rates, which were necessary because of the soaring inflation unleashed by the U.S. stimulus policies, therefore created a crisis in both “safe” and “risky” assets – bringing about the bank collapses.
Consequences for the U.S.
What, therefore, are the consequences and lessons of this latest U.S. financial crisis?
First, of course, it demolishes the propaganda claim by Biden and others that the U.S. economy and financial system was in excellent shape. Those who analysed that the U.S. stimulus packages were destabilising have definitely been proved correct.
Second, claims that since the 2008 financial crisis the stability of the U.S. financial system has been established have been proved to be false. Once again, a financial crisis has been ignited in the core of the U.S. financial system.
Third, while an economy cannot function without Treasury bonds it can perfectly well function without destabilising crypto-currencies and these should be eliminated.
Fourth, it is too early to say just how serious the damage will be to the U.S. financial system. But the collapse of a bank like SVB with over $200 billion in assets, the second largest bank collapse in U.S. history after the 2008 fall of Washington Mutual Bank with $307 billion in assets, is obviously a major financial event. Some of the direct effects can be controlled by U.S. Federal intervention at a cost – deposits at the banks will be guaranteed. The direct knock-on consequences are still not clear – at the time of writing share prices in a series of other U.S. banks were falling sharply.
But even if the direct consequences are dealt with there will also be indirect effects which are much harder to control. In particular the U.S. Federal Reserve will need to consider if its monetary tightening will create instability in the financial system. This is the reason that Goldman Sachs, for example, has speculated that the Federal Reserve will not raise interest rates as expected at its next meeting. Although Goldman Sachs may well be wrong on this specific issue, nevertheless undoubtedly the Federal Reserve will have to act with greater caution – which means that a lower priority will have to be given to raising interest rates, and other measures, to control inflation. And inflation, of course, is one of the most destabilising of all economic processes.
Lessons for China
Finally, there are clear lessons for China. The warnings about the dangers of the type of U.S. stimulus policies made by the present author and others have been entirely confirmed by events. But these damaging policies in the U.S. were rationalised by fundamental errors in economic theory – errors which are unfortunately repeated in sections of China’s media.
The most fundamental of these concerns the role of consumption in the economy – the erroneous idea that consumption is an input into production and can therefore be a contribution to GDP growth. This is false. Consumption, by definition, is not an input into production. Therefore, consumption is only part of the economy’s demand side, it is not part of the economy’s supply side. Investment, in contrast, is not only part of the economy’s demand side it is part of the economy’s supply side.
Statements such as “consumption contributed 75% to GDP growth”, or “consumption contributed 75% to GDP growth and investment 25%” are simply confused and false. The contribution of consumption to production, that is to the economy’s supply side, and therefore to GDP growth, is always precisely zero. The statement that “75% of GDP was consumed and 25% was invested” is correct but the statement “consumption contributed 75% to GDP growth and investment 25%” is false – none of the production was created by consumption. For clarity of thinking statements such as ““consumption contributed 75% to GDP growth” should simply be stopped being made as they create confusion. These issues are all dealt with in more detail in my previous article.
In the U.S. this false concept that consumption was a contribution to GDP growth was used to rationalise and justify a stimulus programme that was entirely based on increasing consumption and did nothing for investment. That is, there was a basic confusion regarding the difference between the demand side of the economy, of which consumption is a part, and the supply, that is the production, side of the economy. The policies resulting from this confusion in turn unleashed an inflationary wave which destabilised the economy and led to the bank collapses.
I know some readers may think that the present author has spent time dealing with what might seem abstract questions of economy theory in articles. But as the bank collapses demonstrate these theoretical issues have extremely powerful and practical consequences. Marxism explains this real situation of the economy extremely clearly. As Marx noted it is production, not consumption or exchange, which is dominant: ‘The result at which we arrive is, not that production, distribution, exchange and consumption are identical, but that they are all elements of a totality, differences within a unity. Production is the dominant moment, both with regard to itself in the contradictory determination of production and with regard to the other moments. The process always starts afresh with production… exchange and consumption cannot be the dominant moments… A definite [mode of] production thus determines a definite [mode of] consumption, distribution, exchange.’[1]
The confusions of “Western”, in fact marginalist, economics in contrast allows the real situation to be obscured leading to such damaging results as the U.S. stimulus packages. To avoid such damaging consequences it is therefore crucial that such confusions do not circulate in China. Keeping the theoretical cupboard in good order is not an abstract but an extremely crucial practical issue – as the damage of the U.S. bank collapses graphically demonstrates.
—
[1] Economic Manuscripts of 1857-58 (Vol. Collected Works 28). London: Lawrence and Wishart p36.
Hard up? Who is to blame? The economic consequences of the anti-union laws Online meeting 7pm Monday 27 March
Speakers: ● John Hendy KC, Campaign for Trade Union Freedom ● Diane Abbott MP ● Michael Burke, Socialist Economic Bulletin ● Alex Gordon, President of RMT Union
Chair: Sarah Woolley, General Secretary, Bakers’ Food & Allied Workers’ Union and Co-chair, Campaign for Trade Union Freedom
A joint event by the Campaign for Trade Union Freedom and Socialist Economic Bulletin. Details of this online event can be found on Eventbrite here.
About the Campaign for Trade Union Freedom The Campaign For Trade Union Freedom was established in 2013 following a merger of the Liaison Committee For The Defence Of Trade Unions and the United Campaign To Repeal The Anti Trade Union Laws. The CTUF is a campaigning organisation fighting to defend and enhance trade unionism, oppose all anti-union laws as well as promoting and defending collective bargaining across UK, Europe and the World.
The government is attempting to push through new anti-trade union legislation that could severely limit the right to strike. It is doing this amid the biggest strike wave in this country for a generation.
The backdrop is that the British economy is in a depression. The current economic crisis is the culmination of a prolonged period of low growth and stagnation.
In response to this, the government is attempting two major strategies at once. The first is the attack on pay, focused on the sectors it directly or indirectly controls. The second attack is on the right of workers and their unions to respond to these and future offensives by curbing their right to strike, or to limit the effectiveness of those strikes.
With this double-whammy the government hopes to both lower real wages across the board and to keep them there by limiting the effectiveness of trade unions. It is an attempt to make workers and the poor pay for their crisis. There is also a concerted effort to redirect government revenues, including money raised in taxation away from public services and the poor towards big business and the rich.
Naturally, those in the direct firing line and beyond reject these impositions. More importantly, millions of workers have now taken some form of action against them. On February 1st alone, there were over half a million workers on strike across different sectors. The breadth of the strikes and active support being given means that those involved in these battles goes beyond those on stike and includes the other members of strikers’ households, solidarity activists, and public supporters (such as parents/carers, students, patients and their families, commuters, and so on) who continue to support the strikers.
As the strike wave develops it is natural to seek alternative solutions to the crisis. Instead of workers and the poor shouldering the burden, the policies required should aim for those who caused the crisis to be forced to pay. And, while the government is seeking longer-term solutions to the economic mess, so the working clsas and its allies should examine alternative longer-term strategies, to keep the burden where it belongs, with big corporations, the banks and landlords.
Why now?
This Tory government is not the first to impose legislation curbing the rights of workers to form unions, or the rights of unions to organise their members for industrial action. Between 1980 and 1993 the Tory government passed six anti-major union laws, which all remain in place.
Then, as now this Thatcherite policy was a response both to an economic crisis and a wave of trade union militancy which had resisted efforts to impose ‘pay restraints’ which were designed to lower wages in real terms (after inflation).
When the Tory-led Coalition imposed austerity from 2010 it was a direct and conscious emulation of the Thatcher period.
Thatcherite ideologues argue that Thatcherism was successful in reviving the British economy with an agenda of anti-union laws, crushing the miners’ union, large scale privatisations and deregulation, including the City of London. But they completely ignore two key facts:
Thatcherism benefitted from an extraordinary windfall of North Sea oil revenues that amounted to approximately 15% of GDP during her time in office.
Taken as a whole, the three decades of Thatcherism and its legacy actually produced significantly lower growth than the three decades that preceded it.
This is shown in the three periods below, identifying the post-World War II period, Thatcherism and its legacy and the period since the Global Financial Crisis in 2007 and 2008.
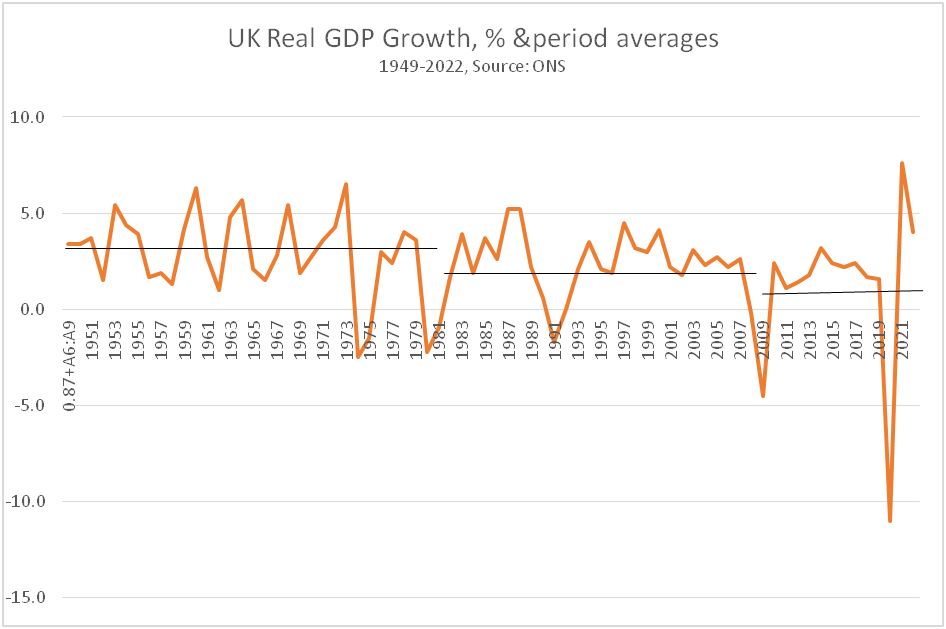
Chart 1. UK Real GDP Growth before Thatcher, under Thatcherism, and since the Global Financial Crisis, %
Source: ONS, author’s calculations
In the 31 years from 1949 to 1979 inclusive, the British economy grew by an annual average 3%. In the 31 years to 2009 real GDP grew by 1.9% annually. In the period since 2009 it has grown by just 0.9% annually on the same basis (as shown in the chart above). Therefore, it is no surprise that repeating Thatcherite policies from 2010 onwards has been a costly and hugely damaging failure.
Having imposed these failed policies from 2010 onwards, the current government is doubling down on the same policies now. The additional factor is a renewed Thatcher-style attack on unions, the right to assemble and the right to strike. The new Minimum Service Levels being imposed are explicitly designed to render strike action in key parts of the public sector almost completely ineffective.
The austerity offensive and the anti-union laws are part of the same package.
Economic explanation of the crisis
As Socialist Economic Bulletin (SEB) has shown previously, there are many facets to this grim economic performance, including the direct effects of the main Thatcherite policies listed above. But in terms of the components of GDP the driving force behind this long-term slowdown is the decline in Investment (referred to as Gross Fixed Capital Formation (GFCF) in the national accounts.).
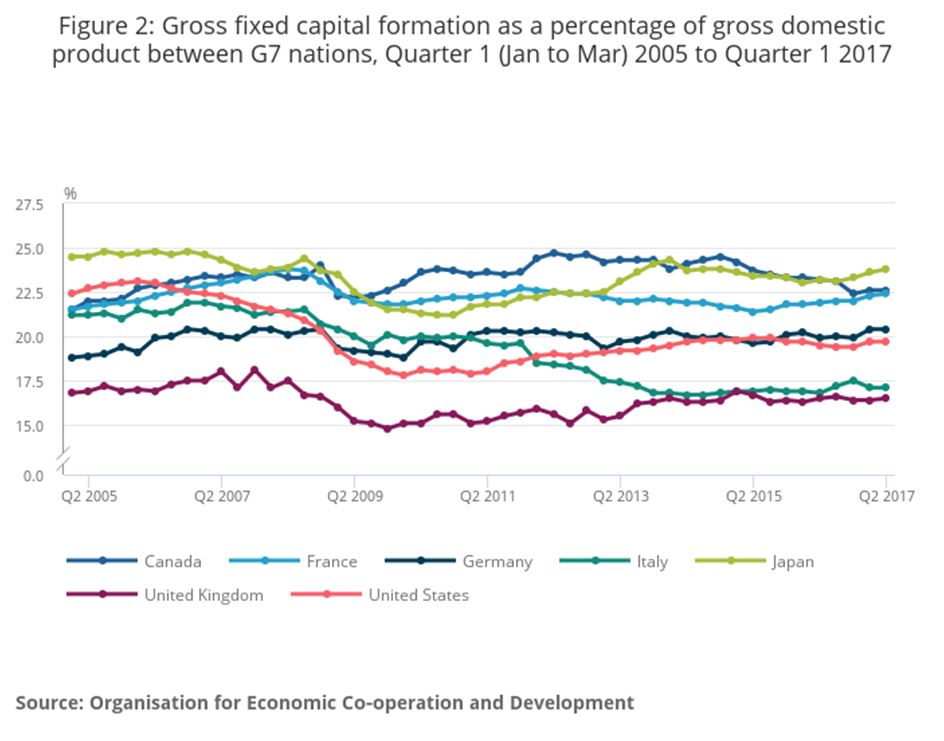
The British economy lags even comparable countries in the G7 who themselves have experienced a declining rate of investment. This is illustrated in the chart below.
Chart 2. UK Has Persistently Low Investment (GFCF)
In the same analysis from the Organisation for National Statistics (ONS) it is shown that over the entire period from 1997 and 2017, the proportion of GDP directed towards fixed investment is the lowest in the OECD as whole, at 16.7% of GDP. The next lowest are Italy and Greece, both registering 19.6% of GDP. The highest was South Korea almost double at 30.8% of GDP.
This is overwhelmingly a failure of the private sector, which is responsible for the large majority of Investment in the British economy.
This failure to invest in the means of production leads directly to an inability to increase production in any significant way. This in turn has produced economic stagnation. Under any government it would be very difficult to raise living standards and improve public services in these circumstances.
But the policy of successive government has been to deepen the crisis for the mass of the population through an austerity policy which transfers incomes and wealth from workers and the poor to big business and the rich. Public services have not stagnated – they are in crisis. Take home pay for millions of workers has not been stationary, there is a concerted effort to drive pay levels down in real terms. The same is true of social welfare benefits.
In contrast, the number of billionaires in this country has risen from 17 in 1990 to 177 in 2022, and their aggregate wealth has risen tenfold to over £600 billion. This is almost £10,000 for every person in the country, including children. Within a stagnating economy, an increasing share of the wealth produced is being extracted by big business and the rich.
What is the alternative?
More than four decades of Thatcher-style policies have demonstrated that greater reliance on the private sector cannot even deliver economic growth, let alone greater prosperity for the majority of the people. Therefore, the State must take the lead role in reviving the economy through Investment and in sharing incomes more equitably through redistribution.
The wild excesses of the brief Truss-led government highlighted the idiocy of a policy based on ‘setting the private sector free’. But this was only an extreme example of the failed consensus, which has largely operated untouched under successive governments.
The claim was that, through tax cuts and subsidies, the private sector would unleash a wave of Investment that would spur the economy, lift growth and create plentiful high-paid jobs. This was shown to be painfully untrue.
However it is true that the State, unencumbered by requirement to distribute returns to shareholders, can raise its own level of investment and deliver the same effects as falsely promised on behalf of the private sector.
But the opposite has happened.
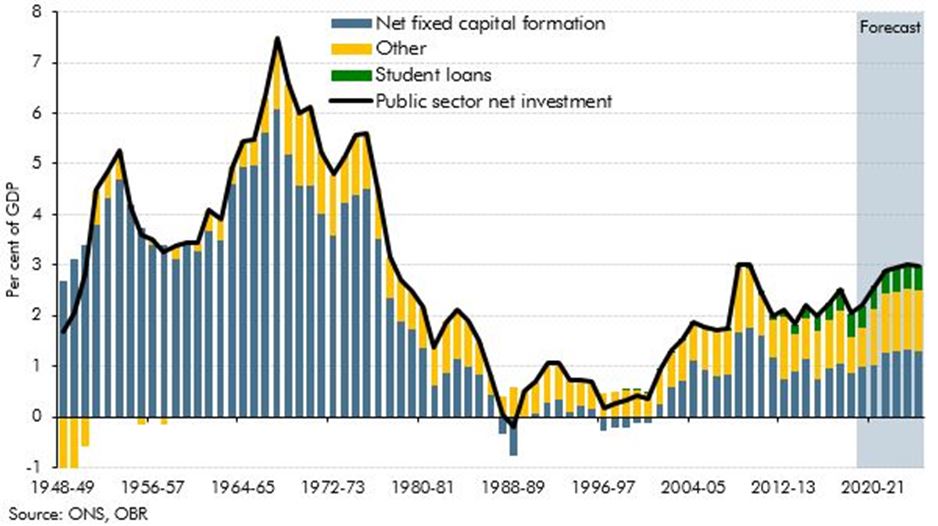
Chart 3. UK Public Sector Investment, % GDP
Chart 3 from the OBR (Office of Budget Responsibility) shows the level of actual Net Public Investment (Net Fixed Capital Formation, after depreciation and dilapidation are taken into account), represented by the blue columns. The much higher growth period pre-Thatcherism was also associated with a much higher level of public Investment. It has meandered around 1% of GDP for most of this decade, compared to up to 5% of GDP in periods of much stronger growth.
The focus for a bold Public Investment programme would be a true, green and just transition in energy, transport and housing, taxes on the banks and big firms to pay for the restoration of public services, and a massive increase in publicly-owned housing, and renationalised public services.
A key part of the revival of public services must be inflation-plus pay rises to recruit and retain workers. This should also apply to those sectors the government effectively controls, but where the private sector rakes off subsidised profits, such as rail, post and telecommunications.
For the private sector, the government should stop trying to hold down public sector wages in order to set a ‘going rate’ well below inflation across the economy for all wrokers. In addtion, existing and planned anti-union legislation schould be scrapped, to allow organised workers to bargain collectively for decent settlments. The government should also outlaw zero hours contracts and other casualisation measures, and offer those on the minimum wage and benefits something like the pensioners’ triple-lock.
To enable workers to make their case for fair pay levels, the shackles placed on trade unions need to be removed, which requires the repeal of the previous Tory anti-union laws.
The fight-back against this government has begun and the Tories are determined to block it. Everyone with an interest in opposing austerity and cuts to living standards should also oppose the government’s anti-union legislation.


Recent Comments