April 2017

What is at stake in France?

What is at stake in France?By Tom O’Leary

Although they are broadly similar in terms of GDP and population size, France is a more important country than Britain in the EU. Any move by France to exit the EU and the Single Market would have a far greater impact than the self-inflicted damage to living standards in Britain arising from Brexit. As a founder member of all the EU’s forerunners and an economy more deeply integrated into the Eurozone economy, a French departure would have a shattering effect. At the very least a number of other countries could also be expected to depart, including Spain, Portugal and Italy.

Marine Le Pen is vying for the lead in the Presidential race, and she proposes a referendum on a French exit. The continued strength of Marine Le Pen’s far right and overtly racist Front National in the opinion polls is evidence of a deep malaise in French society. The FN continues to record about one quarter of the vote, while many other candidates also play a similar anti-immigrant and anti-Muslim tune in a lower register.

France, like many European countries including Britain, does not have an immigration crisis. It has an economic crisis in which immigrants and minority ethnic and/or religious communities are used as scapegoats. Without its migrants, and the daughters and sons of migrants, the economic crisis would be even more grave. 

The road to socialism is very unlikely to lead through the EU. Under certain circumstances, where a socialist programme of taking control of the means of production to increase investment was being offered, exit could lead to far better outcomes than sticking with the EU. Even then, the new government would need great skill in minimising the disruption to trade. But of course, this is not what the overtly racist Le Pen proposes, but nor does any other candidate.

The French crisis

Like every other phenomenon, the analysis of current economic situation must begin from evidence, not myth or rhetoric. The outline of the crisis is evident from Chart 1 below. It shows the change in real GDP since the crisis began and the change in the main components of GDP.

Chart 1. France Change in Real GDP & Components, 2007 to 2016
 
Real GDP has risen by just €104 billion since the crisis and after 8 years is only 5.2% higher than in 2007. This is equivalent to an annual average growth rate of little more 0.6%. Once again, we find that Consumption growth has been unable to lead the economy. Consumption has risen more strongly than GDP itself. Contrary to widespread belief, Government Consumption is also higher. It has risen by 13.8% over the period and in percentage terms is actually the strongest component of all.

The drag on GDP has come from the weakness of Investment, which has fallen by €8 billion since 2007. This combination of rising Consumption and falling Investment has led to a widening trade deficit. As falling Investment means declining competitiveness any increase in consumer and other demand is disproportionately met by rising imports. Statistically, the widening deficit on net exports has been the biggest factor subtracting from GDP. 

The fall in Investment has also been reflected in a decline in both industrial production and construction over the period. The French crisis is a crisis of investment.

Investment-led growth

In the corresponding 10-year period up to 2007, Investment rose by 39%. Simply in order to achieve that pace, Investment would need to rise now by €90 billion, equivalent to 4.2% of GDP. It would then need to continue to rise faster than GDP. The private sector, which accounts for the bulk of Investment in all capitalist economies, is either unwilling or unable to raise its level of Investment. French profits have not even kept pace with meagre GDP growth, up €63 billion in nominal terms since 2007 compared to a €280 billion rise in nominal GDP. As a result, the public sector is the only other agent that could increase Investment.

Is this even possible within the EU and operating under the EU Commission’s ‘Trimester’ of national budget oversight, the ‘six-pack’ and the strictures of the ECB?

The reality is that no country has tried. While a number of countries have a higher proportion of GDP directed towards Investment than France, they have all been cutting Investment. In virtually every European country (including the UK) public spending has been rising (on Consumption) while public sector Investment has been cut.

What would be required is a 180-degree turn. Public spending should be maintained, but public Investment should be very substantially increased. In terms of the main candidates, Le Pen says nothing coherent about the economy at all. Her entire programme and campaign is racist scapegoating. Macron says he would initiate a €50 billion public investment programme. But this is just €10 billion a year, when €90 billion and more is required. At the same time he would tear up worker protections, and slash taxes for businesses and the rich. This would lower living standards, and probably increase the public sector deficit, with even the meagre investment pledge the first likely casualty. Fillon’s policies are similar, if more right wing. He talks of €35 billion in public investment, but as this is conditional on private investment it has more of the character of a subsidy than an investment programme. By contrast, the only left candidate in the race is Melenchon who would invest a much more substantial €102 billion.

In EU terms, France is a very important country, the second most important after Germany. As a French exit risks destroying the entire EU, it has a very great weight within the EU and could use that for its own benefit and for the whole of Europe. A menu of measures could include:

  • a derogation from (or better, rewrite of) the EU fiscal rules to exempt public borrowing for investment from all fiscal targets
  • a large increase in public borrowing for investment
  • a large increase in the budget and lending of the European Investment Bank across Europe
  • an increase in the EU Budget for investment purposes
  • ECB bond purchases to widen to include the debt of the state-owned enterprises and semi-state sector, public bodies, regions and municipalities linked to their increased investment
  • Europe-wide investment programmes in renewable energy, integrated energy storage and distribution networks, hi-speed rail, improved broadband and telecommunications links, and in higher education
  • using their balance sheet strength, increase borrowing for investment by the still substantial French state-owned sector, including railways, energy, cars, telecoms, post, airports and others
  • altering the tax code to penalise companies paying exorbitant salaries or shareholder dividends, and to benefit companies increasing their level of investment and training.
Naturally, this is only an outline programme, and those with specific knowledge could improve and refine it substantially. It should be accompanied by a series of measures boosting wages, capping prices, and improving public services to ensure living standards rise and to bolster public support. The tax revenues from rising investment-led activity can be used to fund these.
What then, if the EU Commission and the ECB said no? In that event, the logical course would be to begin to implement these measures on a national basis. This would have a strongly positive effect on growth, albeit diminished if they are not EU-wide.
There would be huge risks if there was an attempt to sabotage this series of reforms. France could refuse to pay all fines or penalties that might be imposed by the Commission, secure in the knowledge that its bargaining position was greater than almost any other EU country. If then the ECB cut French banks adrift from its liquidity operations (as it did with Greece), this would be taken as a notice to quit the Euro.
In that circumstance, the EU institutions would be trying to prevent polices which were evidently in the interests of the overwhelming majority of the population. The French government would be trying to enact them. At that point, would the institutions risk the entire European edifice in order to block sensible reforms? This is an unknown, as it has not yet been tried. 

Austerity has only half worked. New, more radical measures will be attempted

Austerity has only half worked. New, more radical measures will be attemptedBy Tom O’Leary

The latest GDP data show that austerity has only been effective in driving down wages. It has not been effective at all in boosting profits, which is its purpose. As a continuation of existing policy may simply yield the same results, new and more radical measures will be needed.

Wages down, but profits not up

The purpose of austerity is to increase the share of national income that goes to business and the rich, that is, to boost the profit rate. It has nothing to do with deficit-reduction, which is much more readily achieved by polices that boost growth and thereby increase tax revenues. To boost profits, wages have been frozen or cut, while the total level of social spending has been frozen. Taxes have been cut for business and the rich. So, the UK began the crisis with a main Corporate Tax rate (on profits) of 28%. It is now 20% and is due to fall to 17% in 2020. At the same time, taxes paid by workers and the poor have risen, especially VAT.

But the UK version of austerity has only produced the effect of depressing wages and the incomes of the poor. Real wages have begun to decline once more. But austerity has not succeeded in transforming the profitability of UK businesses. Table 1 below shows the distribution of national income as a proportion of GDP in 2013, when the current very modest recovery properly began. It also shows the proportionate distribution of national income of the £200 billion rise in nominal GDP between 2013 and 2016.

Table 1. Distribution of UK National Income as a Proportion of GDP
Source: Calculated from ONS data (Schedule D of ONS national accounts release)

The share of profits (Gross Operating Surplus) has not risen at all. From 2013 to 2016 nominal GDP rose by £200 billion. The Compensation of Employees has risen by just £84 billion. Austerity has been very ‘successful’ in driving down workers’ share of incomes, from 50.5% of GDP in 2013 to just 42% of the change in GDP from 2013 to 2016. (In real terms, the effect of inflation is that total compensation has risen minimally over the period). 

But austerity has not been successful at all in driving up the profit share of private corporations. In the financial sector profits have actually fallen even in nominal terms. For non-financial private companies as a whole profits have only just about kept pace with the moderate rise in GDP. There has been no profits bonanza for private producers.

Instead, there has been a sharp increase in the ‘Other income’ share of national income. This includes a variety of income streams, and mixes profits and incomes of the non-profit institutions, households and others. Partly it reflects the growth of spurious ‘self-employment’.

To demonstrate this is not a quirk of using the year 2013 as a starting-point, the same exercise is repeated in Table 2 below. This shows the distribution of national income as a proportion of GDP in 2007, the last year before the recession. It also shows the proportionate distribution of national income in the £409 billion rise in nominal GDP between 2007 and 2016.

Table 2. Distribution of UK National Income as a Proportion of GDP
Source: Calculated from ONS data (Schedule D of ONS national accounts release)

The outcome is that austerity has worked to driven down the wage share, but it has not boosted the profits of companies. Without boosting their profits there will be no significant increase in business investment. As raising profitability remains the aim of policy, so further more radical measures will be required.

This government will try to impose radical measures to further curb wages and spending on public goods to boost profits. The mechanism for this will now be the opportunities afforded by Brexit. It seems likely, given the ineffective outcome of policy to date, that this project would have been attempted in any event within the EU. But removing the protections on workers’ rights, the environment, consumer safeguards and so on provides greater room for manoeuvre.

Weak starting-point

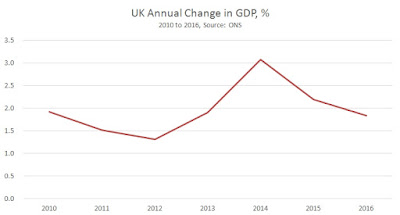
For the year 2016 real GDP grew by 1.8%. This is the second weakest annual rate of growth since the crisis began. Tory government policy temporarily boosted consumption in 2014 as part of its re-election campaign. Growth has been decelerating since.

Real UK GDP growth in 2016 was marginally less than that of the EU as whole (1.9%) and a little greater than the US (1.6%). Of course, it was a fraction of Chinese GDP growth (6.7%).

The effect of the Brexit vote has been mainly felt through a decline in the pound, which has both lifted prices and should boost exports. Those trends will not continue indefinitely. Instead, the act of leaving the Single Market will create a new situation. The GDP data provide evidence of what that new situation will look like and how the current contradictions will be resolved.

Chart1. UK GDP Growth Is Slowing

Commentators have tended to focus on the rundown in the household savings ratio to a new low of 3.3%. This is an average rate and clearly implies that a large and growing proportion of households are able to save nothing at all or are becoming more indebted.

Household Consumption grew by a full percentage point faster than GDP in 2016, 2.8% versus 1.8%. As Household Consumption accounts for about three-quarters of all Consumption in the UK this would usually mean total Consumption was rising strongly. If Consumption could lead growth this would be a positive development.

For ‘keynesians’ who persist in arguing that Consumption does lead growth, the UK economy is a text book case. Except that the argument is wrong. Strong Consumption has not led to rising Investment, as the ‘keynesians’ suggest. The rise in Consumption cannot be sustained by a persistently declining savings rate. Instead, at a certain point households will decide they cannot or will not continue to support rising Consumption when incomes are not rising as fast and will restrain spending, maybe sharply. Sustained rises in Consumption requires sustainably rising incomes. This is only generally possible if the economy itself is growing.

Falling business investment

Rising growth itself depends on increasing trade and rising investment. Yet business Investment fell in the final quarter of 2016, down 0.9% from a year ago. This is in line with 2016 as whole, where business investment fell by 1.5% from 2015 to 2016. Rising Consumption has not led to rising Investment as Chart 2 shows.

Chart 2. Annual levels of business investment and annual growth rates of business investment
Source: ONS

Private Investment is driven by anticipated profits. This is not the same as preceding profits, which businesses judge can and do vary considerably. Chart 3 below shows there is a close correlation between the change in Profits (blue line) year-on-year and the change in Business Investment (red).

Chart 3. UK Profits and Business Investment, % Change, 1997 to 2016

As the purpose of private investment is to realise profits, in general changes in profits tend to lead changes in business investment. But in 2016 business investment fell while profits grew very modestly. Businesses expect profits to be significantly lower in future. 

Naturally businesses can be wrong. A rise in exports could have a sustained positive impact on production and profits for export. This could be a response to the fall in pound, compensating for the rise in prices and fall in real incomes that is underway.

But there is no evidence that this is the case. Exports rose by 1.8% in 2016, not faster than GDP as a whole. By contrast imports rose by 2.8%. So the trade gap actually widened from £45 billion in 2015 to £52 billion in 2016. Economists speak of ‘J-curve’ effects on the trade balance after currency devaluations. This simply describes a process where the trade balance initially deteriorates and only improves years later as the effect of rising import prices fades and exporters win market share based on lower export prices.

That might be possible, although it would run contrary to established UK custom, where devaluations are used simply to hike prices, while investment is kept low so that any competitive gain is quickly eroded. If UK producers were gearing up for a global export drive, they would be using the windfall of the more competitive currency to restrain export price increases and raise investment. Neither of these two potential developments are taking place. As previously noted, business investment is falling. Remarkably too, UK producers have chosen to raise export prices at a faster rate than the rise in import prices (see Chart 4, below).

Chart 4. Indices of UK Export prices and UK Import Prices January 2015 to January 2017
Source: ONS
While the level of Investment in the UK economy is stagnant or falling it is almost impossible for real wages to increase significantly. Wages are not set primarily by the supply and demand for labour, but by the struggle between workers and their employers. To raise wages and conditions on the docks, it was necessary to end the system of day labouring through unionisation, not to reduce the number of dockers needing work.

Over the medium-term growth is driven by Investment. Without growth, workers would have to engage in enormous struggles in order to increase their wages by wresting capital’s share of total income. Real wages look set to fall further, and will be part of the government strategy for boosting capacity.

Brexit and the crisis

Using the Rahm Emmanuel dictum of ‘let no good crisis go to waste’ the government has embarked on a policy which will use the new-found freedom of Brexit to get rid of ‘red tape’ (workers’ rights such as restrictions on the working week or maternity leave, environmental protection and consumer standards).  

The claim is that the UK will be moving closer to the Singapore model of development. This is untrue. Singapore’s per capita GDP is US$85,382 versus the UK’s $41,756, according to World Bank data. This primarily arises from two factors. First, Singapore’s openness to trade is nearly 6 times greater than the UKs (326% of GDP versus 56.5%). Secondly, Investment (Gross Fixed Capital Formation) is a higher proportion of that much higher per capita GDP (25.5% versus 16.9%). Contrary to myth, Singapore also exercises a large degree of public control over investment, including outright state investment.

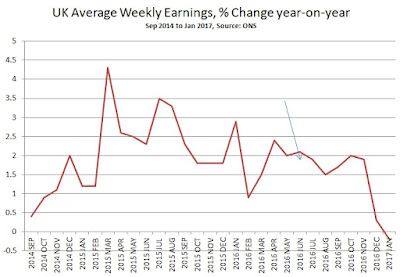
Chart 5 UK Average Weekly Earnings

The blue arrow points to the date in 2016 of the UK’s EU Referendum

Brexit will not include any of this. In the words of leading leave campaigner Michael Gove, the aim is that the UK’s relationship with the EU will not be like Norway or Switzerland, but like Albania. The UK is severing its links with its closest markets, whereas Singapore has thoroughly integrated itself into the regional South East Asian economy and the rest of the world. In the UK the low level of investment is declining. The state will not be a directing hand over investment. It will be increasingly laissez-faire. In 2012 the Tories commissioned, but were unable to implement the main measures of, the Beecroft Report, calling for the wide-ranging removal of workers’ right.

So far, austerity has ‘worked’ only to drive down wages. It has not driven up profits. New, more radical solutions will be attempted if a real recovery in profitability is to be achieved, facilitated by Brexit. 

What China achieving ‘moderate prosperity’ means for China and the world

What China achieving ‘moderate prosperity’ means for China and the world

By John Ross

China’s recently concluded “two sessions,” the National People’s Congress and the Chinese People’s Political Consultative Conference, reaffirmed China’s strategic medium term goal to create a “moderately prosperous society in all respects” by 2020. But “moderately prosperous” is a specifically Chinese term. To give a clearer idea internationally of what achieving this would mean, it is enlightening to give a global comparison for China’s goal of “moderate prosperity.”
The result is extremely striking. If China successfully attains “moderate prosperity” by 2020, then at current exchange rates:
  • Only 19 percent of the world’s population will be in countries with a higher per capita GDP than China,
  • 62 percent of the world’s population will be in countries with a lower per capita GDP than China.
China will have overtaken almost every developing country. Its level of economic development will have become higher than several countries in Eastern Europe. A country’s level of economic development, its per capita GDP, is an overwhelming determinant of improvement in overall living and social standards. Internationally almost three quarters of life expectancy, the single most sensitive all round indicator of human conditions, is explained by per capita GDP. The difference in life expectancy between a low-income economy and a high income one by international standards is twenty years – 61 compared to 81.
Pre-1978
It is necessary to note that in 1949, when the People’s Republic of China was created, China was almost the world’s poorest country – in 1950 only 10 countries out of 141 for which data can be calculated had lower per capita GDPs. In 1949 China’s life expectancy was 35 – only 73 percent of the world average.
From 1949 to 1978 China achieved a “social miracle” without precedent in world history. From 1949 until Mao Zedong’s death in 1976, China’s life expectancy rose by 29 years – from 35 to 64, increasing by more than one year for each chronological year, or from 73 percent of the world average to 105 percent. There has never been such a sustained rapid increase in life expectancy in any other major country in human history.
But if in 1949-78 China’s social achievements were historically unprecedented, its economic growth was only approximately in line with the world average.
Trends after 1978
After the 1978 “reform and opening up,” as is well known, China’s economic growth became the world’s highest. Taking World Bank data:
  • Between 1978-2015 China’s annual average growth rate was 9.6 percent compared to a world average of 2.9 percent – China’s growth rate was more than three times the world average.
  • As China’s population growth was relatively slow, China’s global growth lead in per capita GDP was even greater. In 1978-2015 China’s annual average per capita GDP growth was 8.6 percent compared to a world average of 1.4 percent – China’s per capita GDP growth rate was more than six times the world average.
The result was the dramatic continuing rise in China’s relative position in terms of world economic development. The relevant data, showing the proportion of the world’s population living in countries with higher and lower per capita GDPs than China, is set out at current exchange rates, China’s preferred measure, in Figure 1. In internationally comparable prices (purchasing power parities – PPPs), the measure preferred by international economic institutions, the data is shown in Figure 2.
For clarity it should be noted that the sharp oscillations in China’s relative global position measured at current exchange rates during the 1980s do not reflect shifts in China’s productive economy but merely exchange rate shifts between China and India. Taking first the starting point:
  • In 1980, measured in PPPs, only 2 percent of the world’s population lived in countries with a lower per capita GDP than China, while 75 percent were in countries with a higher per capita GDP.
  • Measuring in current exchange rate is more complex, due to the changes in exchange rates in 1981-82. But if an average is made of 1981-82, then at that date 14 percent of the world’s population was in countries with a lower per capita GDP than China and 64 percent higher than China.
By either measure, of course, China’s relative position in the world at the beginning of “reform and opening up” was low.
The situation in 2016
By 2016, due to rapid economic development, China’s situation was entirely transformed.
  • In PPPs, only 26 percent of the world’s population lived in countries with a higher per capita GDP than China, while China had a per capita GDP higher than 55 percent of the world’s population.
  • At current exchange rates 26 percent of the world’s population lived in countries with a higher per capita GDP than China and 55 percent in countries with a lower per capita GDP than China.
In summary, by 2016 approximately only one quarter of the world’s population lived in countries with a higher per capita GDP than China, while the majority of the world’s population lived in countries with lower per capita GDPs than China – a total transformation of China’s situation.
Figure 1
17 03 15 Figure 1 Current Exchange Rates
Figure 2
17 03 15 Figure 2 PPP

2017-2020
From 2017-2020, the final period during which China projects “relative prosperity” to be achieved, economic projections must be made. Those used for calculations here are from the IMF’s October 2016 World Economic Outlook. These are chosen as they are conservative – exaggeration is of no use in analysing serious matters. The IMF data assume lower growth rates than China’s targets – an average 6.0 percent growth in 2017-2020, compared to the 2017 target of 6.5 percent and those for the 13th five-year plan (2016-2020). By 2020 on this data:
  • At market exchange rates only 19 percent of the world’s population in 2020 will be in countries with a higher per capita GDP than China and 62 percent in countries with a lower per capita GDP.
  • Measured in PPPs, 24 percent of the world’s population will be in countries with a higher per capita GDP than China and 58 percent in countries with a lower per capita GDP.
China has already overtaken in per capita GDP or in PPP all of the world’s other largest developing economies – India, Indonesia and Brazil. By 2020 China’s per capita GDP will be higher than several Eastern European countries.
As China has 19 percent of the world’s population, quite literally never in human history has anything approaching such a large proportion of the world’s population had its conditions of life improved so rapidly. That will be the astonishing measure of China’s success in achieving “moderate prosperity” – it is, without comparison, literally the greatest economic achievement in human history.
*   *   *
This article originally appeared at China.org.cn.