September 2013

Capping energy prices and investment in renewables are both required

Capping energy prices and investment in renewables are both requiredBy Michael Burke

The announcement by Ed Miliband that Labour would temporarily cap energy prices is a welcome one. But the reaction to it reveals to deep-seated problems of the British economy and British politics.

According to Labour’s own (uncontested) research household energy bills have risen by 29% in 3 years. Therefore the pledge to cap prices rises for 20 months is really a very modest reform. According to a campaign tool ‘Freezethatbill’ the average household has seen bills rise by £300 under the Tories and will save £112 a year from this policy. That would be an estimated saving of £160 in total.

The reaction to this moderate plan has been vociferous and extreme. Lurid headlines about the lights going out in Britain have been accompanied by open threats from the large energy companies to discontinue investment. SEB has long argued that the cause of the slump is an investment strike by private firms. The energy companies threatened to make that an all-out strike in their sector.

The Tory energy secretary and a host of MPs immediately relayed the threats of the energy companies. This is hardly surprising given the very large donations those companies make to the Tory Party. The Tory Press did likewise.

However it cannot be argued that this was simply scaremongering, based on empty threats. It is already the case that the energy companies do not invest sufficiently, either in storage capacity or in renewables. The energy companies, especially those controlling energy reserves, have previously withheld supplies in order to push up prices. It was previously reported that in March this year the British economy was just half a day away from running out of gas. But the reality was that energy companies withheld available supplies, which drove up liquefied natural gas prices to 150p a therm, from 57p earlier in the year.

In pursuit of profits, the energy companies have been willing to collude in driving up prices, and endangering supply. They are able to do this, in part, because existing capacity is extremely limited and they are an oligopoly.

This is the real threat to Ed Miliband’s policy. Clearly the price pledge is only relevant if wholesale energy prices are rising. Capping retail prices for business and household consumers while wholesale prices are rising can only lead to a profits squeeze. As a result the energy companies threaten that they will reduce their already inadequate level of investment, even while some of them have caved in on the temporary price freeze. This could lead to energy shortages and would end Ed Miliband’s much more ambitious goal of de-carbonising energy production by 2030.

The financial position is clear. Taking the shareholder payout from just British Gas, Centrica, Scottish & Southern Electricity and National Grid alone the current annual dividend is £3.4bn. Yet despite the imperative for investment in renewables, the level of investment has halved from already low levels over 3 years.

This private investment slump has been exacerbated by the withdrawal of state investment in the energy sector under this government. Private companies have proved incapable of providing the necessary investment for long-term projects over a prolonged period. They are simply unwilling to take the risk. Yet the current government has reduced its own investment in subsidies for renewables which reflects its commitment to the oil companies and in pursuit of the illusory benefits of fracking.

Ed Miliband’s policy of capping energy prices is very welcome. It makes a small contribution to softening the fall in living standards. But the extreme response to it highlights the complete unwillingness of the energy companies to provide the necessary investment in renewables and storage capacity. De-carbonisation and energy security require large-scale state-led investment. Instead dividend payouts to shareholders are at record levels. Faced with sabotage and threats from the energy companies, nationalisation is a necessary step that can lead to the investment that is imperatively required.

Did austerity lead to recovery? No, GDP was increased by government spending

Did austerity lead to recovery? No, GDP was increased by government spendingBy Michael Burke

The government and its supporters have been quick to claim that the most recent GDP data have vindicated its austerity policy. George Osborne says the argument in favour of austerity has been won some more excitable commentators have even talked of a boom.

Usually, SEB would provide analysis of the GDP data after the publication of the national accounts, the third release in the cycle from the Office of National Statistics, which provides a detailed breakdown of the components on economic activity and the final revision to the data.

But the claims made for the British economy following the most recent GDP release (and some subsequent surveys) are so outlandish, and so at odds with the facts, that is worth providing a short analysis now.
The data is still partial and subject to revision. But there is enough evidence to demonstrate factually that the weak recovery is not a reward for austerity, but is in fact entirely a function of increased government spending.

The economy has expanded by just 1.8% in 3 years of austerity, an annual rate of 0.6% which is less than one-quarter of previous trend growth. The gap between the current level of GDP and trend growth for the British economy is widening. In addition, the growth to date is entirely a function of increased government spending.

Factual Analysis

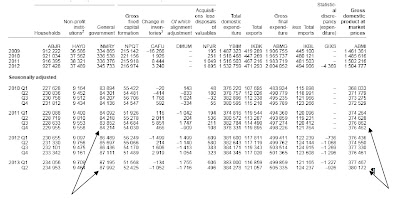
This verdict is so at odds with both stated government policy and the overwhelming commentary on the latest data. Therefore it is important to provide the hard evidence supporting this analysis. The can be found on Table C2 of the latest release, Second Estimate of GDP, Q2 2013 (ONS).

Total government current spending was barely changed from the time the Coalition took office to the end of 2011. (In the ordinary course of events real government spending should rise in line with population growth and in a recession should rise much faster to offset the effects of recession. Unchanged government spending represents a harsh ‘austerity’ stance).

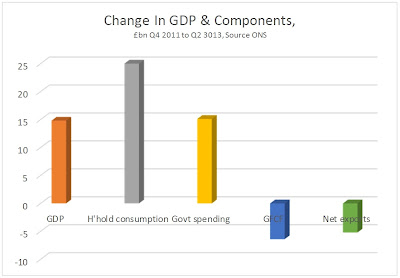
However, from the 4th quarter of 2011 to the 2nd quarter of 2013 government current spending has risen decisively by an annualised £15.1bn. GDP did not begin to expand until two quarter later. This is the time lag SEB has previously identified in the relationship between changes in government spending and changes in GDP. Rising government spending has led the recovery.

While the increase in government spending since the 4th quarter of 2011 to the most recent quarter amounts to £15.1bn, the rise in aggregate GDP over the same period is just £14.8bn. Therefore, the rise in government spending not only led the recovery, but more than accounts for the entire expansion over the same period (as some other components of GDP have contracted).

Rising government current spending tends to support consumption, which is exactly what has happened over the last 18 months. The rise in household consumption has been the strongest of all components of GDP over that period, rising by £25bn. The chart below shows the changes in the national accounts since the government began increasing its current spending after the 4th quarter of 2011.

Fig 1

But weak household spending is not the source of the crisis. This remains the slump in investment. GDP is still £50bn below its previous peak in the 1st quarter of 2008, but investment (Gross Fixed Capital Formation) is £65bn lower. Household consumption also remains below £24bn its pre-recession peak. But it has been rising continuously for 2 year and now accounts for under half of the total decline in GDP. The fall in GFCF more than accounts for the entire fall in GDP.

It is not possible from the partial release of the data for the 2nd quarter of 2013 to establish the role of government in the continuing investment strike. But from the 1st quarter national accounts, it is clear that declining government investment has been exacerbating the private sector decline in investment. Government investment peaked under the last Labour government and has been cut continuously ever since.

But the analysis is confirmed by the separate ONS data on public finances. The presentation of the public finances data vary significantly from the presentation of government consumption data in the national accounts. Among the many differences is that the former are presented in nominal terms only. Even so, these show (Table PSF5) that in nominal terms the level of departmental outlays rose to £305bn in the first half of 2013, from £283bn in the same period of 2012. This is a rise of 7.8% and way above the rate of inflation.

Conclusion

There is no mystery to the current very weak recovery. It is led by a moderate increase in government spending, which more than accounts for the entire increase in GDP over the same period.

This runs counter to the government’s stated ‘austerity’ policy. But it is accompanied by a cut in government investment, which exacerbates the private sector investment strike. It is this investment strike which remains the source of the crisis, which cannot be resolved by increasing current spending.

Logic would dictate that any government which wanted to support the economy would increase investment, which is the source of the crisis. Conversely, any government fixated on deficit reduction would probably be inclined to cut both current and capital spending.

This government is committed to neither economic recovery nor deficit-reduction. Instead, it is committed to boosting profits. That is why it is willing to increase current spending which supports consumer demand but refuses to increase investment as this would displace private capital from potentially profitable sectors of the economy.

Since this government is not sticking to its own spending plans, it makes even less sense for an incoming Labour government to do so. Instead, it needs to address the source of the crisis by increasing state investment.

Fig. 2

China has overtaken the US to become the world’s largest industrial producer

China has overtaken the US to become the world’s largest industrial producer

By John Ross

The period since the international financial crisis began has for the first time in over a century seen the US displaced as the world’s largest industrial producer – this position has now been taken by China. It has also witnessed the greatest shift in the balance of global industrial production in such a short period in world economic history. In 2010 China’s industrial output exceeded the US marginally but this has now been consolidated into a more than 20% lead with the gap still widening further.

In 2007, on UN data, China’s total industrial production was only 62% of the US level. By 2011, the latest available comparable statistics, China’s industrial output had risen to 120% of the US level. China’s industrial production in 2011 was $2.9 trillion compared to $2.4 trillion in the US – this data is shown in Figure 1.

Figure 1
13 08 25 Chart 1 US & China Industrial Production

When the comparable data is released for 2012, China’s lead will have increased substantially– between December 2011 and December 2012 China’s industrial output increased by 10.3% whereas US industrial production increased by only 2.7%. Calculations based on estimates in the CIA’s World Factbook indicate in 2012 the value of China’s industrial production was $3.7 trillion compared to $2.9 trillion for the US – which would mean China’s industrial production was 126% of the US level.

Taking only manufacturing – that is excluding mining, electricity, gas and water production – in 2007 China’s output was 62% of the US level, by 2011 it was 123%. Again the gap has widened in 2012 and 2013.
No other country’s industrial production now even approaches China – in 2011 China’s industrial output was 235% of Japan’s and 346% of Germany’s.

World Bank data, using a slightly different calculation of value added in industry, confirms the shift. On World Bank data China’s industrial production in 2007 was only 60% of the US level, whereas by 2011 it was 121%.

Therefore in only a six year period China has moved from its industrial production being less than two thirds of the US to overtaking the US by a substantial margin. If China was the ‘workshop of the world’ before the international financial crisis it is far more so now.

The trends producing such dramatic shifts in such a short period are shown in Figure 2. In six years China’s industrial output almost doubled while industrial production in the US, Europe and Japan has not even regained pre-crisis levels. To give precise statistics, between July 2007 and July 2013 China’s industrial production increased by 97% while US industrial output declined by 1%. Industrial production data for July is not yet available for the EU and Japan, but between June 2007 and June 2013 EU industrial output fell by 9% and Japan’s by 17%.

Figure 2
13 08 25 Chart 2 China & Advanced Industrial Production

It is this enormous rise in China’s output which also drove the much discussed global shift in industrial production in favor of developing countries – in the six year period to June 2013, the latest date for which combined data is available, industrial production in advanced economies fell by 7% while output in developing economies rose by 65%.

As is clear from Figure 3, China accounted for the overwhelming bulk of the increase in the developing economies. Industrial production in Latin America rose by 5%, in Africa and the Middle East by 6%, and in Eastern Europe by 10%. But China’s industrial production in this period rose by 100% – industrial output in developing Asia as a whole rose by 65%, but the majority of this was accounted for by China.

Figure 3

13 08 25 Chart 3 Advanced & Developing Industrial Production


The quite literally historic scale of these shifts makes clear that by far the most important development in world industrial production in the last period is this extraordinary rise of China. Between 2007 and 2011 China’s industrial production rose by $1,465 billion, in current prices, while US industrial output rose by only $88 billion in current prices and declined slightly in inflation adjusted terms. China’s industrial production rose by 17 times as much as the US.

Such a rise in China’s industrial production has consequences spreading far beyond industry itself. Industry has easily the most rapid increase in productivity of any economic sector – notably compared to services. The decline of industrial production in the EU and Japan, and relative stagnation in the US, means China is cutting the productivity gap between itself and the advanced economies. This is crucial for progress in raising China’s relative GDP per capita and living standards.

This rising productivity also explains why China’s exports have been able to maintain their competitiveness despite substantial increases in the exchange rate of China’s currency the RMB. On Bank for International Settlements data, the RMB’s nominal exchange rate rose by 25% between July 2007 and July 2013. But China’s real effective exchange rate, that is taking into account the combined effect of the nominal exchange rate and inflation, rose by 31% But despite this major currency revaluation China’s exports continued to exceed its imports.

The ability of China to successfully absorb such high increases in its exchange rate, due to high levels of industrial productivity increases, directly translates into relatively lower prices for imports and improved relative living standards for China’s population.

This data also settles the dispute between who believed there was a major industrial revival in the US, such as the Boston Consulting Group, and Goldman Sachs and other analysts who correctly concluded no such major revival has occurred. Those in China, such as Lang Xianping, who wrote that a great US industrial revival was taking place and China’s industry was in crisis look foolish in the light of data showing China’s industrial output doubled in a period when US industrial production did not grow at all. The only reason US industrial performance does not appear very weak, with negative net growth over a six year period, is because of the even worse performance of a major decline in industrial output in the other advanced economic centers – the EU and Japan.

It is naturally important not to exaggerate this scale of advance by China in industrial production. China’s industrial output is now considerably larger in value terms than the US, but the United States retains a substantial technological lead which it will take China a considerable period to catch up with. Due to a long period of globalization and consolidation by US companies, both processes which are only at early stages in China, US manufacturing firms are still four times the size of China’s in terms of overall global revenue– although between 2007 and 2013 Chinese manufacturing firms overtook Germany to become the third largest manufacturing companies of any country.

The scale of these changes in world industrial production also make clear that in comparison to developments in China gas and oil ‘fracking’ in the US, which have attracted widespread media attention, is merely a statistical sideshow – as already noted overall US industrial production has not even recovered to pre-crisis levels.

For the first time for over a century the US has been definitively replaced as the world’s largest industrial producer. Such a once in a century shift can literally only be described as historic.


This article originally appeared in Key Trends in Globalisation