By Tom O’Leary
The UK economy remains mired in stagnation caused by the crisis of investment. The official forecasts for UK growth point to the weakest expansion in the economy in the modern era, since 1945.
The economic policy of the Labour Party under Jeremy Corbyn and John McDonnell is to increase public investment as a way out of the crisis, which is entirely correct. In addition, there will be increased spending on public services, the NHS, education and so on, financed by increasing taxes on big businesses and the rich. This amounts to reversing the tax give-aways under the Tory policy of austerity, which was fundamentally a transfer of incomes from workers and the poor to big business and the rich and is also entirely appropriate.
The purpose of this piece is to examine the economic impact that increased investment, using the latest developments in statistical analysis of the medium-term determinants of growth.
Accounting for growth
As there is widespread confusion on this matter, it is important first to establish what are the factors that determine economic growth. It is widely and incorrectly asserted that these are variously, increasing ‘demand’, increasing the supply of money, increasing Consumption, improved innovation, or rising ‘entrepreneurial activity’. None of these assertions is correct.
The world’s leading expert on productivity growth is Dale Jorgenson. The methodology he and his colleagues have expounded and elaborated in several works has been adopted in growth accounting by the OECD, among others. In ‘Productivity and the World Economy’ (pdf) he writes,
“The contributions of capital and labor inputs have emerged as the predominant sources of economic growth in both advanced and emerging economies. Economic growth depends primarily on investments in human and non-human capital, including investments in both tangible and intangible assets”.
Using the analysis outlined in his work it is possible to identify the impact of ‘investment in human and non-human capital.’
Jorgenson’s research shows that it is the amount of capital and the amount of labour, as well as their quality, that are the decisive factors in growth. This statistical analysis refutes all efforts to portray growth as ‘demand-led’, or ‘aggregate demand-led’, or a function of innovation, or entrepreneurial activity, or other myths.
In Jorgenson’s new book, ‘The World Economy’ (with Fukao and Timmer) he argues that one of its major findings is that, “replication rather than innovation is the major source of growth in the world economy. Replication takes place by adding identical production units with no change in technology. Labor input grows through the addition of new members of the labor force with the same education and experience. Capital input expands by providing new production units with the same collection of plant and equipment. Output expands in proportion with no change in productivity.”
The empirical proof of this analysis can be found through economic history up to and including the current crisis. In 2007 and 2008 the US and then all the leading capitalist economies did not suddenly experience a downturn in demand, or Consumption, or money supply growth, firms did not stop innovating and ‘entrepreneurs’ did not stop trying to make profits.
It should also be added that, among the real factors accounting for growth, the labour force did not stop growing (on the contrary, unemployment surged in many countries) and the education systems did not suddenly deteriorate.
In reality the 2007-2008 recession was caused by a slump in private sector investment and the continued stagnation of the leading economies is a function of the continued weakness of private sector investment. This is illustrated in Chart 1 below.
As Chart 1 shows, there was no crisis of Consumption until well after the Investment slump had already begun. By mid-2007 Investment growth in the G7 had slowed to a crawl and begun to contract a few months later. At that time Consumption continued to grow at its previous pace and did not begin to contract until the second half of 2008. Widespread measures to stimulate Consumption coming out of the crisis have only had a limited effect, largely leading to an increase in household indebtedness. Investment growth has never properly recovered and it is this that accounts for the continued stagnation in the G7 economies.
Accounting for investment
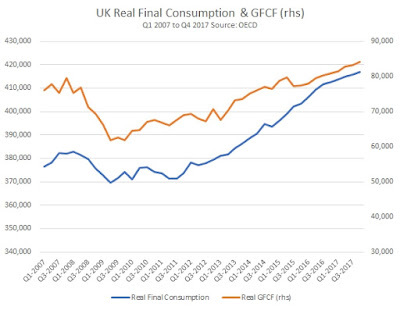
Just as in the G7 as a whole, the UK recession was caused by a slump in private sector investment as shown in Chart2 below.
Despite the fact that Investment is a far smaller component of UK GDP than Consumption, the contraction in Gross Fixed Capital Formation (GFCF) was far greater than the decline in Final Consumption. From the pre-recession peak to the trough at the low-point of the recession Consumption fell by £54.8 billion, while Investment fell by £70.4 billion.
Likewise, although Consumption growth has been exceptionally weak it now stands £136.8 billion above is pre-recession peak, while Investment is just £18.4bn above is pre-recession. Consequently the proportion of the economy directed towards Investment has decline from the pre-recession peak of 17.9% to 17.1% of GDP at the end of 2017. It is this that accounts for the weakness of growth overall and therefore the weakness of the growth in Consumption. This corresponds to the Jorgenson analysis.
From this analysis it follows that the Labour policy of increasing Investment is entirely correct. Furthermore, the policy of only borrowing to increase Investment is also correct. Only Investment to increase the productive capacity of the economy (the increase in the ‘means of production’) can sustainably increase the level of production of that economy.
But what is the likely return on that Investment? Or, put another way, what should be the level of Investment in order to achieve specific policy objectives of increased growth in output?
Here the Jorgenson analysis is indispensable. Its results are available from the Conference Board, which uses the same methods and data.
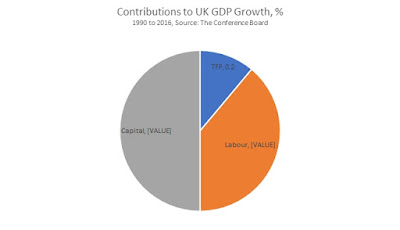
In the Conference Board Total Economy Database (adjusted version) May 2017, the contributions to UK GDP growth over the medium-term of capital inputs, labour inputs and Total Factor Productivity are shown as follows: Capital 0.9%, Labour 0.7% and TFP 0.2%. UK GDP itself grows by an average of 1.8% per annum over the medium-term (1990 to 2016), the aggregate of those inputs.
Within the category of Labour inputs the contribution of labour quality is a negative, at 0.1% and the total contribution of Labour inputs is entirely a function of the growth on the quantity of labour, +0.8%. Labour quantity can be increased either by increasing the productive workforce or by the existing workforce working longer hours, or some combination of the two. But in either event, the scope for increasing per capita living standards without increasing hours is almost wholly dependent on increases in Capital inputs.
Therefore, any sustainable increase in output per hour worked is overwhelmingly determined by the growth in capital inputs. The Corbyn-McDonnell focus on investment is therefore entirely correct, based on the most sophisticated mainstream economic analysis. (An entirely separate set of policies are needed to address the decline in labour quality inputs identified above, but that is not the subject of this piece).
The return on investment
The Conference Board data also allows an analysis of the return on capital investment which is the addition to the productive capacity of the economy, or the increase in the means of production.
The Incremental Capital-Output Ratio (ICOR) measures the ratio between increased Capital deployed and the resulting change in the annual level of output over the medium-term. From this it is possible to identify two effects. First, it is possible to identify the likely return on a given level of investment (if the ICOR remains unchanged). Secondly, it is possible to identify the required level of investment to achieve a specific level of increased output (again, if the ICOR remains unchanged).
At 2016, the Conference Board 5-year moving average for the UK ICOR is 8.0. This means that an increase in annual output over the medium-term of £1 billion requires an increase in investment of £8 billion. The same ratio applies if the numerator is changed. So, an annual increase in output over the medium-term equivalent to 1% of GDP requires an increase in investment of 8% of GDP.
In the Conference Board Total Economy Database the UK ICOR was not always so high. Prior to the recession that began in 2008, the ICOR fluctuated around 6.0. This would reduce the level of investment required to achieve a given level of increased output, or would increase the level of output arising from a given increase in investment. But it remains to be seen whether there has been a permanent or at least enduring deterioration in the ratio or whether this is a hangover from the slump.
In any event, using the ICOR identified from the Conference Board Database, it is possible to examine the effects of Labour’s commitment to increased public sector investment.
Increased public sector investment
Labour’s economic policy is to borrow only for increased public sector investment. The consequent growth can allow for further increases in investment or increased public spending on services, or some combination of the two.
From the analysis above it is possible to identify the impact of planned investment. Each increase in public sector investment of £8 billion increases the medium-term level of output by £1 billion. Labour’s plan is to increase public sector investment by £25 billion each year compared to current levels. This would directly increase medium-term output by a little over £3 billion each year. There may be indirect or induced positive effects on increasing private sector investment, but these cannot be known or certain in advance.
Over the lifetime of a 5-year parliament the cumulative effect of this increased Investment would be £125 billion. Applying the ICOR ratio of 8.0, this would increase medium-term output by just over £15.6 billion. By using the current level of nominal GDP of a little over £2 trillion (or £2,000 billion), the net effect of Labour’s plans would be to increase GDP over the medium-term by the equivalent of almost 0.8% of GDP.
However, on a reasonable assumption of continued economic growth and therefore expansion in GDP, over the medium term the cumulative effects of investment would be slightly reduced, as GDP will have expanded. So, the effect would be closer to an increase of 0.75% in GDP over a five year period, or 0.15% per annum for the lifetime of the parliament. Using the same ratios, if the policy aim was to achieve a 0.25% increase in GDP per annum this would require the level of planned Investment to rise to £40 billion per annum.
There are two further points worth emphasizing. Up to this point, the subject for discussion has been the medium-term consequences of increased Investment on raising the level of GDP. But the actual expenditure on investment also raises output in the short-run, in the year or years that the Investment is made. The first point is that the immediate effect of increasing public sector investment by £25 billion each year will itself increase GDP by 1.25% each year, in the very short-run. The effect of Labour’s policy will undoubtedly be an important boost to the economy and therefore to living standards.
The second point is that Labour’s economic inheritance will be extremely poor, even on official forecasts. Therefore it may be necessary, within the limits of what is realistically possible to borrow, to increase the planned level of increased public sector investment, simply to stave off a deteriorating economic situation. In that case, further measures may be necessary, not just increased borrowing but also measures to direct investment through existing public sector bodies, the new National Investment Bank and in the private sector itself.


Recent Comments