February 2013

A falling pound will lower the living standards of workers and the poor

.089ZA falling pound will lower the living standards of workers and the poorBy Michael Burke

The British pound has begun to fall once more on the international currency markets. It may be further helped on its way by the loss of the AAA credit rating. This will have important domestic economic consequences.
 
The currency is also being talked down by a number of officials, effectively including both the current governor of the Bank of England and his appointed successor. Their hope is that a weaker pound will boost Britain’s woeful export performance, and perhaps lead to a revival of business investment in the export-oriented sectors of the economy.

A policy of failure

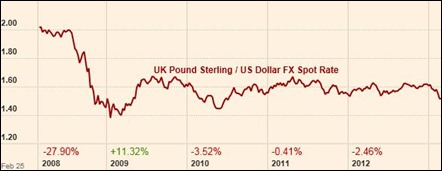
One key problem in pursuing this policy is that it has already happened in the recent past and failed. Between 2008 and 2009 the pound fell by approximately 30% against the US Dollar. Against a basket of currencies (represented by the Sterling Trade-Weighted Index) it fell by over 25%.

Chart 1

13 02 28 Chart 1

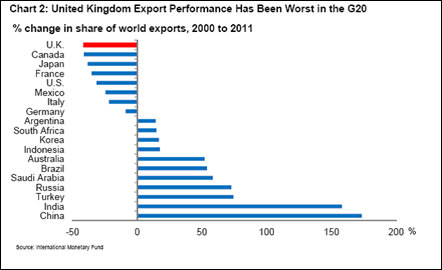
This was effectively a significant devaluation of the pound. Yet even in nominal Sterling terms, exports barely grew. Britain’s share of world export markets actually fell, from 3.5% in 2008 to 3.2% in 2012, continuing a long-term trend.

Chart 2
13 02 28 Chart 2

The effect of the devaluation was to push up the Sterling value of imports. This, combined with Coalition measures such as the increase in VAT and higher charges for transport and domestic fuel bills, pushed inflation higher.
 
Britain was the only major industrialised economy that experienced ‘stagflation’ during the crisis – that is a simultaneous economic decline or stagnation along with accelerating inflation. Using a common measure such as US Dollars for international comparison, the UK became an incredible shrinking economy, the biggest absolute decline of any major economy. Real wages and incomes also shrank dramatically, as the effect of wage freezes and welfare cuts were magnified by sharply rising prices.
 
This ought to be a lesson for all those who argue that a simple exit from the Euro and large devaluation is the remedy for the crisis-hit countries of the EU. Britain is outside the EU and experienced a large devaluation. The sole consequence was higher inflation and lower real incomes.
 
One of the reasons why membership of the Euro remains so popular even in the crisis-hit countries is that repeated devaluations punctuated the preceding decades of those economies- and failed to raise relative living standards.

Currencies and competitiveness 

Currency exchange rates are simply relative prices so that devaluation can reduce the relative price of the same or similar good. But the effects of global competition mean that an improvement in relative price competitiveness will not last if investment levels fail to match competitors.
 
This relative underinvestment is the key structural failing of the British economy. According to recent data from the Office for National Statistics productivity is 16% below the rest of the G7 and has fallen relatively by 10% during the crisis.
 
This has resulted in a structural deficit on the external accounts. The deficit on the current account, which is equivalent to the British economy’s borrowing from the rest of the world, has widened to 3.7% of GDP in the first three quarters of 2012, compared to zero in the depth of the recession.
 
Borrowing is either conducted for consumption or for investment. But as SEB has repeatedly argued, British investment has slumped. It is now just 14% of GDP. This is the cause of the slump in relative productivity, even compared to the rest of the G7, all of which have lower investment now than before the crisis in 2008.
As investment has already fallen therefore the current account deficit can only be corrected by a relative decline in consumption. This runs entirely contrary to the argument for increased consumption to resolve the crisis. But we have already seen that real wages have fallen during the crisis. This has reduced the consumption of most workers and the poor.

Who will pay for investment? 

Fortunately, there is an alternative method of reducing aggregate consumption in order to boost investment. Alongside workers’ wages and investment Marx argued that consumption was divided into necessary consumption and the consumption of luxuries. In this category may be included all items not essential to sustaining well-being, but also all items which have no production capacity. The most important of these is expenditure on armaments.
 
At £777bn the accumulated stock of profits held in cash at British banks is already a multiple of the funds required to restore all the output lost in the recession. At the same time dividend payouts to shareholders are at a record high approaching £79bn in 2012. Managerial and other bonuses (including in the City) are climbing once more. Economically, the renewal of Trident is a huge waste of resources, up to £100bn, as are increased military interventions, with lethal consequences.
 
From these multiple sources there is more than sufficient capital to increase investment and reduce consumption without in any way hurting the real incomes of workers and the poor. On the contrary, improving their living standards is both essential to and the ultimate purpose of socialist economic policy.
The obstacles to this solution are political and social. The purpose of capitalism is to preserve and expand capital, hence its name. Any policy which infringes on, let alone overturns the absolute prerogatives of capital will be resisted fiercely.
 
Instead what is currently on offer is a continuation of the long relative decline of the British economy. To alter fundamentally that path of decline would require a redirection of wasteful spending and idling capital towards investment. Instead, what is planned is a further erosion of the real incomes and consumption of workers and the poor. From that, there may eventually be some modest increase in investment. The decline of Sterling, and the inflationary effect it will produce is part of that project.

Bribing the private sector to invest isn’t working

.525ZBribing the private sector to invest isn’t workingBy Michael Burke

The government’s flagship scheme for promoting investment in infrastructure has been branded a failure. A report in The Times[i] quotes speakers for both the Engineering Employers Federation and the Confederation of British Industry as saying that the scheme is ‘disappointing’ and ‘more needs to be done’.

In July 2012 the government announced the scheme, saying that it would use its balance sheet to support infrastructure investment as the means to revive the economy. Bond holders are willing to lend money to the government but less willing to lend to private capitalists. The government’s scheme was supposed to use this advantage to offer guarantees to the private sector so that they would invest in infrastructure projects. These are increasingly and correctly regarded as a key mechanism to boost growth and employment and to address the British economy’s creaking infrastructure.

However, it is reported that only one project has been agreed, the extension to the Northern Line tube in London, which would have gone ahead without the UK Guarantee.

The government’s inability to promote private infrastructure spending occurs as its own investment continues to be cut. According to the Office for Budget Responsibility, government investment will be cut by nearly 30% in total under current government plans. These may alter in the next Budget in March.

Investment driven by profits

The failure of the government’s policy to deliver any new infrastructure spending is because of an insistence on the failed neoliberal model of the economy. One of the many central and incorrect tenets of neoliberalism is that all ‘economic agents’ are essentially the same. Those economic agents are private firms which maximise revenues and private individuals who maximise their own well-being. Form this is it is argued that government stands in the way of this series of rational choices, by taxing and spending incomes that firms and individuals could better choose how to spend themselves.

This is a concocted world which bears little relationship to reality. Neither firms nor individuals operate in a world of perfect knowledge to inform their expenditure, economies of scale often mean that government can purchase the same goods or services in bulk much cheaper (education, health, transport, banking, etc.) than private firms or individuals can. For large infrastructure projects it is often the case that only government can borrow funds sufficiently cheaply for large-scale investment.

But perhaps the biggest fallacy of all in the neoliberal model is the one in the sphere where it claims the greatest authority, which is the factors governing the behaviour of private firms. Firms don’t seek to maximise revenue at all, as the neoliberals claim. They seek to maximise capital, which normally means to maximise profits. And they don’t face a multitude of competitors each seeking to compete by allocating investment more productively than the next. In the most decisive areas of the economy, banking, cars, aviation, large scale housing, energy production, and so on there are just a handful of firms. They are oligopolies. This means that frequently the way to maximise profits is to increase prices, sometimes reducing supply to do so.

The housing crisis

To take just one example, there is a structural shortage of at least 2 million homes in England and Wales alone, comprised of the numbers of households on waiting lists for housing (1.7 million) and others in grossly substandard accommodation. Yet there were just over 100,000 new homes built in the latest 12 month period. This is slightly less than the growth in the number of households, meaning that the housing shortage is increasing.

Yet the Financial Times recently reports that UK housebuilders are enjoying a ‘state-backed boom’[ii]. The boom is in the share price of the stock market-listed housebuilding firms, up 46% in the last 6 months, based on an unprecedented rise in profits.

These profits arise because the term ‘housebuilder’ is a misnomer. Housing starts are at record lows but, Barratt (one of the biggest firms) has been buying land at its fastest rate ever. These firms are in reality land buyers, who have an incentive in hoarding land, which continues to rise in price and in restricting the supply of new housing for the same reason. According to Noble Francis, economics director and the Construction Products Association, ‘The major housebuilders are not going to double the number of units they build because it’s not in their interest’.

Government subsidies for mortgages simply operate as a price-support mechanism for the housebuilders. This is a ‘state-backed boom’ for capitalists, not for house building.

Dividends versus investment

Just as the large housebuilders have no interest in increasing the number of houses they build as they seek to maximise profits, not revenues, so capitalist firms in general have no incentive to produce without the expectation of profits. Not all firms are as fortunate as the housbuilders to be oligopolistic suppliers to a market where there is already a structural shortage. As a result, the profits of most firms have not risen in the same way.

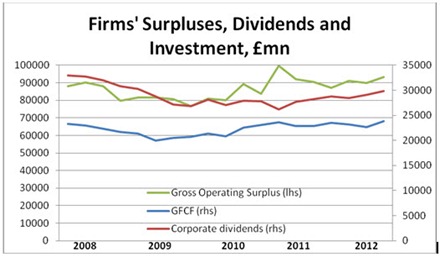
The chart below shows the gross operating surplus of firms (green line, left-hand scale). The gross operating surplus is often described as the profit share of national income and is similar to the Marxist category of surplus value. The chart also shows the level of investment by firms (gross fixed capital formation, blue line right-hand scale) and the level of dividend payments to shareholders (red line, right-hand scale). Together, these two form the overwhelming bulk of the distribution of the surplus. The other main category is interest payments, which have fallen sharply as both interest rates and debt levels have fallen.

Chart 1
13 02 08 Chart 1

In effect, firms can either invest profits or distribute to them in the form of dividends to shareholders. Nominal profits have only just recovered, to £68.2bn in the 3rd quarter of 2012 from £66.6bn in the 1st quarter of 2008. But investment has fallen to £29.8bn, from £33bn. At the same time corporate dividends have increased sharply, from £21.5bn to £25bn.

If we compare the respective low-points for the gross operating surplus, investment and dividends the picture is even more stark. On this measure, the surplus has increased by £11.1bn from its recessionary trough, but investment has increased by just £3.6bn. The bulk of the surplus has gone to shareholders, with dividends increasing by £7.4bn.

Chart 2
13 02 08 Chart 2

Because the increase in the profit share has been minimal, the willingness of firms to invest has been minimal. The purpose of capitalism is to maximise capital which requires generating profits. In the chart above the official measure of the profit rate is shown. Although this official measure from the Office of National Statistics has some shortcomings, these do not invalidate the overall trend described in the data. This shows that the profit rate has recovered from its lows, but is very far from a full recovery. This meagre increase in both the profit share and the profit rate explains the unwillingness of capitalist firms to invest.

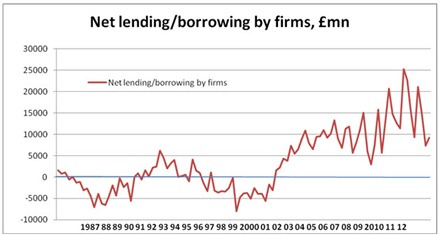
However, unwillingness to invest is not the same as inability. British firms’ refusal to invest and increased payouts to shareholders have also been accompanied by an increase in their net savings as shown in the chart below. In a vigorous capitalist economy where firms borrow to invest. It is a measure of the decrepit nature of British capitalism that over the 25 years, borrowing has been unusual, and corporate savings have been the norm.

Chart 3
13 02 08 Chart 3

As a result of this prolonged bout of savings, the cash balances of British non-financial firms have reached record proportions. At the end of December 2012 there were £777bn in sterling short-term deposits held in UK banks, not including deposits by other banks or public sector bodies. The bulk of these are deposits by firms who are simply hoarding cash.

It is frequently argued that nothing can be done with this cash pile, as it belongs to the private sector. But we are also told the George Osborne has directed that RBS pay its LIBOR scandal-related fines from bonuses. This is simply because a further round of bank bonuses would be massively unpopular.

It is therefore absolutely clear that the government’s 83% stake in RBS means that it can direct bank policy if it chooses. Instead of failed bribes to the private sector to invest, the government could simply direct RBS to lend the funds to the necessary infrastructure projects required to boost growth and jobs. It could lend to local authorities to build council houses and so on. Given that every bank operating in Britain can only do so with the support of a government guarantee for deposits, liquidity support from the Bank of England and other measures. If the government insisted, they would all have to increase lending.

The state can do this because unlike the private sector, it can invest without the requirement to generate profits for shareholders. The policy of bribing the private sector to invest has already failed.


[i] ‘Scheme is no guarantee of reviving the economy’, The Times (£), February 4, http://www.thetimes.co.uk/tto/business/economics/article3676984.ece
[ii] ‘Housebuilders enjoy state-backed boom’, Financial Times (£), January 22, http://www.ft.com/cms/s/0/38a7e488-64ab-11e2-934b-00144feab49a.html#axzz2K8MyzDaq

GDP Data Shows Britain Is the Weakest of All the Large Economies

.579ZGDP Data Shows Britain Is the Weakest of All the Large Economies
By Michael Burke

Britain is only the second large economy to report GDP data for the final quarter of 2012. It showed a contraction of 0.3%. China has already reported its GDP, which accelerated in the 4th quarter – Chinese GDP being 7.9% higher compared to a year ago. In stark contrast there has been no growth in the British economy over the same period, with GDP unchanged from the 4th quarter of 2011.
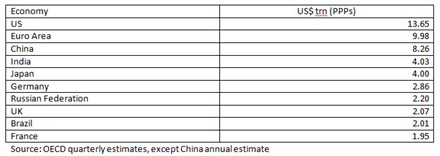
Other leading economies will report the final quarter growth of 2012 by the end of this month. In terms of Purchasing Power Parities (PPPs), the UK economy produces slightly over US$2 trillion. The table below shows economy in relation to other economies of a similar size or greater. The data is based on the most recent OECD estimates of constant PPPs at 2005 prices.

Table 1

13 01 29 Table 1

Where the comparable data is available for these economies to the 3rd quarter of 2013, the British economy has the weakest economy growth over the period. Only the performance of the Euro Area economy was worse, contacting 0.6% from a year ago compared to zero growth in Britain.
Since the global crisis in 2008 the Chinese, Indian and Brazilian economies have all recovered the output lost in the recession and have grown further. GDP in China, India and Brazil is now more than 40%, 30% and 10% higher than at the outset of the crisis respectively.
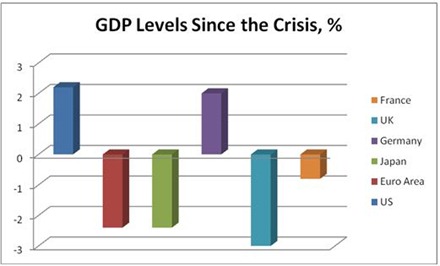
Growth in the other large economies has been slower. The Russian economy has also fully recovered and has grown by a little over 3% since the crisis began. The chart below shows the weaker growth economies since the crisis began at the beginning of 2009. Only the US and German economies have fully recovered at all, a recovery of just 2% above the pre-recession peak. The French economy is still 0.8% below its peak while both the Euro Area and Japanese economies are 2.4% below their peak before the recession began. The performance of the British economy is the worst of all these economies, being 3% below the prior peak. These comparative data do not include the contraction of the British economy in the 4th quarter GDP.

Figure 1

13 02 03 Figure 1

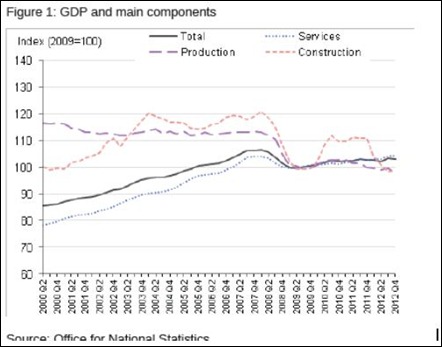
In terms of broad categories of output, the weakness in the British economy is concentrated in manufacturing and construction as the chart below from the Office for national Statistics shows. In fact, even within the services sectors, only two categories of services are higher now than where they were in 2008. These are business and financial services and government services. The former represents the commitment of the government to supporting the finance sector, while the latter represents its inability to cut the total of current government spending while poverty is increasing. This is a broad-based failure of the economy and of economic policy.

Figure 2
13 01 03 Chart 2

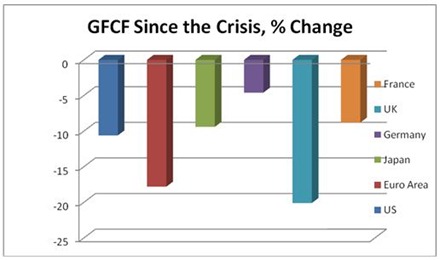
The fall in investment Gross Fixed Capital Formation (GFCF) is the main brake on the recovery output in the OECD countries since the crisis began. In Britain the shortfall (before the 4th quarter data) accounts for more than the entirety of the slump. Among the weaker large economies identified above, Britain has the weakest level of investment since the crisis, down 20.1% since the crisis. Even the crisis-torn Euro Area as a whole is not as weak, down 17.8% although some countries within the Euro Area are much weaker than Britain.

Figure 3
13 02 01 Figure 3

Whatever the outcome of the data for the final quarter of 2012 for the other large economies, to date the British economy has been the weakest of all the large economies. This is driven by the weakness of investment, which accounts for the whole of the slump and which is also the weakest of all those major economies.