.579ZGDP Data Shows Britain Is the Weakest of All the Large Economies
By Michael Burke
Britain is only the second large economy to report GDP data for the final quarter of 2012. It showed a contraction of 0.3%. China has already reported its GDP, which accelerated in the 4th quarter – Chinese GDP being 7.9% higher compared to a year ago. In stark contrast there has been no growth in the British economy over the same period, with GDP unchanged from the 4th quarter of 2011.
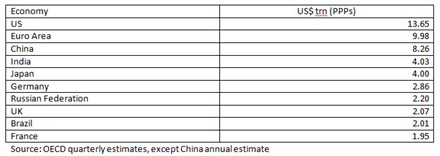
Other leading economies will report the final quarter growth of 2012 by the end of this month. In terms of Purchasing Power Parities (PPPs), the UK economy produces slightly over US$2 trillion. The table below shows economy in relation to other economies of a similar size or greater. The data is based on the most recent OECD estimates of constant PPPs at 2005 prices.
Where the comparable data is available for these economies to the 3rd quarter of 2013, the British economy has the weakest economy growth over the period. Only the performance of the Euro Area economy was worse, contacting 0.6% from a year ago compared to zero growth in Britain.
Since the global crisis in 2008 the Chinese, Indian and Brazilian economies have all recovered the output lost in the recession and have grown further. GDP in China, India and Brazil is now more than 40%, 30% and 10% higher than at the outset of the crisis respectively.
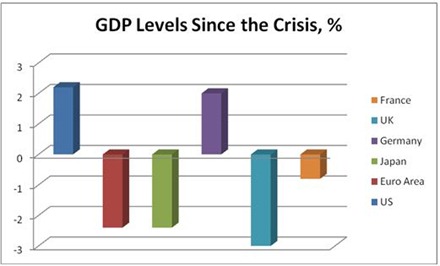
Growth in the other large economies has been slower. The Russian economy has also fully recovered and has grown by a little over 3% since the crisis began. The chart below shows the weaker growth economies since the crisis began at the beginning of 2009. Only the US and German economies have fully recovered at all, a recovery of just 2% above the pre-recession peak. The French economy is still 0.8% below its peak while both the Euro Area and Japanese economies are 2.4% below their peak before the recession began. The performance of the British economy is the worst of all these economies, being 3% below the prior peak. These comparative data do not include the contraction of the British economy in the 4th quarter GDP.
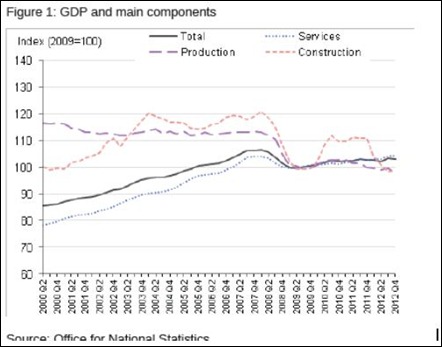
In terms of broad categories of output, the weakness in the British economy is concentrated in manufacturing and construction as the chart below from the Office for national Statistics shows. In fact, even within the services sectors, only two categories of services are higher now than where they were in 2008. These are business and financial services and government services. The former represents the commitment of the government to supporting the finance sector, while the latter represents its inability to cut the total of current government spending while poverty is increasing. This is a broad-based failure of the economy and of economic policy.
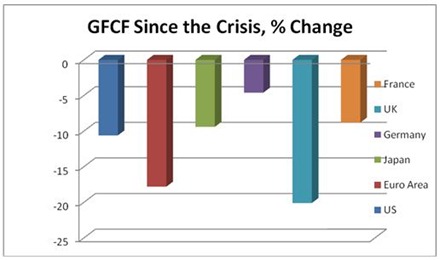
The fall in investment Gross Fixed Capital Formation (GFCF) is the main brake on the recovery output in the OECD countries since the crisis began. In Britain the shortfall (before the 4th quarter data) accounts for more than the entirety of the slump. Among the weaker large economies identified above, Britain has the weakest level of investment since the crisis, down 20.1% since the crisis. Even the crisis-torn Euro Area as a whole is not as weak, down 17.8% although some countries within the Euro Area are much weaker than Britain.
Whatever the outcome of the data for the final quarter of 2012 for the other large economies, to date the British economy has been the weakest of all the large economies. This is driven by the weakness of investment, which accounts for the whole of the slump and which is also the weakest of all those major economies.


Recent Comments