.006ZThe mystery surrounding the ‘productivity puzzle’By Michael Burke
The latest official data show how far the UK economy is lagging behind other industrialised economies in terms of productivity, in this case output per hour worked. There is too a long-standing discussion amongst economists in Britain about the so-called ‘productivity puzzle’. There is a genuine crisis of productivity in Britain. But in reality there is no productivity puzzle at all. It is easily explained by the weakness of investment. In particular, the recent fall in in the stock of capital in the British economy explains the almost unprecedented decline in UK productivity.
Currently, debate in Britain is dominated by the possibility of ‘Brexit’. This is an error. Under current circumstances, whether Britain is in or out of the EU is a trivial matter in economic terms compared to the crisis of productivity. This is because, contrary to George Osborne (and those on the left who are confused and echo him) it is not possible for consumption, or wages to lead economic recovery. Sustainable increases in consumption require sustainable increases in output. Unless that is achieved by more people simply working longer hours, then it must come via increased productivity. Without it, living standards will fall. This will be the case in or out of the EU.
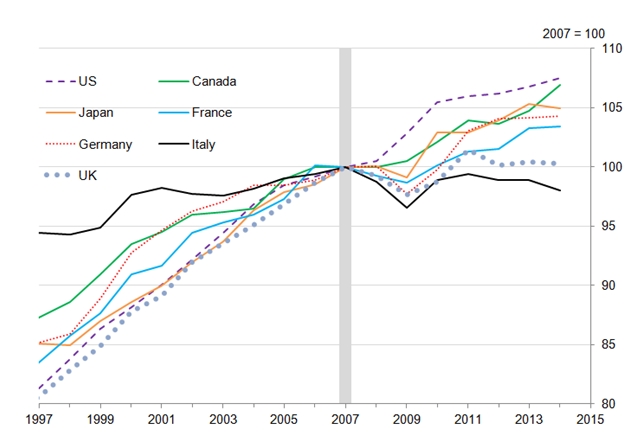
Yet the latest ONS data show that productivity is falling. It also shows how far the UK economy lags behind other industrialised economies. Fig.1 below shows the relative productivity performance of the UK economy versus the other countries of the G7. According to the ONS, UK GDP per hour worked in 2014 was lower than the rest of the G7 average by 18%. Within that, it was lower than both the US and France by 31% and lower than Germany by 36%. The sole G7 economy whose productivity is lower than the UK’s is Japan, which has been stagnating for 25 years.
Fig. 1 Productivity Trends in the G7 Economies
This relative weakness is not confined to most of the G7. According to the ONS, UK productivity also lags that of Spain by 5%, Ireland by 30%, Belgium by 34% and the Netherlands by 45%.
The effects are twofold. If UK productivity is stagnating or falling, so will living standards. If relative productivity is declining the British economy will be less able to sell goods abroad, and its domestic industries will increasingly collapse through under-competitiveness. This is what is currently happening to the steel industry, for example.
The ‘productivity puzzle’
The purpose of all analysis or commentary should be to illuminate what is otherwise hidden or obscure. But economics differs fundamentally from the natural sciences in this key respect. No physicist has an interest in obscuring or denying the fundamental laws of physics, or in basing analysis on anything other than fundamental laws (although there is a strong interest in revising or reassessing them in light of new data).
However, in economics there are vested interests at work, social classes, whose enrichment or otherwise depends on economic outcomes. Therefore there is a very great material incentive to falsify or obscure the fundamental forces at work in the economy. This is why the fall in productivity has been a ‘puzzle’. Analysts and commentators have a false understanding of the fundamental laws of economics and attempt to fit empirical facts such as falling productivity into that false framework.
The official discussion of the crisis in productivity began with the
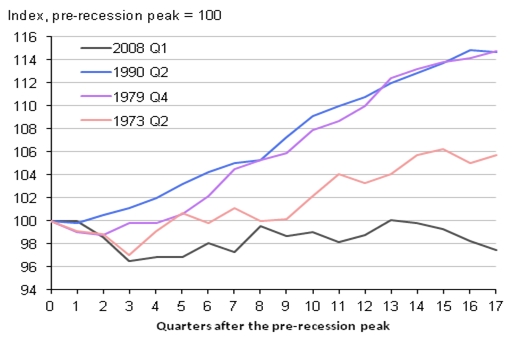
Office of National Statistics (ONS) in 2012 and was later taken up by the Bank of England and many others. The timing was not coincidental as what had been a very weak recovery in productivity started to go into reverse from 2012 onwards. Productivity actually fell. This was by the worst performance for productivity of all recessions in the post-World War II era. It is almost unprecedented coming out of recession as Fig.2 below shows.
Fig.2 Productivity (output per hour) trends following recessions
Source: ONS
The argument has been advanced that the crisis in productivity reflects the changing composition of output, with the decline of relatively high productivity sectors and the increase of low productivity ones. Specifically, it is said that the decline of North Sea oil output, as well as the crisis in financial services have depressed productivity while the allegedly low level of public sector productivity has the same effect. Using ONS data is it easy to refute these claims (Table 1 below).
Table 1
* Workforce jobs figures, benchmarked to Labour Force Survey totals
Source: ONS
North Sea oil output (under Mining & quarrying) is the most productive sector of the economy, with output per hour worked 12 times greater than for the economy as a whole. It fell 7.3% during the recession, slightly more than the economy as a whole (since revised upwards). But as it accounts for just 2.7% of all output, arithmetically it cannot be responsible for the weakness of productivity as whole
The output of the finance sector is a very large component of the British economy, whose measured productivity level is approximately half as great as the economy as a whole. But its output fell slightly less than that of the economy, so its decline cannot be responsible for the productivity crisis.
The public sector is also widely held to be a low productivity sector, although measuring outputs from sectors such as health or education is done at market prices, which almost certainly undervalues them. The output of this sector initially rose during the recession, which is natural to cope with a rising population. But the total economy productivity crisis persisted after the recession and deepened from 2012 onwards. The combined output of the civil service, health and education sectors have all risen since then by a combined 5.4% between 2009 and 2012, according to ONS data. At the same time the public sector workforce has shrunk by 8.9% because of the austerity policy. There has therefore been a significant increase in public sector productivity, outstripping all other sectors of the economy.
The productivity crisis is not caused by the changing composition of output. It is a crisis of the private sector and embraces all sectors.
Much of the confusion on the source of the productivity crisis arises from an incorrect economic framework. One of the clearest expressions of this misunderstanding is as follows:
“Ever since the industrial revolution, economic growth has rested on the firm foundation of better use of buildings and machines and improvements in the level of output for every hour worked.” Chris Giles, Economics Editor of the Financial Times,
Solving the productivity puzzle is key to government financesThis is the view that Total Factor Productivity (TFP) “the better use of building and machinery….” is the driving force behind economic growth. But this proposition is ridiculous when set in this historical context. The driving force behind economic growth is not that better use has been made of buildings and machines since the industrial revolution, but that there have been vastly more buildings, machines and other contributors to the productive capacity of the economy since that time. According to Bank of England data (
Three centuries of economic data) from 1850 to 2000 the accumulation of productive capital has been twice as fast as the growth in output. This is entirely in line with the analysis of Adam Smith and Marx, who respectively argued that the ‘rise in stock’ or the ‘rising organic composition of capital’ exceeds the growth rate of output itself.
It is also not possible to explain the uniquely poor performance of UK productivity by reference to TFP or ‘better use of buildings and machinery’, as in a modern economy businesses based in Britain could simply learn those techniques and/or buy the technology from overseas to make better use of their existing stock of productive capital.
The reason for the calamitous decline in UK productivity is because it has been reducing the existing stock of capital in the economy.
Scrapping productive capacity
It is extremely rare for the level of productive capital to decline. The Bank of England data noted above records only two instances since 1850 in Britain when the capital stock fell, the first two years of World War I and in the Great Depression.
More usually, the capital stock grows. Indeed it is this drive to accumulate capital for the purpose of realising profits that gives capitalism its dynamic force and its capacity to raise the material level of society. However, all capitalist economies are determined by the realisation of profit, not by the accumulation of productive capacity for its own sake, or to raise the material level of society. Profit is the raison d’être. As a result, if profits are declining, or by scrapping unprofitable plant or machinery profits will increase, it is quite usual for productive capacity to be scrapped. Individual firms do this on a continuous basis. In exceptional periods there may be circumstances when capital in aggregate is being scrapped. This characterises the current period (Fig.3).
Fig. 3 UK Capital Stock Index
The close correlation between the trend in capital stock and the level of productivity is shown in Fig.4 below. In fact the level of capital stock leads the productivity level by one year, so that the capital stock first fell in 2011 and the first recorded fall in productivity was in 2012.
Fig. 4 Capital Stock & Productivity
Furthermore, this outright decline in the stock of capital is unique to the UK economy in the G7 currently. Among the economies for which there is data, since 2010 the US capital stock has risen by 4.1%. In Germany it has increasd by 2% and in France by 1.9%. Italy has increased by just 0.6%, and so is effectively unchanged. But in Britain it has fallen by 2.1%.
The relationship between the level of productive capital and the level of productivity is clear across the industrialised economies. If other factors are unchanged, the higher the stock of capital, the greater the level of productivity. This can be illustrated in Fig.5 below, which shows the trends in the capital stock in selected G7 economies.
Fig.5 Trends in Capital Stock in Selected G7 Economies
This is almost a mirror image of the trends in productivity shown in Fig. 1 above. Changes in productivity track changes in the productive forces of the economy, led by the stock of capital. Over this period, the US has both the largest increase in capital stock and the greatest increase in productivity. The UK, which had previously been a relatively strong performer both in terms of the growth in productivity and the growth in capital stock, is now the sole economy shown where both productivity and the capital stock are falling.
Conclusion
There is no mystery around the ‘productivity puzzle’. It is a function of the weakness of UK investment in both absolute and relative terms. The decline in productivity is preceded 1 year by a decline in the capital stock. This declining capital stock is itself an extremely rare event. According to Bank of England data it has only occurred twice previously in Britain since 1850.
The puzzle arises only because there is a mystification of the driving forces behind productivity growth and economic growth in general. In the first instance, after the division of labour, growth is driven by the amount and quality of capital in productive in use in the economy.
In the UK productive capacity is being scrapped. This is not because there is no unsatisfied demand in the UK economy. On the contrary, there is both a scarcity of necessities, such as in housing and healthcare and other areas, as well as a large trade deficit. The productive capacity is being scrapped because its owners cannot make profits, or do not anticipate sufficient profits in a situation of growing competition and sluggish growth in consumption, for example in the steel industry. To survive and prosper, the owners of the UK steel industry would have to leap towards the front of global productivity or technical quality through very large scale investment and they are unwilling or unable to do so.
A reduction in the stock of capital is one way in which capital can overcome declining profitability. Marx identified some of the others as increasing the working day, which is happening in the UK and US but not elsewhere. Other factors which can offset falling profitability are a reduction in the cost of capital goods (the means of production), a reduction of (real) wages, increasing the division of labour through the growth of foreign trade or by boosting profits through increased financial speculation.
Many of these factors are at work in a number of countries. But Britain is the only G7 country where the capital stock is actually falling. The other OECD economies where the capital stock has fallen are Denmark, Greece and Slovenia. It is possible Britain may be a harbinger of more general international trends.
For now though, this weakness puts the British economy in a uniquely vulnerable position in the global slowdown. So it is no exaggeration to say that under current circumstances the need for state-led investment to rescue the economy and living standards from renewed crisis is more acute in Britain than elsehwere in the G7 economies. When John McDonnell says, “our mantra is investment, investment, investment,” this is exactly what is required to stave off renewed economic weakness.


Recent Comments