
By Michael Burke
The ‘mini-Budget’ delivered by Kwarteng and Truss was so devastatingly bad for the British economy and for the key finacial markets that one major international bank ended the day calling for an emergency interest rate rise by the Bank of England!
Of course, this would do nothing to alleviate the economic crisis that underlies this slump, and may be just special pleading by financial speculators. But it is an indicator how far removed this government is from economic reality.
As such they will completely fail to deliver on their stated aim of lifting the long-term growth rate of the economy from abysmally low levels. Instead, they are engaged in fantasy Thatcherism, an effort to Americanise the British economy with a policy of hammering workers and the poor, susbsidising big business and the rich. The are likely do enormous damage before failing.
Numerous commentators have pointed how regressive the government’s measures are, in redistributing upwards for high earners and for owners of capital. This is how the Resolution Foundation explained this reactionary redistribution, shown in Chart 1, saying, “Almost half of the gains from tax cuts next year go to the richest 5% of households. The poorest half get an average of £230 vs £3,090 for richest fifth.” Overall, taking into account all changes to tax and National Insurance, “only those earning over £155,000 will be better off.”
This is just 1.4% of all taxpayers. This is economics of and for the 1%.
Chart 1.
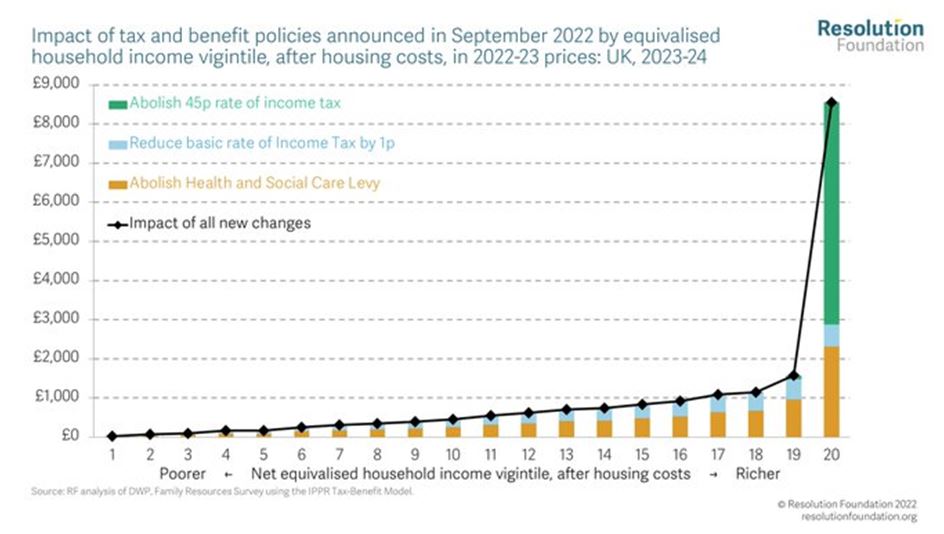
Source: Resolution Foundation
At the same time, there is an enormous tax giveaway for businesses, amounting to tax cuts of just under £70bn in taxes on profits over the next 5 years.
All of these measures are being enacted when the mass of the population is struggling with the deepest crisis of living standards in living memory. The message to workers and the poor, ‘Go to hell!’
A balance of payments crisis
This wilful disregard of the objective reality is not confined to the issue of the impact on households and the cost of living crisis. The mini-Budget simply failed to take account of the key problems of the British economy, which is why the response of financial markets was panic, rather than horror from the population.
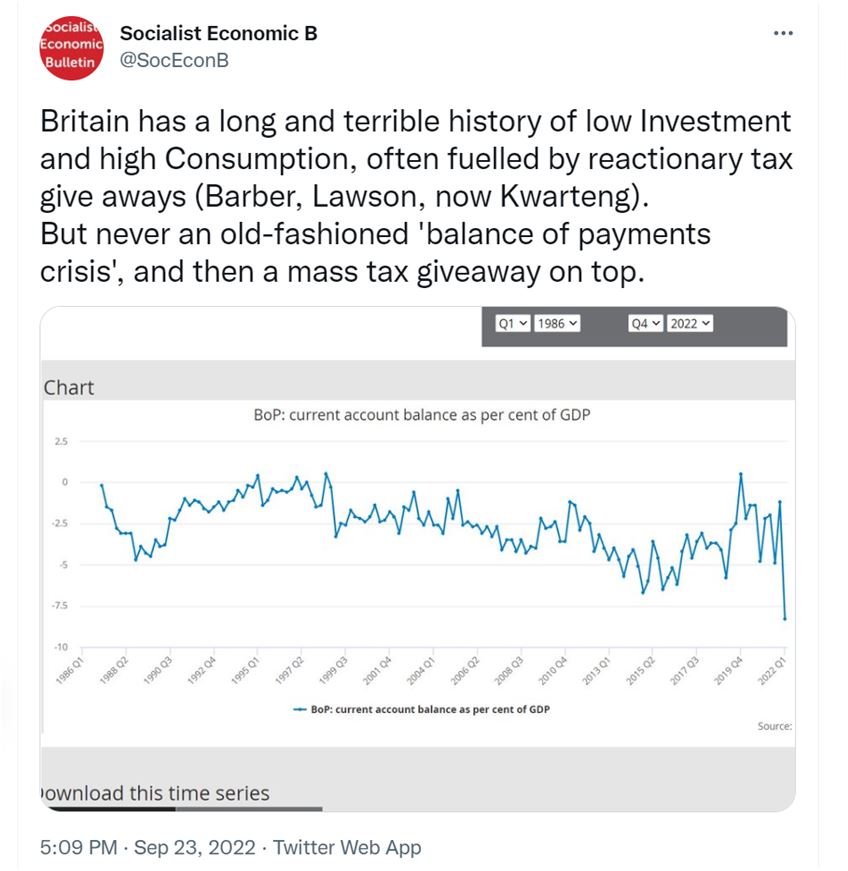
Britain has a long and unhappy history of ‘balance of payments crises’. These reflect the British economy’s chronic lack of Investment, leading to both weak productivity growth and lack of competitiveness.
The catalyst for these long-term trends to turning into an outright crisis of a falling currency and rising interest rates on government (and other debt) has frequently been tax cutting Budgets. These only served to suck in imports further, weaken the pound and make government debt unattractive to overseas investors without offering much higher interest rates. This is what happened in both the Barber and Lawson Booms.
We can now add the name Kwarteng to this rogues’ gallery of Tory Chancellors. However, a key difference with his predecessors is that the current Chancellor implemented the enormous giveaways to business and the rich when there was already an old-fashioned balance of payments crisis under way.
This is how SEB characterised the comparison on Twitter.
The basis for the British economy’s repeated balance of payments crises has the same sources as its weak growth, weak productivity and low wages. This is its chronically weak levels of Investment.
There is too the specific factor of Brexit. But it is not simply a case that Brexit has made it harder to export goods to the EU. It is worse than that, as shown in Table 1.
Table 1. UK Trade Balance in Goods with the EU and non-EU Countries, £bn
| EU | Non-EU | |
| Q1 2022 | -30.2 | -31.0 |
| Q1 2021 | -16.9 | -12.7 |
| Q1 2017 | -24.2 | -11.2 |
Source: ONS
The overall deterioration in the trade performance in goods certainly accounts for more than the overall widening of the current account deficit. The trade deficit has widened significantly. And the UK trade balance with the EU between the 1st quarter of 2017 and the same quarter in 2022 has certainly deteriorated, as shown in Table 1.
However, the widening of the trade gap is more pronounced outside the EU. In addition, UK exports to the EU are slightly higher than they were at the beginning of 2022 than in the same period in 2017, £42 billion versus £39 billion.
But trade is not simply about one country selling a food to another. There are incredibly complex cross-border supply chains that operate particularly in advanced manufacturing. The British economy has been a major importer of these semi-finished goods, as well as a major re-exporter (in European terms) of either finished goods or semi-finished ones, with some value added. There has been a surge in imports of these semi-manufactures from outside the EU without any corresponding rise in exports to the same countries. In effect, it appears as if Brexit has cut out Britain from existing supply chains in Europe, and companies based in this country will have had to replace them with more expensive and/or inferior products.
Naturally, this sharp adjustment in Britain’s place in global supply chains will further depress Business Investment. While virtually all major capitalist economies have experienced a pronounced decline in levels of Investment over decades, the downturn in British Investment has been even greater. This has been a chronic malaise, now made acute ever since the outcome of the referendum in 2016.
Chart 2. Investment (Gross Fixed Capital Formation)as a % of GDP in the EU, US and UK since 1970.
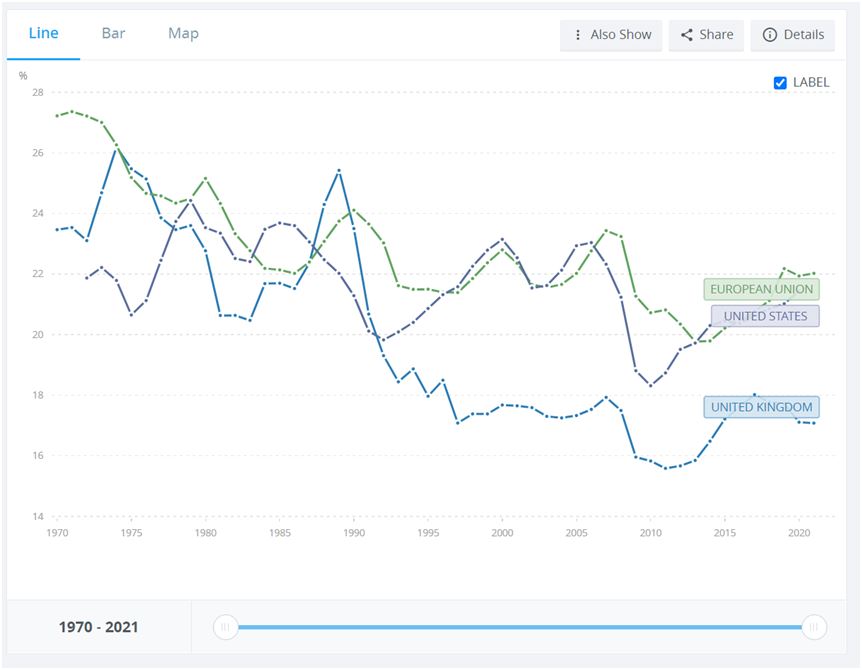
Source: World Bank
Why have they done it?
Clearly this government is not primarily concerned with courting popularity, unlike Johnson, Cameron or even Thatcher who lied about their intentions. Nor have they taken much account of the likely response in financial markets, where a falling pound will add to inflation and rising interest rates will deepen the downturn.
As a result, in deepening the structural failings of the British economy they have created additional problems for themselves politically. So, why do it?
The economic policy is not irrational if the scale and character of the British economic crisis is grasped. A key aspect of this is shown in Chart 3 below.
Chart 3. UK Net Capital Stock and its Components 1996 to 2020.
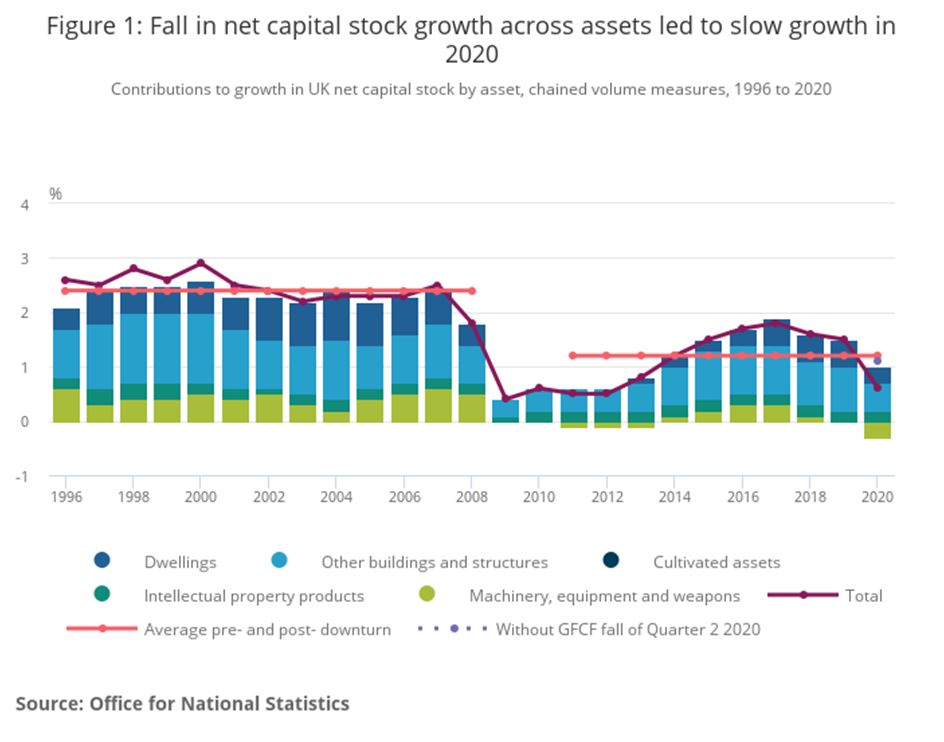
The net capital stock is the product of Investment in the economy once depreciation and dilapidation are taken into account. It is the means of production. Prior to the Global Financial Crisis in 2007 to 2008 the average annual growth rate for the net capital stock had settled at around 2.4%. In the business cycle since, which is probably ending now, the growth rate of the net capital stock has halved to 1.2%.
It is not coincidental that the net capital stock in both instances is closely related to the real growth rate of the economy over the business cycle, as net investment is the primary determinant of growth.
As we know, Investment has since fallen, led by Business Investment which was 12% lower in 2021 than in 2019. This comes close to an absolute crisis for the British economy and especially for its business sector.
The ‘mini-Budget’ shows that the health of the business sector is clearly the most important priority for this government. The Truss/Kwarteng government differs from its predecessors by stripping way any pretence otherwise. For any government an Investment strike by its business sector would be a matter of grave concern. For this government it is a catastrophe.
Their agenda is to boost the returns to private capital by cutting taxes, cutting wages, deregulation, outsourcing and privatisation. The problem is that this Thatcherite solution does not work. It did not work under Thatcher and will not work by repeating it in much worse conditions.
As Chart 4 below shows, Thatcher’s policies benefitted from enormous N Sea oil revenues almost from the moment she entered Number 10 Downing, peaking at 3.4% of GDP in 1984-85.
Chart 4. North Sea Oil Revenues
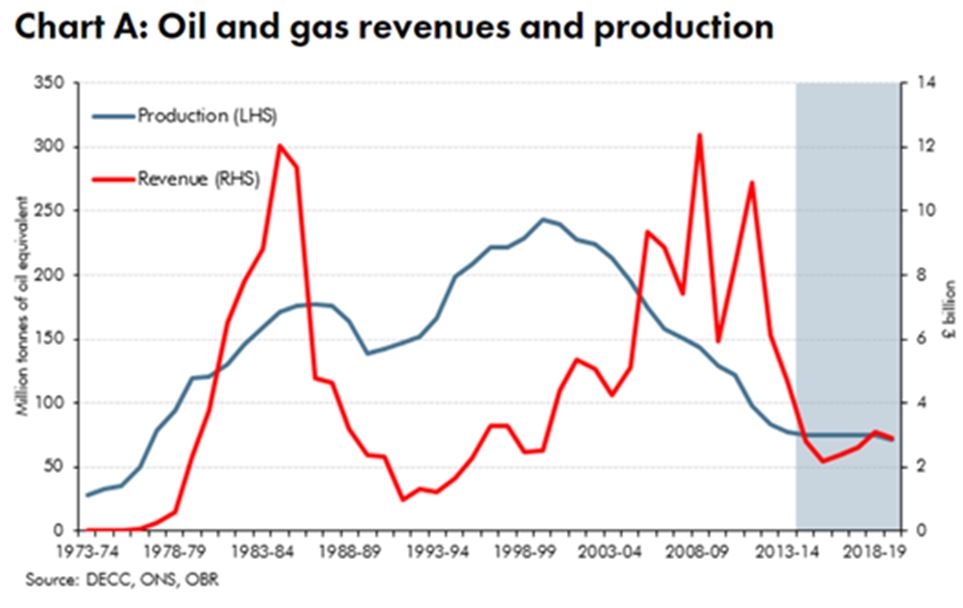
Source: OBR
This was an enormous windfall. But the policy response was tax cuts and privatisation, even including the main company benefitting directly from the oil bonanza, BP! These tax cuts eventually led to an unsustainable boom (the ‘Lawson boom’) which ended with a crash. But the dominant trends of the Thatcher period were economic slump and mass unemployment. The official unemployment total stayed close to 3 million people for 6 years.
The weakness of the economy is highlighted in the chart below.
Chart 5. UK Real GDP Growth Under Thatcher, excluding North Sea Oil revenues, % change
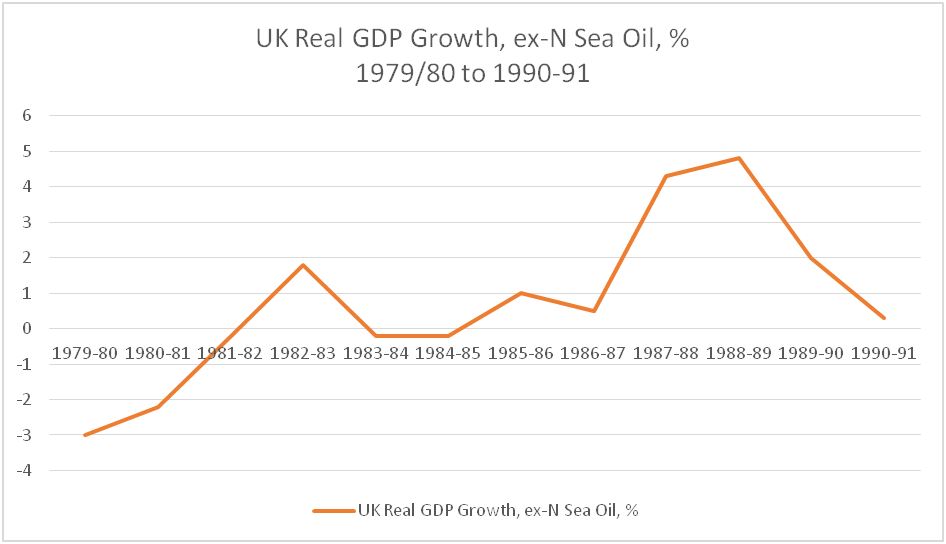
Source: OBR, ONS data, author’s calculation
Excluding the surge in N Sea oil revenues the economy grew by just 12% over the entire period, making it the weakest period of growth of this length over the entire era since the end of World War II. There was also no net asset creation, as there has been with Norway’s Sovereign Wealth Fund. The revenues were simply frittered away in tax cuts.
These are the policies now being emulated by this government. And it should be stressed that their own, self-made inheritance is far worse on all key economic indicators than Thatcher operated under in 1979.
This government has taken the view that it is impossible to disguise the scale of the attacks that are coming, even with the help of the British media, so they are not going to try.
Instead, they have staked out ground that claims they have the answers to the economic crisis. They will then dare other social forces, most notably the unions, and the opposition, to formulate an alternative. That is the next major challenge.

Recent Comments