Four important graphics from the OBRBy Michael Burke
The latest publication from the Office for Budget Responsibility (OBR) is a strange document. It is a Forecast Evaluation Report which examines its series of completely wrong forecasts since it was established. Its firm assessment of these wildly over-optimistic forecasts is that it is not because it underestimated the impact of austerity, but then provides no other explanation for its consistent errors.
Despite this the OBR does provide some useful data on the economy and presents them in a very useful way. Below are a number of graphics taken from the latest publication.
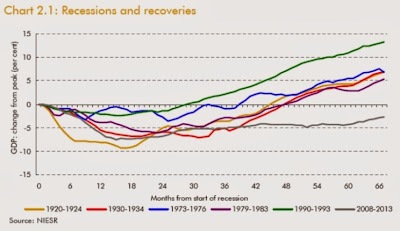
Chart 2.1 (from the NIESR) shows the latest slump in historical context. The British economy is still 3.3% below its previous peak. In every other recession the lost output had been recovered after no more than 4 years. The current slump s already more than 5 years old.
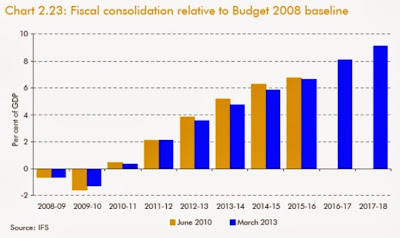
Chart 2.23 shows how much further ‘fiscal tightening’ (combined spending cuts and tax increases) has been implemented and how much is still to come. The Fiscal Year 2012/2013 ended in April this year. By FY 2017/18 the fiscal tightening will be more than 3 times as great as the fiscal tightening already completed. If these plans are implemented, either by the Tories or by Labour, the next government will be implementing austerity measures twice as severe as anything seen to date.
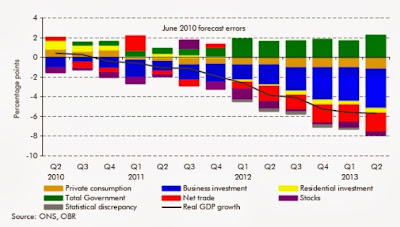
The key problem for the whole economy remains one of contracting investment. In Table 2.1 the OBR shows that in the latest data business investment is the only component of GDP which has been negative. It also overwhelmingly accounts for the shortfall in growth relative to the OBR’s own forecast, 4% of total shortfall of 5.7%.
This is illustrated graphically the chart below, which highlights the components of growth relative to OBR forecasts. It is clear that business investment (blue) accounts for the bulk of the shortfall, with most of the remainder accounted by the shortfall in net trade (red). This is related to the fall in investment and the declining international competitiveness of the British economy.
What the OBR calls ‘Total Government’ has been the prop for the economy over the entire period compared to its own forecasts. But in reality there is no such thing as Total Government in terms of economic activity. The activity of Government, like every other economic agent can only either be consumption or investment.
SEB has previously shown that the government is increasing its consumption while cutting its investment. This is leading an economy-wide rise in consumption and an economy-wide decline investment.
Exceptionally weak growth caused the lack of business investment, a recent increase in government consumption combined with continued reductions in its own investment and the threat of much greater austerity to come; these are the prevailing trends in the British economy.


Recent Comments