This week the British government Education Secretary held up
Denmark as the model the UK would follow in re-opening schools. This is to copy Denmark (if that is what is
actually planned) rather than learn from it.
Norway and Denmark have very similar population levels (5.4
million and 5.8million respectively).
They experienced their first cases of Covid-19 at approximately the same
time and followed a broadly similar trajectory in terms of the spread of the
virus.
In European terms they are among the better performing
countries, with deaths per million of 44.2 per million for Norway and
91.2million for Denmark, compared to Germany 93.5, or now Italy 514.5 and the
UK 495.1.However, on April 15 Denmark decided to begin re-opening the schools,
having been one of the first to close them on March 12.
Since that time the spread of the virus has been more
pronounced in Denmark than Norway.
Cumulative cases for Norway and Denmark
The FT chart above shows Norway and Denmark had comparable
trajectories and almost exactly the same total number of cases at April 15,
just under 6,700 cases. Since that time,
Norwegian cases have risen to 8,142 and Danish cases have risen to 10,675.
Following the return to school in Denmark about 1 month ago
cases have risen by just under 60% while Norwegian cases have risen by
21%. Danish cases have risen almost 3
times in proportion. Of course, other factors may be at work. But the timing and correlation are striking.
Gavin Williamson says that the government is following the
Danish approach in re-opening the schools.
Re-opening schools now would be the wrong lesson to draw.
The global coronavirus crisis is a
public health catastrophe with extremely severe social and economic
consequences. But the driver of those consequences is the coronavirus itself. Therefore
all attempts to prioritise the impact on the economy – as most of the Western
governments have done – are bound to lead to a prolonged catastrophe. This will
involve, and is already causing, a far greater and avoidable death toll and a
much more severe economic and social crisis as a result.
The Western governments have effectively
put ‘the economy’, that is the profits of firms first, before the well-being of
the population. We will all be affected by the profound consequences for many
years to come.
Herd immunity as policy
Infamously, the principal adviser to
Boris Johnson told a private gathering that the government’s policy was “herd immunity, protect the economy and
if that means some pensioners die, too bad” (£). Although
this was later denied, a recent article on Reuters
news agency, makes it absolutely clear that this was in fact official
government policy. On March 2nd the government was told that,
without a lockdown and the many other measures pursued in China, there could be
around 500,000 deaths in this country. Yet Boris Johnson did not announce what
was initially described as a ‘severe lockdown’ until three weeks later on March
23rd. Meanwhile both Johnson and the chief scientific adviser had
publicly promoted the idea of herd immunity as government strategy, which
Johnson himself described as ‘taking it on the chin’ (video).
The UK
experience is not unique. The Trump administration pursued the same strategy
and only did a U-turn on its rhetoric at the same time as the British
government in the third week of March. To differing degrees most Western
governments have pursued similar strategies.
It
should be clear that in the US and British cases the policy change is mainly
rhetorical. There is a very partial lockdown in Britain, with many
non-essential workers still obliged to travel to work, no mass testing, limited
PPE for medical workers, social care workers and many others, and no tracking
and tracing (which is impossible without mass testing). In the US, the partial
lockdown is even more lax, although the US has proved adept at international
piracy in forcing PPE to be redirected, even at the expense of ‘allies’.
Many
other Western government have pursued a less extreme version of the same
policy, which has led Britain and the US to become world leaders in the growth
of the coronavirus infection rate, as this chart from the Financial Times
shows.
Chart 1. Death rates from coronavirus (log scale)
Sweden has
frequently been held up by right-wing commentators as the model
because it has almost no lockdown at all (except in higher education). But the
performance of Sweden is disastrous. To give one example, Sweden and Norway
(with half the population) recorded their first known cases at approximately
the same time. Norway’s death toll stands at 127 in the latest WHO situation
report (number 86), while Sweden’s death toll is unfortunately
much higher at 1,033.
In general, the Western countries have
pursued a half-way house between ‘herd immunity’ and an effective lockdown. The
verdict is clear. In the 5 largest Western European countries (Spain, Italy
Germany, France and Britain) the most recent daily reported total was just
under 20,000 new cases and just under 3,000 reported new deaths. In the US
alone there were over 24,000 cases and over 1,500 new fatalities.
Other
countries, such as Germany have had some important success because of mass
testing and tracking and tracing. But because all measures are necessary, partial
measures will fail. The WHO described it as a ‘whole of government, whole of
society’ response in China which required a severe lockdown in Hubei province. Germany’s
testing has been excellent compared to Britain, but its lockdown has been lax
compared to China. In the latest WHO report the German case load had risen to 1,537 per
million, and deaths had risen to 39.2 per million. The
comparable data for China is 61 cases per million and 2.4 deaths per million.
Yet another
bank bailout
It is
clear that the Western governments in general attempted to put the economy
first in their response to coronavirus crisis. The unavoidable consequence of
that policy was as Dominic Cummings put it, ‘if some old people die, too bad’. It
should be noted that this is a propaganda line the
BBC is still pursuing, arguing that many people would have died anyway.
The
various ‘bailout’ packages should be seen in this light. They do not stand in
contradiction to the blatant disregard for the well-being of the population but
are an extension of it.
In
Britain, the March Budget contained just £5bn in spending measures to offset
the effects of coronavirus. This is a fraction of the structural underfunding
of the NHS (about 1.6% of GDP compared to Germany, equivalent to £35bn annually).
As explained previously by SEB, the Budget’s big
increase in government spending for next year is Brexit-related, not to tackle
the health catastrophe.
As for
the follow-up package of measures from the Chancellor, the numbers themselves
determine the character of the bailout. Of a total of £350bn in the package,
£330bn is a bank loan guarantee scheme. This prevent banks from incurring losses
if the loans go bad, although does not oblige them to lend, or even limit the
rate of interest they can command. It is a bank rescue package. By contrast,
local authorities which have to deal with additional spending on homelessness, free
school meals, support for the elderly and so on, have been provided with just
£1.6bn, or about £24 for every person in the country.
The
idea that the Tories are ‘implementing half the Labour manifesto’ is completely
muddle-headed. Austerity is the transfer of incomes and assets from workers and
the poor to big business and the rich. It should be clear that the Chancellor’s
measures are more of the same. The cost of the bailout will be borne by
taxpayers, and most tax revenue is either in the form of income tax on the pay
of workers and the poor, or on their consumption, through VAT. This is not
partially implementing Corbynism. Corbyn would have implemented the opposite
policy.
The
claims for the Trump bailout measures (incorrectly labelled a ‘stimulus package’)
are just as frequently false. Of the $2trillion bailout, just $250bn is
earmarked for households. The overwhelming bulk is direct subsidies for
businesses and banks. The widely touted transfer of $1,200 for adults earning
less than $75,000 a year is meant to cover them for 3 months! Many will wait
months more to receive it. Undocumented workers, the unemployed, those without
unemployment insurance and many young workers are not covered at all. The
actual beneficiaries of the Trump bailout are big businesses and the banks.
It’s not the
economy, stupid
It is
impossible to deal with the huge economic and social consequences of the
coronavirus crisis without dealing directly with the coronavirus crisis itself.
Measures to ameliorate hardship and prevent unemployment surging and business closures
are absolutely necessary and the Western governments have generally failed to
provide these in sufficient amounts, or with the appropriate priorities.
But the
economic crisis cannot end until the source of it is ended, which is the public
health crisis.
Ignoring
this fact has led big business, their lobbyists and friendly commentators to
raise the clamour for an early end to the lockdown. But simple logic dictates
that this will end ignominiously, if not catastrophically. The lockdowns are
the product of the correct view that disrupting physical interaction is
necessary to introduce a series of breaks into the pattern of virus spreading. The
more comprehensive the lockdown, the quicker the spread of the virus is halted,
and vice versa. The experience of China is positive confirmation of that, while
the experience of Britain and the US is the negative confirmation.
Therefore,
any premature ending of (even a partial) lockdown will risk a renewed spread of
the virus, especially if there is also no mass testing, tracking and tracing,
and quarantining of the new cases.
As the
bulk of the population that can has acted on government social isolation advice
and has accepted this logic, it is necessary for the big business interests
that want an early end to the lockdown to propose a new argument. This has come
in the form of the claim that ‘the lockdown is worse than the virus’.
Of
course, the lockdown is worse than the virus for the resumption of production
and profits. But the claim that the lockdown is worse for public health, in
terms of mental health, suicide, poverty-related disease is false.
A book
by economics Nobel laureate Angus Deaton,, Deaths and Despair and the Future of Capitalism,’ (webinar link here) is based on studies
of countries such as Greece and Spain during and after the economic crisis that
began in 2008. He concludes that it is not recessions themselves which reduce
longevity, but austerity. Some factors, such as mental health, suicide and the
increase in poverty do increase mortality rates. But other factors, such as
reduced vehicle accidents, lower alcohol and drug-related accidents and lower
accidents at work (especially construction) are significantly greater effects
in the opposite direction.
The
argument that we need to get back to work for public health reasons is dangerously
false.
Economic
outlook
Even
so, the global economic outlook is catastrophic, the negative impact on the
global economy certainly worse than was experienced in 2008-09. Within that it
is clear that:
In the Western
economies black people, ethnic and other minorities are disproportionately hit,
along with poorer people and that they are also bearing the brunt of the death
toll among essential workers
There is a
potential catastrophe on an even greater scale among the developing economies,
whose capacity for lockdowns and social isolation is limited by objective
social conditions and where health care systems are often rudimentary
International
and national bodies are obliged to provide forecasts of the economic outcome of
the current crisis and are now doing so. But these must be purely speculative,
since the economic crisis is caused by the public health crisis and can only be
ended once the outbreak is fully brought under control.
Therefore,
the forecasts from the IMF World Economic Outlook shown in Chart 2 below are
even more uncertain than usual.
Chart 2. IMF Real GDP Growth Projections April 2020
These
are unprecedented levels of contraction for the world economy as a whole. As a
result, even if there is an early end to the public health crisis the
consequences of such an enormous contraction in output would be felt for many
years to come.
Short-term
indicators tend to be even more severe. In the US, electricity usage is currently
down about 17% down from a year ago and the FT reports
British energy usage contracting by around the same proportion. One of the most
negative indicators is the impact on employment. In the first 4 weeks of the
very partial US lockdown, there were 22 million new
claims for unemployment insurance even though these only include those workers
eligible for unemployment insurance. In Britain, the indicators show that the
impact on jobs is also severe. The REC survey points to an immediate
contraction in jobs of 3% of total employment. This is equivalent to an
immediate loss of 1 million jobs.
Chart 3. REC Jobs Survey versus Labour Force Survey
Employment Growth
The truth is that it is impossible to
provide any reliable forecast because the starting point for that must be
ending the coronavirus itself. Unless and until that is achieved, the economy
will continue to contract and unemployment will continue to rise. It is also
highly doubtful that there will be a sharp ‘V-shaped recovery. But SEB
will return to that point in a later piece.
Three points of confusion
At a time of crisis there is a natural
and inevitable tendency to cling to old truisms. Unfortunately, the truisms can
be wrong and in some cases are a cause of the crisis. Three points of confusion
have arisen in particular that are worth refuting, because they are quite
widespread (even though there are many others).
‘Preserving the economy’. The assertions of
Western governments should not be taken at face value when they say that they
are also trying to protect the economy, while trying to save lives. If they
were trying to save lives they would have followed the Chinese approach and the
result would have been deaths in the hundreds, rather than the tens of
thousands. But it is also mistaken to believe their assertions on the economy. Their
economic aim is to preserve profits. This can be demonstrated through the
experience of austerity, which was not generally imposed until 2010, when there
was generally already a recovery under way after the recession in 2008/09. It
was widely understood (including by those who implemented it) that austerity
would hurt growth simply by reducing government expenditures alone. But its
purpose was to transfer incomes to big business and the rich, not economic
growth. The key variable targeted by Western economic policy, never stated, is
profits not GDP.
‘Austerity is ended’. As shown previously, the
bailout packages launched by the Western government are primarily aimed at
supporting banks and big business (the key extractors of profits). The bailouts
range between inadequate and non-existent for everyone else. The most marginal
workers get next to nothing. This is all from the first pages of the austerity
playbook. After the bank bailout comes the austerity, and the British
Chancellor has already begun to hint at renewed austerity. It is highly likely,
for example that there will be reductions in pensions, renewed pay freezes, a
prolonged much higher level of unemployment. Under these circumstances it would
be no surprise if many businesses will try to make the temporary cut to 80% of
wages permanent.
‘This is our 1945 moment’. Unfortunately,
among the Western left, and especially in Britain there is a widespread myth
that the enormous sacrifices and hardships of World War 2 inevitably lead to a
much better conditions in its aftermath. But this was not true after World War
1 and nor was it true at a more prosaic level in 2008-09. It was the
international defeat of fascism beginning at Stalingrad in 1943 which led to
global upsurge in the fight against reaction. In Western Europe this was
manifest as the ‘1945 moment’ of the introduction of the ‘welfare state’,
decent health care, unemployment insurance and so on. 1945-style gains will not
be handed to any working class coming out of this crisis. On the contrary, it
will require huge international victories, relying on international allies to
achieve those gains.
SEB will return to these aspects of the crisis in
future postings, to develop these points and highlight the dangers of the
current crisis and the working class response.
Immediate action needed
But
there is an immediate crisis, where thousands of people continue to die daily. It
is possible that the failure of the Western governments could lead to an even
more enormous loss of life in some Latin American, Africa and the poorer Asian
economies.
Thankfully,
the number of deaths in developing countries is currently much more limited
than in the Western epicentres. But there are no guarantees that will remain
the case and the consequences could be calamitous.
Therefore,
in terms of the principles it is clear that public health must be the priority,
not private profit. The first demands must be international in scope; we need
to learn from where the actions worked and China holds first place in that. There
must also be full debt forgiveness for every developing economy which begins to
experience a serious outbreak (perhaps defined as more than 1 death per
million) in addition to the foreign aid budget being increased and redirected to
cope with increased health and social requirements.
In
the Western countries themselves, the epicentres of the outbreak, full
lockdowns are required and so all non-essential workers must be ordered to stay
home on no less than their current pay if they are on average incomes or below.
Full PPE must be provided for all essential workers. Persistent, mass testing
must be conducted, along with tracking and tracing in line with WHO guidelines.
There must be no racist scapegoating, no Sinophobia or attacks on faith
communities, as well as acceptance of refugees and an end to all immigration
detention. The elderly and the disabled must not be regarded as second-class or
even expendable.
When
the appropriate time comes, as new fatalities fall into single figures, a
controlled and monitored easing of the lockdown can begin, but only if mass
testing, tracking and tracing capacity is already in place. No worker should be
forced to return to work until the crisis is ended.
These
and other demands can be formulated to try to unify all those who want to put
people first in combatting the crisis. The next piece on SEB will deal
with these demands more concretely.
Through tremendous sacrifices China has brought the coronavirus under control – the number of new daily cases being reduced from the peak of 3,887 on February 5 to 11 on March 13 (7 imported from outside China), a decline of 98.2 percent. In doing so, the Chinese authorities performed an enormous service not only to the Chinese people but also gave a crucial opportunity to the whole rest of the world to prepare.
To precise, through the determined fight against the virus, China bought almost two months warning to the rest of the world before the coronavirus began to significantly spread there. But the terrible truth is that while China benefited greatly from determined action against the virus, the facts show the West entirely wasted this precious time.
Because the huge economic effect of the coronavirus cannot be separated from its medical impact, it is necessary to study the two together. This is due to the fact that the coronavirus is simultaneously a supply and demand side economic shock. The supply side shock is that the health risk means the work force cannot produce normally, causing huge falls in output. The demand side effect is that significant numbers of services and goods, if they are not consumed in the short term, will not be purchased at all – particularly in the service sector. The falls in China’s official manufacturing PMI, to 35.7 in February, and the non-manufacturing PMI to 29.6, reflected this impact within China.
The facts show clearly that the spread of the virus in the West is now already reaching levels far higher than at the worst point of the crisis in China. As will be demonstrated, nothing short of a disaster is now unfolding in Europe. The situation in the U.S., so far, is following Europe with a delay of about 10 days.
This fact that the intensity of the coronavirus crisis in Europe is already worse than at the worst period of the virus in China is concealed by misleading comparisons of the absolute number of cases in Europe compared to China. But, for example, China’s population is 17 times larger than Germany or 23 times larger than Italy. To realistically measure the relative impact of the coronavirus crisis in Europe compared to China, it is necessary to measure the virus’s spread in proportion to population.
The peak day for the number of new virus infections in China was February 5 at 3,887. But according to the World Health Organization’s daily situation reports, at the time of writing the peak day in France (780 on March 13) was equivalent to over 16,000 relative to China’s population, in Spain (1,266 on March 13) over 38,000, and in Italy (2,651 on March 12) over 60,000.
Western governments are openly telling their populations that it is only a matter of time before the number of deaths becomes very high. British Prime Minister Johnson announced: ‘Many more families, are going to lose loved ones before their time.’ Italy’s cumulative death toll (1,400 as of March 14) would be equivalent to around 33,000 in a country with China’s population!
This data makes clear Europe’s situation is already far worse than at the worst period in China. In short, the European governments totally failed to use the time they had to prepare for the virus to arrive.
The virus’s huge economic impact in the West follows from this medical disaster. Data on the impact on production of the virus in the West is not yet available. But the Western economies were already weakening when the coronavirus hit. The peak of the current U.S. and EU business cycles was in the second quarter of 2018. From then until the fourth quarter of 2018, the U.S. GDP growth had fallen from 3.2 percent to 2.3 percent, and the EU’s from 2.5 percent to 1.2 percent. Without an extraordinary stroke of luck the virus hitting already slowing Western economies will push them into recession.
As Western companies had already accumulated very large debts any resulting revenue slowdown, creating difficulty to repay this debt, carries a risk of transmission of crisis into credit and other markets.
This explains the literally unprecedented impact on Western share markets. The fall of U.S. share prices into a bear market, a 20 percent fall, took only 16 days – even more rapid than in 1929.
Why, when China has been getting the virus under control, has there been such a catastrophic failure in the West? The reason is in large part because instead of learning the positive lessons of China’s ability to control the virus, the Western media and the U.S. government engaged in anti-China propaganda. The bitter truth is that the anti-China propaganda campaign has to some extent contributed to the West being negligent to the looming crisis and they are now facing a medical, human and economic disaster.
The coronavirus is literally a life and death issue for
millions of people – this is why it is totally dominating mass attention and
the media. It has also simultaneously produced a gigantic global economic shock.
It is impossible to separate these two issues because the coronavirus’s impact
on the global economy depends on whether it can be brought under control and
how fast.
It is crucial to understand that we are only seeing the
beginning of this crisis – the coronavirus’s impact is only going to deepen in
the West. This is due to the fact that the coronavirus crisis in Europe and the
US is now far worse than at the worst period in China and so far is continuing
to worsen. Indeed, the failure of the capitalist countries to control the virus
has produced a disaster – the only question is whether it will now worsen to
create a catastrophe.
Taking first the least important of the two aspects of
health and the economy, the economic one, the coronavirus is unusual in being
simultaneously a supply side and a demand side shock. The supply side shock is
that the health risk means the work force cannot produce normally, causing huge
falls in output. The demand side effect is that significant numbers of services
and goods, if they are not consumed in the short term, will not be purchased at
all – people will not travel to work twice to make up for when they did not go
to work, they will not have twice as many meals in restaurants etc.
This was reflected in the huge falls in output in China in
January-February, as the country basically shut down its economy to the level
necessary to contain the spread of the virus, and to safeguard China’s people
from it. The decline of China’s industrial production compared to the year
before of 13.5% in January-February, the fall of 20.5% in retail sales, and the
25.5% fall in fixed asset investment showed this impact.
But China’s drastic economic action was entirely justified in
the more important human terms as the coronavirus was decisively brought under
control. In only five weeks and two days from the peak level of daily
infections, that is between 5 February and 13 March, the number of daily new
cases in China was reduced from 3,887 to 8 – that is by 99.8%. This shows that
decisive action, giving a total priority to safeguarding people’s health, can control
the virus.
By 15 March only 0.006% of China’s population had been
infected with coronavirus. This rapid reduction of the spread of the coronavirus,
in a matter of weeks, and with only a very small part of the population
infected, is in total contrast to the British government projecting that the
outbreak may last for very many months to the end of the year, that people over
the age of 70 must prepare for four months of self-isolation, and that 60% of
the population need to become infected to achieve ‘herd immunity.’
The coronavirus situation in the West is far worse than in China
But the economic impact in the West, seen immediately in the
huge stock market falls but which will rapidly spread into the productive
economy, was not due to China’s coronavirus situation but to the coronavirus
situation in the West – which is now far worse than anything seen in the worst
period in China.
That the global economic impact is being driven by the coronavirus
crisis in the West, not in China, is clearly shown by the fact that during
January-February, the worst coronavirus period in China, US stock markets were
still soaring – the Dow Jones Industrial
Average’s all-time peak was on 12 February when the coronavirus was raging in
China with 2,015 new cases that day. The recent most severe Western stock
market fall in contrast, on 9 March, came when the coronavirus was coming under
control in China – the number of new cases in China on that day was only 40.
In terms of the global situation, sharp declines in the
number of new coronavirus cases in China confirm that the coronavirus outbreak
there, while not over, was decisively being brought under control. Therefore,
production and supply chains both in China, and from China to the global
economy, would begin to improve.
But despite the sharp improvement of the situation in China the
huge fall in the Western stock markets was entirely rational because they
reflected a correct understanding that the place the coronavirus is presently out
of control is not China but in the West. Indeed, it is crucial to factually understand
that the speed of spread of the virus in key Western countries is now very much
faster than at the worst period in China. This reality is merely obscured by
making comparisons in terms of the absolute number of cases, because China’s
population is so much larger than any capitalist country except India.
For example, attempts have been made to hold up success in
South Korea in controlling the virus as equivalent to China’s. But this is factually
not nearly the case. Mainland China’s worst day for the number of new
laboratory confirmed coronavirus cases was on 5 February at 3,887. The worst
day in South Korea was on 29 April at 813. But to assess the relative impact of
the coronavirus on a country this comparison in terms of absolute numbers is
highly misleading for the simple reason that Mainland China’s population is more
than 27 times that of South Korea. Therefore 813 cases in South Korea, in
proportion to its population, is equivalent to 21,993 in Mainland China. The
relative size of the peak number of new cases in South Korea was more than five
and a half times as high as in China. Furthermore, by 15 March there were still
76 new cases reported in South Korea which is equivalent to 2,056 in proportion
to the population of China – on that day in China there were only 20 cases.
Therefore, South Korea has made welcome progress compared to European countries,
but its success is far less that in China – the number of new cases in South
Korea on 15 March, relative to its population, was a hundred times higher than
in China.
The situation in Europe is now disastrously worsening when
measured in relative terms – which gauges the real impact of the virus. China’s
population is 17 times Germany’s, 21 times Britain’s and the north of
Ireland’s, and 23 times Italy’s. Recalling
that the highest number of new coronaviruses cases in China on a single day was
3,887, the number of new daily cases reported by the WHO on 15 March in Germany
(733) was over 12,000 relative to China’s population, the number of new cases
in France (829) was equivalent to almost 18,000 relative to China’s population,
the number of new cases in Spain (1,522) was equivalent to almost 46,000
relative to China’s population, and the number of new cases in Italy (3,497)
was equivalent to almost 82,000 relative to China’s population. So, in
proportion to the population, the number of new daily cases in Germany was
three times as high as the peak in China, in France five times as high, in
Spain 12 times as high, and in Italy 21 times as high.
The relative impact of the coronavirus is therefore already very
much worse in Europe than at the most severe period in China. Furthermore, the
number of European cases is rising. While China is bringing the coronavirus
under control, failure of the European capitalist countries to take similar
measures to China has led to the virus spreading extremely rapidly.
Economic and market impact
The global economic impact follows inevitably from this
failure in the West to contain the virus. Europe is the world’s largest
economic area – taken together even bigger than the US. Therefore, the fact
that the relative speed of spread of the coronavirus in Europe is far faster
than at the worst period in China has a very severe impact on the world
economy. This by itself inevitably has a harsh effect on Western stock markets
and economies. This negative economic shock then also explains the plunging oil
price and the oil production war waged by Saudi Arabia, Russia etc. The oil price shock then worsened the stock
market falls through the crash in energy company share prices.
The situation in the US is perhaps two weeks behind Europe –
although this is difficult to judge precisely as the US authorities are taking
a dangerous approach of minimising the virus’s danger. Trump initially tweeted
that the coronavirus is a less serious risk than ordinary influenza. As is
widely understood a similarly reckless policy is being adopted by the British government.
The US appears in key cases to either have a totally
inadequate number of virus test kits or may be taking the criminal decision not
to test – a policy now being adopted by the British government. For example, to
take the worst case, the Washington
State nursing home which suffered the most severe outbreak in the US, with
19 suspected deaths, waited days before receiving kits to test others – which
revealed another 31 cases. A patient must pay over $3,000 for a coronavirus
test in the US so many without medical insurance will not take tests.
There are also extreme disparities between US data and that
which is being supplied to the WHO, greatly understating the coronavirus’s
spread in the US – presumably this data is supplied by the US authorities. For
example on 9 March the official data published by the WHO, doubtless US supplied,
showed only 213 US cases while the very reputable Johns Hopkins University,
which has collated reports, already found 761 US cases – more than three times
as high as the figures supplied by the US to the WHO. This disparity between
data supplied to the WHO by the US and studies by reputable institutions in the
US is continuing.
In Europe, apart from Britain, the authorities appear to be
keeping serious records, but as already noted these reveal that the spread of
the virus in key countries is proportionately more rapid than at the worst
period in China. It is unclear if the US situation represents severe lack of
preparation in light of two months warning of the arrival of the virus,
organisational chaos, or the administration’s severe underestimation of the
seriousness of the virus or deliberate measures to under report cases for
reasons such as aiding the stock market.
The British government’s decision not to test all cases is
clearly a deliberate policy to attempt to try to keep the number of reported
cases down. This is criminal irresponsibility – without testing the spread of
the virus cannot be traced and those who do recover from symptoms have no idea
whether they really had the coronavirus or not. This furthermore means that the
most immune group, those who have had the virus and have recovered, do not know
that they are the best people to help the most vulnerable as they have never
been tested.
In summary, in addition to the direct health impact, the
severe stock market falls came when China was overcoming the virus but was because
an extremely serious situation was revealed in Europe and great lack of clarity
in the US – the stock market crash, logically, was due to the coronavirus
situation not in China but in the West.
The economic perspective depends on the medical policy
It is impossible to precisely estimate the precise depth of
the economic downturn, although it will be sharp, without knowing whether the
coronavirus can be brought under control in the West. While emergency measures in
slashing interest rates and undertaking Quantitative Easing are being taken by
the US Federal Reserve, other central banks, and capitalist governments, many measures
cannot be taken while the health emergency continues. People will not go to shop,
to restaurants, to travel for holidays etc, whatever the economic inducements,
if they think they may die as a result. Many economic recovery measures therefore
can only be taken when the medical situation is ended.
As China is getting the coronavirus under control it can already
begin to prepare economic recovery measures. But until capitalist Europe is
prepared to take the decisive measures to control the coronavirus, similar to
those used in China, the medical situation will continue to deteriorate, and it
cannot launch any effective economic recovery measures. Simultaneously the medical
situation in the US remains entirely unclear due to the entirely wrong approach
taken at the beginning of the outbreak by the Trump administration. The World
Health Organisation has explained
the situation clearly in a virtually unveiled attack on the policy of the
British and US governments: ‘The most effective way to prevent infections and
save lives is breaking the chains of transmission. And to do that, you must
test and isolate. You cannot fight the fire blindfolded. And we cannot stop
this pandemic, if we don’t know who is infected. We have a simple message for
all countries Test, test, test. Test every suspected case.’
The background in the Western economies when the coronavirus
hit was clear. Their economic situation was weakening since the peak of the
current US and EU business cycles in the second quarter of 2018. From then
until the 4th quarter of 2018 US GDP growth had fallen from 3.2% to 2.3%,
and the EU’s from 2.5% to 1.2%. The coronavirus will clearly weaken this
economic growth further – by how much depends, as already analysed, on how
rapidly decisive European and US anti-coronavirus measures are taken. The UK
recorded zero GDP growth in the three months to January, before the coronavirus
impacted this country. Given this weakness before the coronavirus struck it
will therefore be a miracle if a recession in the West is avoided.
The experience of China shows the coronavirus can be brought
under control. But so far, the capitalist Western countries are not taking
these measures. There is therefore already a disaster in the West due to the
failure of response to the coronavirus. The only question is whether the
disaster will worsen further into a catastrophe.
This is an updated version of an article from John Ross,
which first appeared in Chinese in Global Times
The claim from the Tory government and its army of media
supporters that the latest Budget has ended austerity is completely false. It
is very important for the left and the labour movement as a whole that they
grasp the character of the new attacks to come, so that they can resist them.
In effect, this is a Tory government of a new type. Previously,
since austerity was first implemented in 2010, the Tory governments have
transferred incomes from workers and the poor to big business and the rich. This
is in the hope that both increased rates of exploitation and the transfers of
funds themselves will encourage business investment. But the encouragement to
private investment has been a dismal failure. Private investment growth is
officially forecast to be zero this year.
The new Tories want to provide further inducements to
private sector investment by increasing public sector investment. SEB
has argued vociferously for increased public investment over a prolonged
period. This not investment for its own sake, but to increase the productive
capacity of the economy (adding to the means of production) as the most
decisive factor in raising the output of the economy and therefore prosperity.
But these Tories intend the opposite. They want to increase
the rate of exploitation further, provide incentives to private business to
investment, and intend to do this by funding with investment with yet another
reduction of public services and (probably) public sector pay. They will further
shift the burden of the crisis onto the shoulders of workers and the poor.
Government current spending is being cut over
the medium-term.
There is a one-off boost, to cope with the
effects of their own disastrous Brexit
The projected rise in government investment (if
it materialises) will still leave total government expenditure lower than in
recent years
This means that the rise in public investment is
more than being funded by further attacks on public services and public sector
workers
There is a significant projected increase in net
government borrowing. This is despite a fall in debt interest payments, which
themselves are being used to boost spending in the short-term
This is not ‘deficit-financed growth’, as has
been claimed. It is the effect of weaker growth on public finances, pushing both
tax revenues lower and automatic outlays (such as welfare payments) higher
In fact, the current year for which the OBR
provides an estimate and the subsequent 5 years’ forecasts are the weakest on
record for such a prolonged period
Taken together, SEB can find no recorded
10-year period of real GDP growth where every year is below 2%. This is what
the actual recent growth years’ growth rates will amount to, combined with the
OBR forecasts
There is a sharp one-off rise in government
current spending next year. This is not to combat the effects of the
coronavirus crisis, which is current. Instead, it follows the withdrawal from
the EU at the end of this year. It clearly indicates the government expects a
very negative outcome from the Brexit it is planning
There is nothing substantial in the Budget to
address the climate crisis, and the need for large-scale investment in
renewable energy production, or conservation
Austerity resumed
Despite the mass of commentary suggesting that austerity is
over, it is very simple to demonstrate that is not the case. The chart below is
taken from the OBR databank and shows total for public spending (TME), current
(or day-to-day spending, PCE) and net public spending as a percentage of GDP.
Chart 1. UK Public Spending Totals, Current Spending and New
Public Investment, as a % of GDP
The chart lines show a downward trend of total government
spending. For the 6 years of OBR estimates and forecasts from 2019/20 to
2024/25 average TME (total government spending) is 40.5% of GDP. For the
preceding 6 years it was 40.8%. Total government spending will be lower and austerity
is not ending at all.
The big impact will be felt by public current spending. Over
the same 6-year periods, Public Sector Current Spending (which includes health,
education, welfare and so on) will fall to 35.5% of GDP, from 36.5% of GDP.
By contrast public sector net investment is projected to
rise from 2% of GDP last year to 3% by the end of the 6 years of the OBR’s
forecast period. But it should be clear, it is ordinary people who most rely on
public services who will be paying for this increase. Furthermore, as the OBR
itself points out, there is a persistent and large shortfall between the
projections for public sector investment and what actually takes place.
Planning investment is not the same as delivering it.
A significant one-off
boost to spending
The basis for all the hyperbole and false claims about the
Budget is because of a one-off increase in government spending next year. This
can be shown in one of the key tables from the Treasury’s Red
Book.
As the table shows general government spending receives a
very large boost in 2021, rising by 10.9%. This falls back in the following
year and austerity returns in 2023 and 2024. It is important to note that the
growth rate of this measure of government spending is even slower than in the
most recent years, 1.8% and 1.2% in 2023 and 2024, compared to 2.1% and 1.9% in
2019 and 2020.
This increase in government spending is not
coronavirus-related, which is a current crisis that the government will be
hoping is over before the end of this year. Instead, it is a response to the
Withdrawal Agreement from the EU which does end in December of this year. Clearly,
the government expects a large negative shock from the Brexit it intends to
carry out, and the increased spending is an attempt to offset its worst
effects.
The attempt is only partly successful, using their own data.
Real GDP growth is expected to rise to 1.8% in 2021. However, general
government expenditure accounts for about 40% of GDP, so a one-off increase of
nearly 11% should lead directly to a boost in GDP of well over 4%. But the
projected increase is just a fraction of that, with real GDP rising from just
1.1% in 2020 to a very modest 1.8% in 2021, when the spending is to take place.
Clearly, the implicit assumption is that without the one-off spending splurge,
growth would be sharply negative with the planned Tory Brexit.
Miserably low growth
The official projections for real GDP growth are a terrible
indictment of government economic failures. This includes but is not confined
to their own assessment of the further damage they will inflict with their
preferred Brexit outcome. As the Treasury’s Table 1.2 above shows, there is no
single year in which real GDP growth reaches 2% in the recent data and the
forecast period.
This is unprecedented. It would amount to at least a 9-year
period of real growth below 2%, a lost decade. There is no equivalent in the
modern era of such sluggish growth, in either the Great Depression or the Long
Depression at the end of the 19th century.
In fact, as Chart 2 below shows, the official outlook for
growth is even worse in coming years than the period immediately behind us, in
the years following the Great Recession in 2008.
Chart. 2 Real GDP Growth, 2010 to 2024 (Forecast)
This unprecedentedly weak growth has a series of
wide-ranging effects, depressing any rise in living standards or improvement in
public services. It also has the consequence of damaging public finances,
lowering the growth in government taxation revenues and automatically pushing
some government spending higher, for example in some welfare payments. This is
the cause of the large deficits in public finances that are forecast.
This is not ‘deficit-financed growth’ as has been claimed;
there is no growth and the economy slows. And, as already noted total
government spending will fall. These deficits are a reflection of economic
weakness, not ‘keynesian pump-priming’.
The multiple crises
There are a series of crises that the government is failing
to address: coronavirus, the weakness of the economy, the damage from its own
intention to crash out of the EU without a deal, the crisis in public services,
the unprecedented weakness in the economy and the existential threat of
catastrophic climate change. Measured against any of these challenges the
government’s response has been woeful.
On the coronavirus crisis, at every turn, it has unpicked
the measures praised by the World Health Organisation and enacted in China and
Viet Nam. Every excuse is made for inaction, that masks are not perfect,
testing is not 100% accurate, there is no point in heat-testing or even hand
gels at the airports, and so on. Instead, it has relied on measures to correct
some of the economic effects of coronavirus spreading. These steps, and many
more will need to be taken. But they are pointless unless and until government
is bearing down on the spread on the virus itself, which is clearly not the
case.
This will put enormous strain on the economy and public
services, especially the NHS (but also care for the elderly and education,
among others). Public services are already buckling under impact of a decade of
austerity. The UK already has below-average ratio of nurses to the population,
7.9 per thousand compared to 9.0 for the OECD as a whole. The only comparably
high-income country with a lower nurse/population is Italy (OECD
data).
It is clear that the increased spending in 2021 is not
coronavirus-related. Instead, it is a response to the effects of its own
determination to pursue a hugely damaging No Deal Brexit, presumably in order
to do a deal with Trump and adopt US business and labour market norms. The
government’s own forecasts show that a huge increase in spending to offset its
Brexit will produce barely a flicker of growth.
The planned increase in public investment is long overdue. But
it is very unlikely to produce either the transformation of ‘levelling-up’
across the country or the necessary corrective to abysmally low productivity
growth. For accuracy, the OBR forecasters do not expect either outcome.
One neglected factor, well established in classical
economics from Smith onwards, is that the effectiveness of all investment is
determined by the scope of the market. Any Brexit that takes this economy
outside the customs union will necessarily reduce the effectiveness of all
investment, because the market will also be severely contracted.
Finally, despite hosting COP26 in Glasgow later this year,
it is clear that the Budget contains no plan to address the climate crisis with
decisive action. Instead, this a government that has tried to press ahead with
plans such as the third runway at Heathrow and a road-building programme
regardless of the law. There was not even a pale imitation of Labour’s Green
New Deal, or anything similar. The Green New Deal is precisely the required,
targeted and ‘shovel-ready’ programme that could be implemented with
large-scale state investment – and is absolutely necessary. Instead, it seems
likely that The Tory recipe will be to search for new business-friendly
projects, such as more roads, and local and haphazard local projects.
When this fails to transform the economy, no doubt there
will be a new ideological offensive against public investment of all types. But
by then, US companies may be in control of large swathes of the public services
in this country.
There is no basis for the belief that the incoming Tory
government will end austerity. The reality is, from their own perspective and
from the interests they serve, the Tories will be obliged to deepen it.
It is extremely important that the labour movement, all
those who want decent living standards and public services and the left are not
suckered into believing that this Tory government will be any improvement on
its predecessors. Instead Johnson will pile up further misery, in addition to
the damage that has already been inflicted.
Early pointers
It is easy to list some obvious pointers to the government’s
direction on austerity.
First, the government’s legislative programme (the ‘Queen’s
Speech’) contains measures to outlaw strikes in the transport sector. There is
no need to outlaw strikes unless you are planning a confrontation with unions. If
the Tories are successful they will be emboldened to take on other workers. In
recent days, this
has been supplemented by the frame-up arrest of a union leader at a
peaceful picket as well as
an attack on the role or even the existence of the FBU from the
government’s inspectorate of fire services.
Secondly, in the same programme there is planned legislation
for permanent underfunding of the health service (as well as the threatened
removal of performance targets on waiting times at A&E services). In
real terms, the NHS funding law will provide the lowest cumulative rise in real
spending since the inception of the NHS. Labour attempted to amend it so
that the real increase is 4% per annum (which, although still modest rises by
historical standards takes some account of both rising population and the
higher inflation of medical equipment and drugs, plus the costs of
technological innovation). The amendment was rejected.
Thirdly, on this government’s own assessment the economy
will be severely hit by the Trump/Johnson Brexit. GDP
will be 6.7% lower by 2034 than it would if the status quo was maintained
and real wages 6.4% lower. This is not George Osborne’s stupidly exaggerated
‘project fear’ of immediate and sharp recession. It is this pro-Brexit
government’s own assessment of the consequences of something like a ‘No Deal’
Brexit. Typically, these official estimates tend to underestimate the damage,
as SEB has previously shown.
Finally, the economy is contracting. GDP in November shrank
by 0.3%, and outright contraction for the whole of the 4th quarter
is possible. With just one month’s data remaining it is almost certain too that
industrial production will have fallen for the year as a whole 2019 compared to
2018. Business investment is not rising and was lower in the 3rd
quarter of 2019 than it was for the same quarter in 2016.
The Tories are clearly faced with a worsening economic
crisis and the global economy offers no grounds for optimism. The idea that
they will address this crisis in the interests of the working class and the
poor is plainly ridiculous. Instead, they have given strong indications they
are gearing up for a major fight.
Why is there an
austerity policy at all?
Austerity has not been adopted because Tory politicians are
nasty. A change (in this case policy) cannot be explained by a constant.
SEB has repeatedly
explained that austerity amounts to a transfer of incomes from workers and the
poor to big business and the rich. So, in the very first austerity budget, the
Treasury documents showed that the projected revenue increase from raising VAT
of £13 billion (which mainly hits workers and the poor) was almost exactly the
same as the revenue lost by cutting Corporation Tax. The deficit was unaffected
by these measures, but income had been transferred upwards, to business and the
rich.
Using correct, Marxist terms there were two main elements to
austerity. The rate of exploitation was increased by cuts in real pay and
pensions. In addition, the social surplus was redirected away from workers and
the poor (cuts to welfare payments, rise in VAT) towards capital and the very
rich (tax cuts).
The combined effect of these measures was to force workers
to work more for less and to incentivise businesses to invest more. But the
second part of this policy has failed. Real wages did fall, but businesses did
not increase their rate of investment.
Fig.1 below shows the quarterly real annual rate of growth
for business investment from the 1st quarter of 2000. Business
investment has been slowing since the beginning of 2014 and is now beginning to
contract outright.
Fig 1. UK Business Investment, quarterly real annual rate of
growth from the 1st quarter of 2000 to 3rd quarter of
2019
In the last great crisis of British capitalism, Margaret
Thatcher was drafted in to do a very similar job to the one attempted by
Cameron and Osborne. Helped along by the huge windfall of North Sea oil
revenues, which were frittered away, she did produce a recovery in business
investment.
This was achieved by increasing the rate of exploitation. Cameron
and Osborne followed her example quite slavishly with spending cuts, real cuts
to public sector pay, cuts to welfare, cuts to taxes for the highest earners
and big business and privatisations. The cloak for these policies, the hue and
cry over the deficit, was different to their predecessor, inflation and
monetarism, but the project was broadly similar.
But the failure of the later Thatcherites can be shown
decisively in terms of business investment, the renewed expansion of capital
accumulation based on a series of defeats for the working class which allowed
her to increase the rate of exploitation.
Fig.2 below shows the change in investment, (GFCF, Gross
Fixed Capital Formation) from 1949 onwards. Data for UK business investment
alone only begins in the 1990s. But, as the UK is a capitalist economy the
majority of the investment throughout will have been made by the private
sector, and so provides an approximate guide to what the relative impact of
Thatcherism was in this area.
Fig 2. UK GFCF, % change year-on-year, 1949 to 2018
In the immediate post-World War II era there were relatively
high rates of investment, but it slowed markedly. This reached outright
contraction in the early 1970s. Thatcherism was the antidote to this, by
cutting real wages and business taxes. Although there was initially a slump,
Thatcher’s project was successful and investment recovered throughout the
1980s, until it was brought to a crashing halt by the excesses of the Lawson
boom, where the government refused to use the oil revenues for public
investment and cut personal taxes instead, fuelling an unsustainable boom in
consumption.
As the chart shows, investment growth has only ever been
meagre since. Worse, the sharp contraction of the 2007 financial crash and the
2008-09 recession has only ever produced a meagre and short-lived investment
recovery. Investment is now slowing to a stop once more. Cameron and Osborne
completely failed to emulate Thatcher’s temporary ‘success’.
This will not happen. The splits in the British ruling class
over Brexit were set aside in their united opposition to Jeremy Corbyn
precisely because he intended to increase the role of the state in the economy.
This diminishes the ability of most parts of the private sector to maintain
their profits, or to expand them. It is anathema to them. The Tories will not
do it.
Instead, there are protections for workers that currently
apply in British law because of adopting EU law. Johnson has signalled
repeatedly that he does not want to continue with ‘alignment’ with EU laws and
rules. The Trump/Johnson Brexit will include a programme of rolling back workers’
rights.
The objective conditions are also set firmly against
Johnson’s economic policy being some version of Corbynomics-lite, as much of
the press seem to want to believe. The government’s own negative assessment of
economic prospects under Johnson’s Brexit policy will also mean a sharp
deterioration in government finances. Under those circumstances a sharp
increase in state investment is not impossible, but goes beyond the limit of
what the private sector is likely to voluntarily provide in the form of buying
increased government debt. Some form of compulsion, including nationalisations
and raising taxes on business would be required. The Tories will not do it.
From their perspective, the Tories cannot and will not
abandon austerity. Instead, it should be clear they are preparing for a further
attack, and that this time it will include major political struggles, over
union rights, the right to organise and to protest and other issues.
Climate
change is the most important political issue of our generation. There’s 99
percent scientific consensus that humans are causing global
warming and that, unless we stop putting greenhouse gases in the atmosphere,
life on earth will become increasingly unviable. If we continue at the current
trajectory in terms of greenhouse gas emissions, we’re facing over four degrees
Celsius of warming by the year 2100. David Wallace-Wells writes in his book The Uninhabitable Earth: A Story of the
Future that, “according to some estimates, that would mean that
whole regions of Africa and Australia and the United States, parts of South
America north of Patagonia, and Asia south of Siberia would be rendered
uninhabitable by direct heat, desertification, and flooding.”
According to
the UN’s Intergovernmental Panel on Climate Change (IPCC), humanity needs to
halve its greenhouse gas emissions by 2030 and hit net zero by 2050. If we fail
to hit those deadlines, hundreds of coastal cities (including New York,
Shanghai, Hong Kong, Mumbai and Lagos) will likely be permanently submerged;
the agricultural system faces collapse; wars will be fought over climate
change-induced scarcity of resources; and there will be hundreds
of millions of climate refugees. Floods, droughts,
hurricanes, typhoons and wild fires will become so commonplace as to barely be
newsworthy. The results of climate change are already all too visible: 18 of
the 19 warmest years on record have all occurred
since 2001, and we’re witnessing an unusually high rate of
extreme weather events.
Most
environmentalists agree that the safe upper limit for global warming before the
planet reaches an irreversible tipping point is 1.5 degrees centigrade. Bearing
in mind that the average global temperature today is already
0.9 degrees higher than it was in 1880, we’re only left with
0.6 degrees before we hit the point of no return.
What needs
to happen?
There is one
critical target to focus on for the next decade, as outlined in the IPCC
Special Report on 1.5 degrees, which is to reduce global carbon emissions to 50
percent of current levels.
Labour’s
manifesto sets out an even more ambitious target, aiming to “achieve the
substantial majority of our emissions reductions by 2030 in a way that is
evidence-based, just and that delivers an economy that serves the interests of
the many, not the few.” Labour has made a world-leading pledge to generate 90%
of electricity and 50% of heat from renewables and low carbon sources by 2030.
Globally,
the target will be to get to net zero emissions by 2050. Note that ‘net zero
emissions’ doesn’t necessarily mean not emitting any carbon at all – but
whatever is emitted must be captured and stored.
Practically,
this means that “flying, driving, heating our homes, using our appliances, basically
everything we do, would need to be zero carbon”, writes climate change expert Kevin
Anderson.
This goal is
achievable. We already have the technology to generate all our electricity via
renewable energy. Particularly in technologically advanced countries, it should
be perfectly possible to completely phase out fossil fuel-based power plants
within a few years; it simply requires investment in the surrounding
infrastructure, along with the political will to stand up to fossil fuel
capitalism.
We can also
massively cut down on waste and inefficiency. Energy efficiency – making our
economy less energy-intensive – is “widely considered to be the most important
single option for carbon reduction”, in the words of Neil Hirst, former
Director of the International Energy Agency (The Energy
Conundrum). David Wallace-Wells notes that around half of British
greenhouse gas emissions come from inefficiencies in construction, discarded
and unused food, electronics, and clothing. Retrofitting homes for heating
efficiency, for example, would make a significant contribution to reducing
emissions in relatively cold countries like Britain. According to Mike
Davis, “heating and cooling the urban built environment alone
is responsible for an estimated 35 to 45 percent of current carbon emissions.”
Transport is
another key area for reducing – and ultimately eliminating – carbon dioxide
emissions. There’s tremendous potential for fully-electric public transport
systems, along with electric car pools, electric bicycles, and urban designs
that encourage cycling. Again, this requires major investment, along with
rigorously-enforced laws to stop the climate criminals. In the words of Gus
Speth, former Dean of the Yale School of Forestry and Environmental Studies, “a
reliably green company is one that is required to be green by law.” (Cited in
Naomi Klein’s This Changes Everything:
Capitalism vs. The Climate) Meanwhile, until we find a way to power
aeroplanes without burning fossil fuels (the technology isn’t far off), we’ll
need to reduce air travel significantly.
We also need
to change our diets. We don’t all have to become vegan, but meat consumption
will need to be reduced in wealthy countries. Mike Berners-Lee writes that “the
single most important change will be an amazingly simple dietary shift towards
less meat and dairy consumption, with a particular focus on reducing beef. This
will markedly reduce greenhouse gases, improve the nutritional output of our
land and, by relieving land pressure, ought to be pivotal in stemming
deforestation.” (There Is No
Planet B: A Handbook for the Make or Break Years)
However,
it’s important to note that individual acts of good planetary citizenship are
not going to solve the problems we’re facing. As Wallace-Wells observes, “we
frequently choose to obsess over personal consumption, in part because it is
within our control and in part as a very contemporary form of virtue
signalling. But ultimately those choices are, in almost all cases, trivial
contributors, ones that blind us to the more important forces.” Without
concerted action at a national and international level, without large-scale
decarbonisation, we will not avoid catastrophic climate change. As such, the
problem is a political one.
Responsibilities
of the rich countries
At a global
level, China
leads the way in tackling climate breakdown, in terms of
investing in renewables and electric vehicles, driving the costs of green
energy down via massive state-led investment, carrying out vast afforestation
projects, and rolling out fully-electric buses and trains. However, China is
still a developing country, with over 1.3 billion people, many millions of whom
are likely to increase their energy consumption in the near future, since they
are still at a stage of development where increased energy consumption
correlates directly with improved quality of life outcomes. China can’t save
the planet on its own, nor can it be expected to. In terms of “common
but differentiated responsibilities”, the
technologically-developed wealthy countries of the OECD have the greatest
responsibility when it comes to averting catastrophic climate change.
The rich
countries fuelled their own industrial revolutions with coal and oil, resources
which they came to dominate in no small measure through colonial conquest and
imperialist manoeuvring. The US and Europe – with around 15 percent of the
global population – have contributed to over half the cumulative carbon dioxide
emissions since 1850. And the horrific irony is that these countries are the
least affected by climate change. Catastrophic climate events will hit – are
hitting – the poorer regions of the planet first.
As such,
countries like Britain have a clear moral responsibility to take the lead in
addressing climate change. To this day, it’s the wealthy that are living
wasteful lives, contributing to the ever-worsening situation. According to Ann
Pettifor, “just 10 percent of the global population are responsible for around
50 percent of total emissions. Per capita carbon dioxide emissions in Africa
are less than 10 percent of those in Western Europe and North America. Tackling
the consumption and aviation habits of just 10 percent of the global population
should help drive down 50 percent of total emissions in a very short time.” (The Case for the Green New Deal)
Furthermore,
it’s precisely the rich countries that have the resources to lead the way on
climate action. As has been pointed out before, “we
bailed out the banks, so now we can bail out the planet.” In
countries where large numbers of people don’t have access to modern energy, it
is understandable and correct that people want to provide that access with a
minimum of delay and cost. Sometimes that may even mean new coal capacity in
countries like Pakistan, where coal is by far the cheapest and most accessible
fuel (although the west should be offering the material support necessary to
allow such countries to meet their energy needs in a way that doesn’t damage
the environment). In OECD countries on the other hand, there is absolutely no excuse
for pursuing anything other than a rigorous and thoroughgoing energy
restructuring based on renewable sources.
How are we
doing so far?
The United
Nations Framework Convention on Climate Change was adopted in 1992, committing
the 154 signatory nations to “preventing dangerous anthropogenic interference
with Earth’s climate system”. The sad fact is that, in the intervening 27
years, “the sum of all the world’s climate action has so far made little or
perhaps even zero detectable impact on rising global emissions.” (Mike
Berners-Lee)
We are
nowhere near on track to meet the targets discussed above, for the simple
reason that we’ve left it to the capitalist market to provide solutions to the
planet’s problems. The domination of neoliberal economics over the last few
decades has reduced governments’ ability to set economic policy in the national
interest. Fiscal revenue isn’t sufficient to finance large-scale green
development, and shareholder-driven capitalism is incapable of long-term
strategic planning on the level that’s needed. Meanwhile, the big fossil fuel
companies have an extraordinary level of entrenched power that they’ve used
systematically to slow down the energy transition.
There isn’t
even any meaningful agreement among the western ruling classes as to how to
respond to climate change. Although there is a relatively more forward-thinking
section that understands that they too would be affected by climate breakdown
(in much the same way that sections of the English bourgeoisie became
interested in public health when they realised that they too could fall victim
to cholera), there are also the neoliberal extremists who are happy enough with
the idea of moving to Finland or New Zealand and setting themselves up in gated
communities.
In summary,
neoliberal capitalism has shown itself to be utterly incapable of averting
environmental catastrophe. Even in Britain, where there has been some focus on
wind power, this has been far too slow. Today, wind contributes 17 percent of
electricity generation in Britain (well behind gas, at 40 percent). The
economist Mariana Mazzucato, arguing for concerted state-led investment in
green development, complains that the strategies thus far employed in the US
and Britain “lack a clear direction and fail to offer long-term incentives,
resulting in a start–stop approach to green initiatives that produces dubious
outcomes at best.” (The
Entrepreneurial State)
The Green
New Deal
The Green
New Deal (GND), conceived a decade ago by British economists and
environmentalists but recently popularised by progressive US congresswoman
Alexandria Ocasio-Cortez, provides the first viable, comprehensive and
actionable plan for developed countries to decarbonise their economies whilst
creating jobs, tackling inequality and promoting equality and social justice.
Measures include investment in renewable energy and zero-carbon public
transport; upgrading buildings for energy efficiency; building ‘smart’
distributed power grids to provide affordable clean electricity to all;
reorganising the food system; ending subsidies to the fossil fuel industry; and
prioritising basic needs.
The key to
implementing a programme such as the Green New Deal (or as it’s often referred
to by Labour politicians, the Green Industrial Revolution) is public investment
on a grand scale. As Berners-Lee points out when discussing the future of
renewable energy, “the solutions we need to the problem of intermittency and
storage are all coming along nicely; the critical factor is investment.”
This is
precisely what has been agreed by Labour’s recent conference, and what is being
put
on the table by shadow chancellor John McDonnell: a programme
of government investment “mobilising £250 billion of capital spending on the
projects needed to decarbonise Britain to avert irreversible climate change.”
Supported by
a National Investment Bank and network of regional development banks, the
programme will seek to ensure that “the transition to sustainability is one
that benefits everyone across our society.”
Starting
with the infrastructure for widely deploying clean energy, along with a plan
for retrofitting homes to be energy-efficient, the Green New Deal would create
hundreds of thousands of skilled jobs. The
plan includes nationalising the major UK-based energy
companies, replacing all gas boilers, closing fossil fuel-based power stations,
investing in and subsidising electric cars, vastly expanding off-shore wind
capacity, and decarbonising the public transport system.
On top of
the Green New Deal, it’s worth mentioning that Labour has also committed to making
green technologies available cheap or free to the countries
of the Global South. Plus of course the present Labour leadership is deeply
opposed to war, which has a major
environmental cost on top of its more obvious human cost.
If Labour
wins the General Election on 12 December and a Jeremy Corbyn-led government can
implement its version of the Green New Deal, it will be a huge boost for the
global battle to save the planet. Britain will blaze a trail for the rest of
the OECD to follow, towards a global Green New Deal that is, in Ann Pettifor’s
words, “a global banner behind which millions can assemble with one voice in
order to address the gravest crisis humanity has ever faced.”
If, on the
other hand, Labour loses the General Election and Britain has to endure another
five years of hard-right Tory government, the result for the fight against
climate breakdown would likely be disastrous. Boris Johnson’s ‘hard Brexit’
vision involves leaving the EU customs union and negotiating a free trade deal
with the US. That will mean a wide-ranging political alignment that could well see
Britain leaving the Paris Climate Agreement. With both Britain and the US
outside the Paris Agreement, the prospects for international cooperation to
combat climate change would look increasingly grim.
The planet
needs a left Labour government in Britain.
This is a slightly amended version of an article which originally
appeared in the Morning
Star.
The election plans laid out by the two major parties mean
that it is crystal clear only Labour has policies to address the current crises
(the LibDems can be disregarded in policy terms, as they only have one policy,
which they claim is ‘stop Brexit’ but which is actually ‘stop Corbyn’). There are combined crises of the climate
catastrophe as well as the stagnation of the economy and living standards.
The depth of the British economic crisis is not at all
widely understood. It should be as only
a proper appreciation of the scale of the problem can lead to the appropriate
measures to tackle it, the policies that are necessary and the political
choices that follow.
The scale of the economic crisis is illustrated in the chart
below. Fig.1 shows the growth rate for the capital stock, the total value of
machinery, factories, software, computers and so on used in the production of
goods and services across the economy.
Also shown are the growth rate in the consumption of capital, all the
machinery used up in the production process, the equipment the becomes obsolete
and the factories that become dilapidated. From this, the growth rate of the net
capital stock can be derived, which is the growth rate of the capital once the
capital consumption has been taken into account.
Fig.1 Growth in UK Net Capital Stock, 1998 to 2017
From 1998 to 2017 the annual growth rate in the net capital stock has fallen from 2.7% to just 1.1%. This exceptionally low level is a return to the earliest periods of capitalist development in Britain. In the 1760s as George III became the monarch, the growth rate in the net capital stock was about 1% annually. The only period which was significantly slower was in the exceptional period 1933-34, which saw an outright fall in the net capital stock, as part of the Great Depression.
This all matters because the net capital stock is
effectively a measure of the fixed means of production for the whole economy.
It is extremely difficult for the economy or living standards to grow
sustainably beyond the growth rate of the net capital stock. The other main route is to increase the hours
of labour, either by getting more people to work or getting the existing
workforce to work longer hours. But
without a rising level of the capital stock, the productivity of labour cannot
rise.
At the same time, an increase in one specific area of the
net capital stock is needed to tackle the climate crises. This is the required
level of investment in the production of renewable energy as fossil fuels are
eliminated. In addition, investment is
also needed in energy conservation and in the reduction of energy consumption.
The Labour party policy precisely addresses this key
component of the crisis by sharply increasing the level of public sector
investment. Labour plans to invest £250
billion over ten years in a Green Transformation Fund to achieve all these
aims.
Labour will also add a further £150 billion in a social
transformation over 5 years to invest in infrastructure, transport, housing and
capital investment in public goods such as health and education. The dilapidation of the schools and hospital
will be tackled.
The contrast with the Tory plans is not mainly the inadequately
small pledge of £20 billion per annum, or even the sharp U-turn in Tory government
ideology about borrowing to invest (no more ‘magic money tree’ nonsense).
The main issue is
that the Tory plans are completely fake. They are undeliverable under either
Boris Johnson’s deal or No Deal, which is still an option and which is the
clear preference of Trump. Under the government’s
own forecasts, the British economy will be 9.3% lower than it would
otherwise be in 15 years’ time with No Deal. Even if this forecast is accurate
(and mainstream economics tends to underestimate the negative impact on
investment), then the damage to government finances is likely to be very large.
To illustrate this point, the British economy did not
recover to its pre-recession peak until the 1st quarter of 2013,
fully 5 years later. This implies that the economy would have been about 12%
larger if the recession had not occurred. Over that time and in later years,
public sector debt trebled from under 30% of GDP to over 80%, including fierce
austerity measures.
This gives some indication of the likely damage to
government finances following a major negative development, either Johnson’s
deal (which is just No Deal for just Britain) or No Deal for the UK. There will
be no money at all for additional Tory public sector investment.
In fact, the long-standing ideology of the Tory party in
favour of small state economics combined with the absence of any resources
under their Brexit plans means that the entire government ‘programme’ of
investment is a complete fraud.
The Cabinet ideologues, almost all of whom have voted for
and written in favour of privatisation and outsourcing, have no intention of
allowing a sustained increase in public investment. And Trump has no intention
of allowing it either. His imposed deal will be the opposite, privatisation and
outsourcing with US corporations at the head of the queue.
By contrast, Labour gets it.
The scale of the ambition is in line with the objective environmental
and economic crises within the constraints of the current level of public
ownership of the economy. Looking ahead,
one of the key benefits of a large-scale nationalisation programme is that the
state would be able to have an even greater impact on the total level of
investment in the economy. These are the
real economic and environmental choices at stake in the election.
Bolivians vote in a general election on October 20th. Evo Morales has been the President since
2006, winning three successive terms as President.
A victory for him would continue the development of the
economy and the rise in living standards since he took office. It would be a considerable boost to the left
across Latin America, which otherwise faces the impositions of Bolsonaro, Macri
and Moreno, backed by the US and in some cases the IMF. Socialists internationally have every reason
to support a Morales victory.
The success of the project begun by Morales and the MAS
(Movement for Socialism) can be shown in 2 charts. The first below shows the level of Bolivian real
per capita GDP since 1976. In the 30 years before Morales came to power, real
GDP per person effectively stagnated. In
1976 it was US$1,687 and was only $1,692 in 2006, barely altered. Since then it has risen to US$2,506,
according to World Bank data. This
represents a rise in average living standards of 48%.
Fig. 1 Bolivia Real GDP
However, it is possible that average living standards rise
but that the bulk of this increase is claimed by the rich and the upper
classes. But this is not the case in
Bolivia. Chart 2 below shows the
proportion of the population below the poverty headcount rate of US$5.50 per
day, adjusted for inflation and PPPs (purchasing power parities).
Fig.2 Bolivia, % of Population on Incomes Below US$5.50
Once again, this measure of poverty shows there was little
progress before Morales. In 1997 52.6%
of the population were subsisting on incomes equivalent to below US$5.50 a day
in real terms. By 2006 that rate had edged down to 48.1%. But the fall since then has been dramatic,
with the poverty rate at 24.7% in 2017 (the latest available data). As the
population of the country is now over 11 million, this means that literally
millions of people, about one-quarter of the population, have been lifted out
of poverty.
The success of
Morales
There are a number of factors which have contributed to
Morales’ success. Initially, like many
countries in Latin America and beyond, Bolivia benefited from the rise in
global commodities’ prices, which were spurred on in particular by the rapid
pace of China’s industrialisation. There
was too a major shift in the population from the countryside to the towns and
cities, which rapidly expanded the workforce available for more advanced
production, including manufacturing.
But these factors were common to many countries, especially
in Latin America, but unlike Morales they failed to maintain their gains, or
even to hold onto office. That
commodities’ price boom has since faded as the Chinese economic model has
adjusted, and the pace of the migration into the urban centres has slowed in
many countries. The world economy is also slowing, so none of the previously
favourable conditions is likely to return in the foreseeable future.
To explain Morales’ success, one key area where the Bolivian
economic project stands apart, certainly in Latin America, is that the gains of
rising prices and output were not simply used to boost consumption, but also to
increase investment. Chart 3 below shows
the proportion of GDP directed towards investment, or GFCF (Gross Fixed Capital
Formation).
Fig. 3 Bolivia, GFCF as % of GDP
In 2006 GFCF as a proportion of GDP had fallen to a 14.3%
and had been even lower in the preceding period. It has since risen to 21.4% in 2015,
although it has softened a little in following years. The urban population is now 70% of the total,
so there is diminishing scope to increase the workforce available for more
advanced manufacturing or industrial production. Further gains will require the return to
previous high levels of investment, and even their extension.
Prospects
The validity of opinion polls is hotly disputed, although many show Morales well ahead but
short of an outright majority for the first round of voting.
The stakes are very high.
The insurrection in Ecuador against enormous price hikes, imposed by the
Moreno government acting on the instructions of the US and IMF, shows what the
likely alternative to Morales will be.
This includes both huge attacks on living standards, and severe state
repression to carry it out.
Morales’ political background is as organiser and then
general secretary of the peasant farmers, which experienced fierce repression
from the large landowners and the state forces, and forced the farmers into
guerrilla warfare, Morales included.
This is a political formation which creates an understanding of the role
of the state, which classes it defends and the brutality of it attacks, all
supported by the Unites States. It also
teaches the need for collective discussion, unity of action and strong
discipline among the resistance fighters.
It is clear too that, through this experience and his own ethnic
identity, Morales enacts a highly advanced policy towards the indigenous
populations.
Despite or because of all this, here in the West there is a
campaign of slander against Morales, led by the ‘liberal’ press. So, the Guardian repeatedly runs entirely
distorted arguments and outright lies, including describing Morales as ‘the
murderer of Nature’ in the Amazon.’ The
reality is that it is the far right poster boy Bolsonaro in Brazil, an ally of
Trump’s who is destroying the Amazon, and Morales is using every mechanism to combat it.
The stakes are also high for the planet as a whole. The Bolivian elections will not decide that
fate, but they are an important battle in the struggle.
Despite the claims of the Tory party and other supporters of
a No Deal Brexit that a new golden age of trade awaits with the US, the Trump
administration has just imposed new trade tariffs on British producers.
This is important for two reasons. It reveals the falsehoods
underlying the entire No Deal project. It also sheds light on the global
perspective of Trump, and how he aims to address the US economic crisis at the
expense of the rest of the world.
New tariffs
The US Treasury has issued a series of new 25% tariffs on UK
producers and others in the EU (pdf). This list is 8 pages long and includes a wide
range of goods, from aircraft, to whiskies, to woollens to pipe cutters and
many more goods besides. The tariffs are
due to come into effect on October 18.
The tariffs are allowed under the WTO rules (which are
themselves skewed towards the US) because it has found that the EU’s Airbus
production receives state subsidies.
However, experts suggest that a similar finding will be made against
Airbus’s big rival Boeing in a matter of weeks.
Both entities receive state support. In fact, it is
inconceivable that any private corporation would undertake the vast investment
required for large-scale aircraft production without state financing and
subsidies. Inadvertently, the free
market ideologues of both the US and the EU make the case for socialised
investment. In the case of the aircraft
makers, the investment would simply not take place without state intervention.
Airbus is also partly owned by European governments.
Boeing and Airbus are the two main global rivals for the
demand of airlines’ new carriers. They are at each other’s throats for decades,
and the cases against each other at the WTO have rumbled on almost as
long. This has taken a new twist with
Trump’s aggressive imposition of tariffs on a number of countries (including
‘allies’ in Europe,
as well as Canada
and Mexico). There is too the issue of the disastrous roll-out
of the Boeing Max 737, which has led to crashes, huge numbers of fatalities,
lawsuits and a threat to the company.
The imposition of the tariffs has received very little
coverage in the mainly Brexit-supporting press. Tariffs on existing production
destroy jobs and raise prices. If they are sustained these sanctions will raise
prices for US consumers (and EU tariffs will do the same in the EU) and destroy
jobs in the sectors concerned.
The sanctions have a strategic aim and reveal Trump’s
approach to the problems of the US economy.
Trump’s strategy
The US
economy is slowing – and the Presidential election is now little more than
12 months away. GDP growth in the 3rd quarter slipped to 2.1%, from
3.1% in the 2nd quarter. But the US is also experiencing a long-term
slowdown. As John Ross has shown
elsewhere, the medium-term trend in the US economy, removing the effect of
business cycles, is towards slower growth.
Therefore Trump has two problems. The immediate issue is to
raise the growth rate to a level that gives him a better chance of re-election.
The most
recent poll shows his approval rating at -16, which is normally far too low
for an incumbent to be re-elected. But he also has a strategic task in his role
as the representative of the general interests of US big business as a
whole. This is to ensure that the US
growth rate can recover over the medium-term, or at the very least that other
countries do not continue to gain ground on the US.
China is clearly the main target of Trump’s trade policy but
is certainly not the only target. Taken together, and making no judgement on
its likely success, from Trump’s perspective this amounts to an entirely new
trade policy for the US in the post-World War II era. Historically the superior
productivity of US industry and agriculture meant that it was an advocate for
free trade. While there were general benefits, the US would always be the
biggest winner.
Trump has turned that outlook on its head. The US slowdown
will be addressed by a re-ordering of the global trade system in US interests.
Specifically, other countries will be subordinated to the US, providing it with
unfair advantages and crimping the growth of non-US industries where they are
in direct competition with major US companies.
In this light, the attack on Huawei (which
leads on 5G telecoms technology) should be seen as driven by the same
policy as the attack on the makers of Airbus (Boeing’s sole global rival).
Airbus attack
Airbus had sales of €31 billion the first half of 2019. It
employs 136,000 people worldwide, 14,000 of them in the UK, where production of
the high value-added wings and part of the engines takes place.
Because of the integration of production across Europe, Airbus
has already publicly stated that any Brexit outcome which includes leaving
either the Single Market or a customs union would pose the company with
enormous challenges, which could require relocation in the EU.
The Trump/Johnson No Deal project does mean leaving both the
Single Market and the customs union.
This is also true of the latest Johnson proposal, which means that
Britain would leave both. The major
Airbus plant is based in North Wales.
There is clearly an advantage to the US from severely
disrupting the production of Boeing’s only global rival. But it should be
equally clear that there is no advantage to producers in the UK to accepting
such a deal. Unions
and business groups here have been right to highlight this.
This country will have to operate under WTO rules if it
crashes out without a deal. Under those rules, the trade tariffs are allowed
once an unfavourable ruling is made. In fact, there are few other mechanisms
available under WTO. But, until recent
years, the US was the by far the largest economy in the world. So, any system allowing
bilateral trade tariffs massively favoured the US. That will still be the case between the UK
and the US, with Trump holding all the cards in any negotiations or in any
subsequent trade dispute.
At the same time, it is futile to protest that Trump should
have targeted other countries instead, if he wants to get a US-UK trade deal. This is the approach of some business groups
in this dispute.
Trump’s aim is firstly to attack Airbus so that it does not gain an insurmountable advantage over Boeing. But he also rejects any soft-pedalling in his aggressive trade policy, even for ‘allies’. Outside of the EU’s Single Market and customs union, Britain will have to accept whatever Trump offers. And what he offers, or at least intends, is a complete restructuring of the global trade system in US interests.

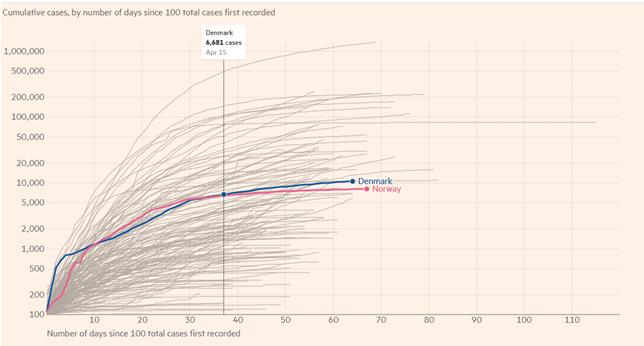
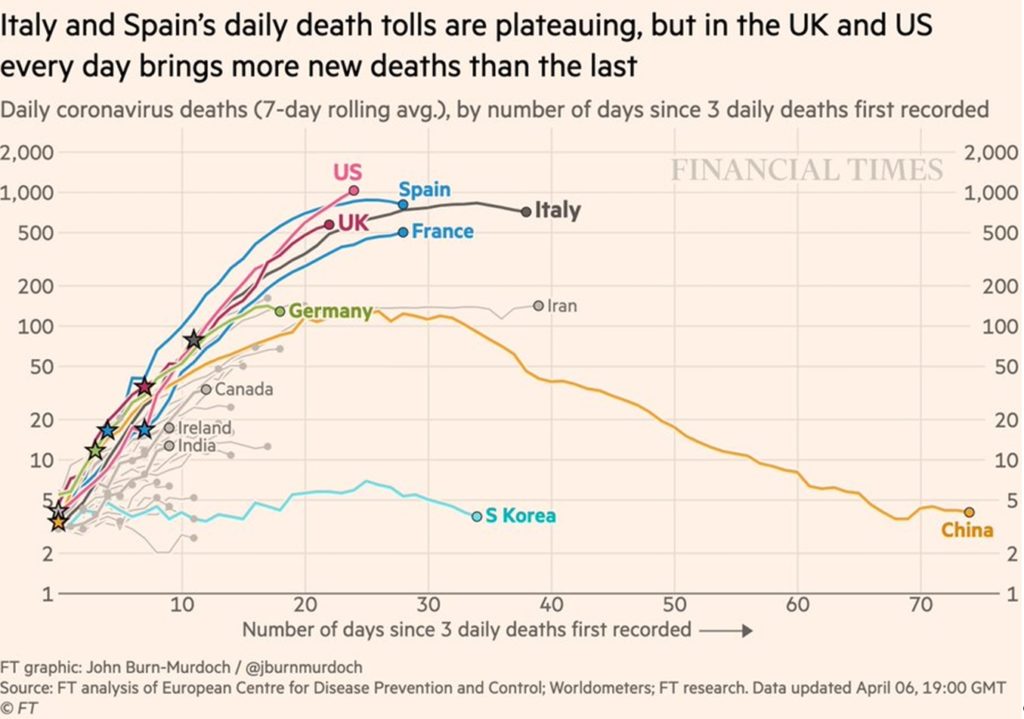
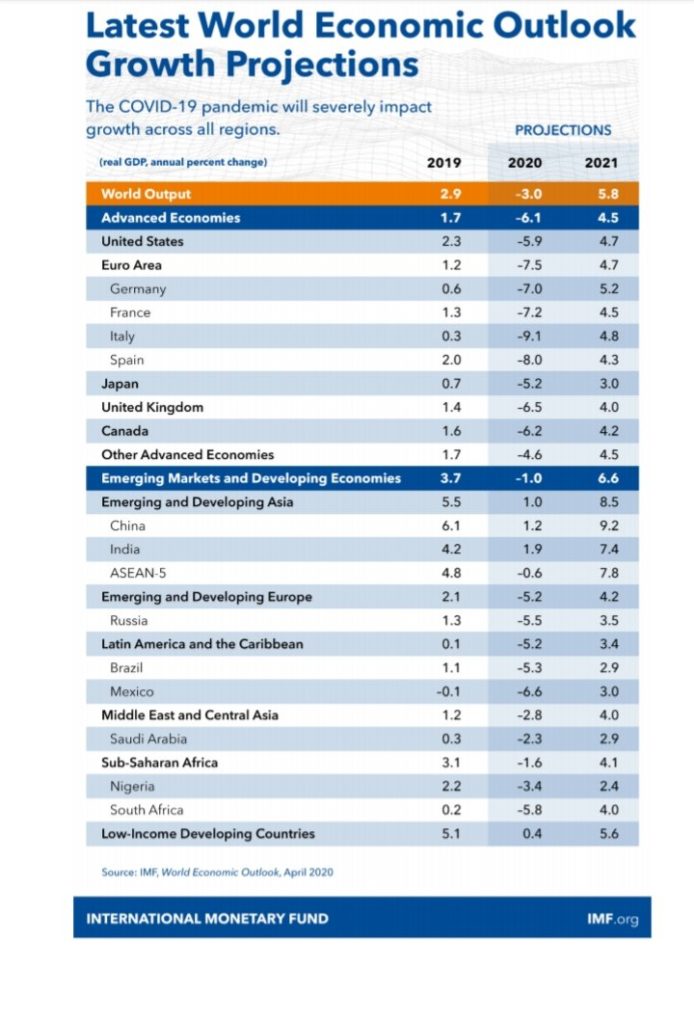
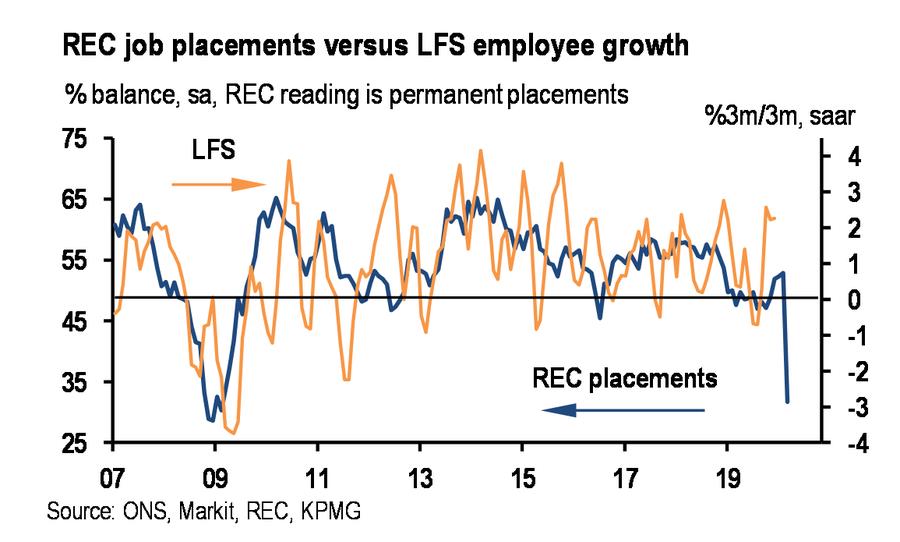

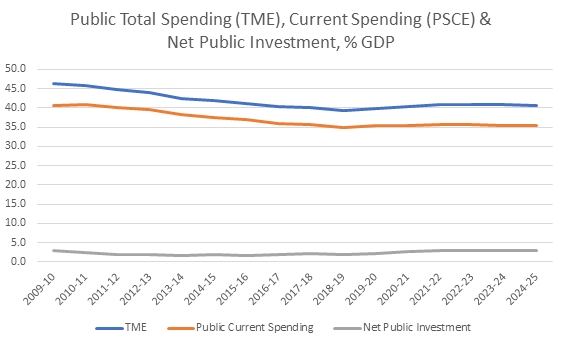
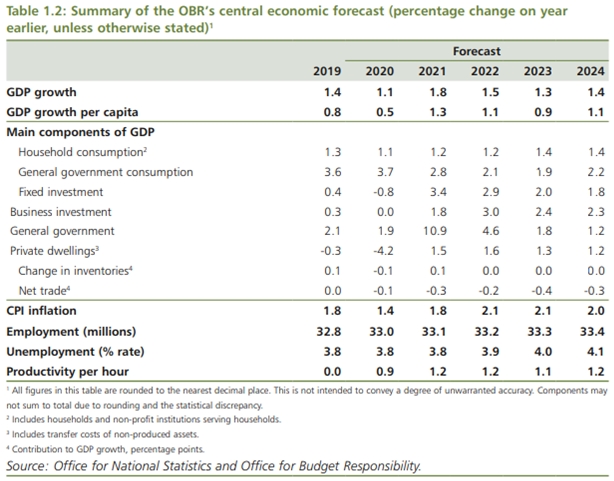
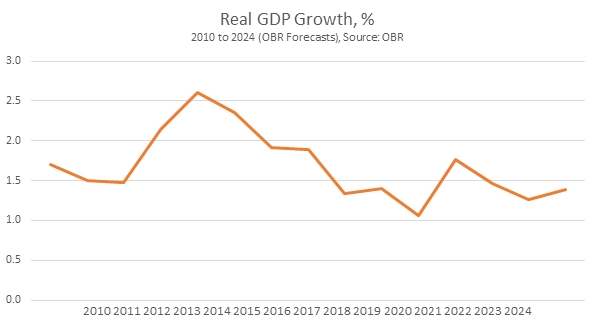
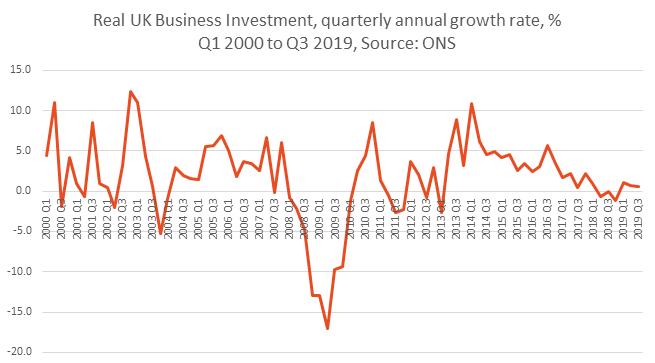
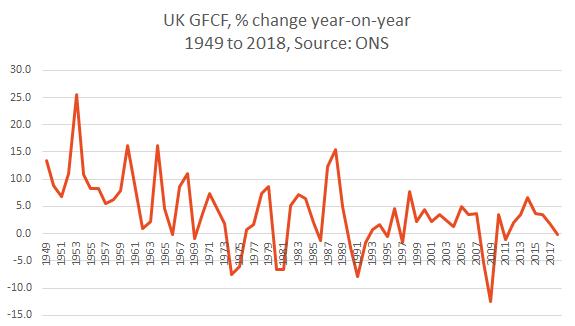
Recent Comments