The levers government can use for investmentBy Michael Burke
At a certain point in the next few months the recession in Britain will officially be over as the real level of GDP will finally exceed its previous peak in the 1st quarter of 2008. The media coverage will be generally very favourable, in the hope that this will boost the Tory vote and vindicate the austerity policy. In reality it will do neither. The economy was already recovering modestly when the Coalition took office and the austerity policy reversed that upturn. This is the weakest and most drawn out recovery since the 19th century.
Nor is the hoped-for political impact likely to materialise. One reason why the Tory vote in opinion polls has hit a ceiling fractionally above 30 per cent is precisely because of austerity. The policy is designed to transfer incomes from labour and the poor to capital and the rich. At the same time, the austerity policy of cutting state investment undermines any robust or sustainable recovery. The economy overall continues to stagnate and only a fraction of society feels any benefit from the recovery. During this ‘recovery’ most people’s living standards continue to decline. The political impact is that the Tory Party can shore up its core vote, but not add to it.
It is important to be clear about the task that will face an incoming Labour government. Labour will inherit a crisis, not a recovery. While the economy will soon recover its pre-2008 level, this represents 6 years of lost output. Living standards should have been rising, but they have not because of economic stagnation. Instead, living standards for the overwhelming majority have fallen as a direct result of austerity policies. A continuation of austerity policies after 2015 would produce the same result of economic stagnation and falling living standards for the majority.
Chart 1 below shows the medium-term trend growth for the British economy, and its current performance. The economy is approximately 16% below its previous trend level of growth. There is no evidence to suggest that this gap between previous and actual growth rates will close in the foreseeable future.
Chart 1. Trend and Actual GDP Growth
This means the poverty created during the slump will become a semi-permanent feature of the British economy. An incoming Labour government would need a radically different policy in order to achieve a very different outcome. It would need to address the cause of the crisis.
The fall in investment remains the main brake on recovery, led by the decline in private sector investment. On current estimates, GDP in the 1st quarter of 2014 was still £10bn below its peak level in the 1st quarter of 2008, but investment (Gross Fixed Capital Formation, GFCF) remains £50bn below its level at the same time. The slump in investment more than accounts for the current stagnation. The private sector has been unwilling to lead investment higher, so government policy must lead the way.
How to pay for investment?
Since Britain was not a high-investment economy even before the current crisis, £50bn a year in additional investment over the lifetime of the next Parliament is the minimum that would be required to resume trend growth. Replacing lost output and investment would require a further £320bn to avoid the loss incurred in the recession becoming permanent.
These are enormous sums, approaching the level of the bank bailout in 2009. There is no appetite for borrowing on this scale, even though there is clearly a case for some increased government borrowing to fund productive investment, especially when government interest rates remain close to zero in real terms.
Therefore, the bulk of the funds must come from another source. If it were really the case that ‘there is no money left’ then that would be the end of the matter. But it has already been noted that sometime in the near future the economy will recover its pre-crisis peak. Logically, this means there will soon be more money, more resources available than was the case before the recession, not less.
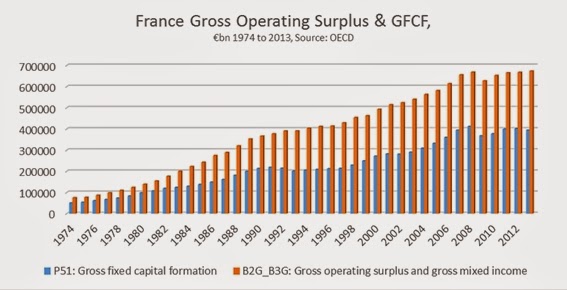
There is money left, it is simply not being invested. There is a yawning gap which has emerged between the level of investment (GFCF) and the level of profits. In 1990 the level of uninvested profits was £73bn. In 2013 it was £307bn. Even if we take profits after the effects of taxes and subsidies, the level of uninvested profits has risen from £5bn to £97bn in 2013. This is because taxes on production have been cut repeatedly over the period. The trend in uninvested profits is shown in Chart 2 below.
Chart 2. Profits & Investment, 1990 to 2013
What levers for a radical, reforming government?
Since the fall in investment accounts for the continued stagnation of the economy and corporate profits are not being invested at an increasing rate, it follows that any serious discussion on reversing the slump must be focused on the mechanisms for directing those profits towards productive investment.
The key areas for that investment remain home building, infrastrucure, energy, transport and education.
In passing, it should be noted that the uninvested profits themselves have number of different destinations, all of them with negative consequences. The main destinations for uninvested profits include increased executive pay and returns to shareholders in the form of dividend payments and share buybacks, which have all reached record levels. In addition, there is a growing cash mountain held in the bank accounts of British non-financial companies. It remains unused by them (and most is held in accounts yielding little or no interest). But it is used by the banks partly to fund increased speculation in financial assets, including housing, international stock markets and commodities, including foodstuffs.
Levers for investment
I . Using the banks One unintended consequence of the financial crash of 2008 to 2009 was to increase the role of the state in the economy, even, or especially in countries where governments were committed to laissez fare policies. In Britain a very large section of the banking industry remains in public ownership in the form of RBS and Lloyds banks, through the body UKFI. At the same time all banks operating here are subect to licensing, authorisation, regulation and capital requirements from the Bank of England and other public bodies.
Prior to deregulation and Thatcherism, the Bank of England used to engage in ‘credit direction’. This was largely done informally, but in some detail so that banks would be instructed not only as to the amount of credit they should provide to the economy, but to which sectors and in which proportions[i]. The formal powers and associated bodies now are far greater and renewed credit direction actually runs with the grain of current regulation, which favours lending to governments as far safer than lending to corporations.[ii]
The government has a wide array of measures it can use to instruct the banks to provide credit for productive investment. The government could create special vehicles in order to channel that credit, or use existing ones (see below). Where bank executives prove reluctant to follow those instructions, the summary dismissals of Fred Goodwin from RBS and Bob Diamond from Barclays demonstrate the public sector’s power over the banks, if it chooses to exercise it.
II . Transforming existing schemes In the post-World War II period all economic recoveries have been led by government spending. In that sense, this recovery is no exception. The crucial difference is the content of that government intervention, which has increased current spending, but slashed public investment. It has supplemented this with a series of subsidies for investment to the private sector.
These schemes include, funding for lending, help to buy, guaranteed profits for the builders of nuclear power stations and innumerable other schemes. One part of the nuclear guarantee alone may cost government £17.6bn[iii].
Without incurring any additional costs, a reforming government could simply reverse the priorities highlighted by these policies. For example, it could transform the Help to Buy Scheme which boosts house prices but not home building. Instead, it could offer the same £40bn in government guarantees to local authorities to build homes, at no extra cost but from which there would be an additional public sector revenue in the form both of income taxes from newly-employed builders and rental income from public sector tenants, as well as building desperately needed new homes.
The same logic applies to the whole panoply of government schemes. So, the nuclear subsidy should be scrapped and the same subsidy provided to generate renewable energy in which the state has a controlling revenue share.
III. Cutting waste All cash-strapped governments project huge savings from cutting waste which often remain unrealised. This is frequently because the biggest, most wasteful areas of expenditure are sacrosanct and not to be touched.
In Britain one of the biggest areas of wasteful spending is on the Private Finance Initiative and the generalised outsourcing of contracting and supplies by the public sector. Even George Osborne began as a critic of PFI waste and promised to replace it. Instead, in grasping how dependent private sector profits are on this subsidy from taxpayers, the Coalition has maintained PFI and expanded it. In the current and next Financial Year the level of private sector capital spending under the PFI amounts to just £3.3bn, which is only a portion of the total capital cost. Yet the private sector will be receiving £20bn in ongoing current payments over the same two-year period[iv].
This is a colossal waste, amounting to a direct subsidy to the private sector that the public sector could and has done more cheaply. New PFI could be ended, all existing contracts scrutinised for their potential to be rescinded and a new enforcement body established to apply the highest possible service conditions, again with the threat of cancelling contracts.
IV . Cutting Trident and defence spending £100bn could be saved by a decision not to renew the Trident missile system[v]. Clearly, nuclear weapons of mass destruction cannot possibly provide any economic benefit. Trident is not even an independent system, so could only be used under US authorisation and then in all likelihood only as part of a global nuclear conflagration which would have Britain as a prime target.
The notion of Britain ‘punching above its weight’ received an historic reversal with the decision not to bomb Syria. Yet British defence spending remains way above European countries, which have perfectly adequate defence. Cutting British defence spending to their average would release nearly £20bn for alternative purposes.
V. Taxation Government priorities were clear when increasing VAT but cutting corporate taxes, costing the same amount. This was a direct transfer from the poor to capital. Similarly, cutting the 50p tax rate while imposing austerity on the majority was a clear example of the logic of austerity.
Less widely remarked, the government also removed tax incentives for genuine investment while cutting the corporate tax rate. The effect was a higher rate of tax for those that do invest, and a lower one for those who do not, including the banks. All of this was done in the name of stimulating investment, which has not materialised. This is because private investment is driven by the rate of profit. Keeping a larger post-tax share of dwindling profits will not drive up private investment.
These priorities could be reversed at no cost, and no loss of investment. The tax system could be used to improve living standards and boost genuine productive investment while at the same time penalising those firms who refuse to invest but have high dividends, executive pay or share buybacks. Higher taxes on unearned income, speculation and capital gains could be combined with tax breaks for investment and lower taxes on the poor.
VI. Removing private sector subsidies A large number of private sector firms receive government subsidies for running monopoly services that can, and have been performed more efficiently in the public sector. These include, but is not confined to areas such as the railways, utilities such as water, energy, and even NHS procurement and provision.
A consequence of privatising natural monopolies is that the private firms maximise revenues simply by raising prices and cutting costs by reducing the quality of the service. At the same time, successive governments have created a system where public funds are used to subsidise the private sector firms. Removing these subsidies (guaranteed income, inflation-plus price rises, direct grants, and so on) would save both government and service users enormous sums.
The most well-known example is the privatised rail franchises, where the process of renationalising the franchises could be accelerated by a stricter insistence on the terms of the franchise contracts in terms of service, investment, fares, and so on. But a creeping privatisation has been under way for the NHS under successive governments. In 2011/12 the private sector obtained £8.7bn from the NHS for providing services, £8.3bn in secondary care[vi] and £2.8bn in drugs and other procurement for a total of just under £20bn. Detailed data is difficult to obtain, but the level of the private sector take of NHS spending will have risen dramatically under this government[vii].
VII. Renationalisation There are clear benefits in renationalising the privatised companies in terms of the government’s ability to direct investment. Higher levels of investment in turn lead to better services, lower costs and increased or better paid jobs for the workforce.
But there is also a fiscal and strategic economic benefit to renationalisation that meets the objection that a cash-strapped government must have other priorities for its limited resources. The real position is that renationalisation increases government resources and allows them to be directed to boost the economy.
This can be illustrated with the example of Royal Mail. Royal Mail pays a dividend to its private shareholders from the profits it generates and the dividend yield is 3.8% (for every £100 shares owned, the shareholder receives £3.80 each year). This will rise each year if the company grows. But the borrowing cost to the British government when it issues new debt to be repaid in 10 years’ time is currently 2.7%. Buying the entire shares of Royal Mail (renationalisation) would cost the government less in interest than it would be able to receive in dividends from the company itself. It would generate additional resources, which could be used to reduce the deficit, or better still, to increase investment on which there is an even greater return.
The same logic applies to the privatised energy and utility companies, whose dividend yields are all even greater than Royal Mail’s. There is also a strategic imperative. The energy companies have been creaming off profits since they were privatised, and not invested in either additional energy capacity or in renewables and carbon-reduction. Spare energy network capacity was approximately 25% when they were privatised and different estimates now put it at between 4% and 8%. In response to Ed Miliband’s promise of a temporary price freeze, they threatened an all-out investment strike, that they would ‘turn the lights out’. This may happen anyway in the near future, given the decline in network capacity.
This is not a situation any government should allow. Ed Miliband has committed the next Labour government to decarbonising the economy by 2030. Given the resistance of the energy companies to even a modest price freeze, and their complete unwillingness to invest on the scale necessary to meet energy requirements, renationalisation is the only realistic option. Given the huge dividend payments currently made to private shareholders (5.2% for Centrica, 5.3% for SSE) there would be a very large benefit to government finances from their renationalisation.
VIII. Living standards The focus on living standards is the correct one, and led to Labour rising sharply in the polls. Given that living standards for the majority continue to decline, it remains the right theme to focus on.
The simplest way to restore living standards for those in work is to raise the national minimum wage to the level of the living wage, and to strictly enforce it. While boosting the living standards of millions of people, the single biggest beneficiary would be government itself, since the bulk of those in receipt of social security and other government payments are in work, not unemployed. This highlights a general truth, that the interests of a radical reforming government are aligned with those of workers and the poor.
The main objection is that firms find paying the living wage unaffordable. But we have already noted the huge level of uninvested profits, executive pay and returns to shareholders. These can be cut to make it affordable. Where there are genuine cases of small, shoestring firms operating at the margin, there could be some transitional arrangements to help preserve employment. But these would only be temporary measures, and would still oblige all firms to pay the living wage. Otherwise, the effect is to allow inefficient and super-exploitative firms to compete with efficient firms that pay decent wages, embedding the ‘race to the bottom’ in the economy.
IX . Equality A similarly robust policy should be adopted in pursuit of genuine equality. The most scandalous treatment of women has been a hallmark of the austerity drive, with the pay gap widening, reduced employment, greater burdens of childcare and other household burdens, reduced public services, and so on.
Without any cost to government it could strictly enforce equal pay provisions for all firms. Again, government itself would be the largest single beneficiary of this. There is too a recognition that investing in universal childcare provides a wider economic benefit, which naturally has a positive fiscal impact. But a similar approach should also apply to the issues of all social care and reduced public services, where the burden of removing them has fallen mainly on women. The public sector is more efficient provider of these services. If the economy is being boosted by a large-scale investment programme, preventing women from taking their equal place in the workforce on equal terms is a brake on the optimal development of the whole of society and the economy.
A similar approach should inform policies in relation to the equality of black people and ethnic minorities in the economy and wider society. Black youth are living in a different country to their contemporaries, suffering Greek-style levels of unemployment. Combatting unequal pay, and inequality in terms of access to jobs, housing and education need to be central to an economic programme that attempts to utilise all the talents of its citizens. In that light, the perpetual campaign against immigration is wholly counter-productive. The strong growth produced by an investment-based recovery will both attract and require additional immigration to Britain. The alternative is to create a slum which attracts no-one.
The discriminations based on sexual orientation and on disability need to be confronted. Basic human rights are being denied causing untold misery and the whole of society and the economy is poorer as a result.
Conclusion
The 9 points above are not designed to address every possible aspect of the economic and social crisis that will confront a Labour government, and are far from an exhaustive prescription. Instead, they are designed to highlight some of the key steps a radical, reforming government could take to address the scale of the economic crisis that will confront it.
Individually, none of the measures is very radical. All governments used to engage in ‘credit direction’ before the 1970s, windfall taxes were imposed by John Major and the postal system was nationalised by Gladstone. They only seem very radical because the political spectrum has shifted so far in the direction of those who caused the current crisis.
Taken together, these measures would allow the state to lead an investment-based recovery using the main levers that are currently available to it in Britain. That would be a major reform of the British economy and of society. A more enduring transformation would require other levers and a different alignment of social forces to be pulling on them.
[i] See the paper from Victoria Chick and Sheila Dow, Financial Institutions and the State: A Re-examination (pdf)
http://www.postkeynesian.net/downloads/soas12/VC080612.pdf[ii] Under the Basel III capital adequacy rule for banks, their lending to governments has a zero risk-weighting while lending to companies has a risk weighting (requiring additional capital to be set aside) of 50% (pdf), KPMG, Basel III: Issues and implications,
http://www.kpmg.com/Global/en/IssuesAndInsights/ArticlesPublications/Documents/basell-III-issues-implications.pdf This is one of the many reasons banks are generally campaigning against the Basel III regulatory regime.
[iii] FT, UK nuclear deal with EDF could waste £17.6bn, says Brussels
http://www.ft.com/cms/s/0/ac6a7924-8a68-11e3-9c29-00144feab7de.html#axzz35Z5HVgFD[iv] UK Treasury, Private Finance Initiative Projects 2013: Summary data (pdf)
https://www.gov.uk/government/uploads/system/uploads/attachment_data/file/267590/PU1587_final.pdf[v] CND, People not Trident (pdf)
http://www.cnduk.org/images/stories/briefings/trident/People_Not_Trident_report_CND_Mar14.pdf[vi] Nuffield Trust: Public and private provision (pdf)
http://www.nuffieldtrust.org.uk/sites/files/nuffield/publication/130522_public-payment-and-private-provision.pdf
[vii] FT, Private groups invited to help NHS buy services, February 25, 2014 http://www.ft.com/cms/s/0/bcf1269c-9e1a-11e3-95fe-00144feab7de.html


Recent Comments