Uncategorized

The FT, hedgehogs and the scale of the crisis

The FT, hedgehogs and the scale of the crisis By Michael Burke

In analysis of any issue it is crucial to distinguish between factors that are of primary or decisive importance and those that are secondary or lesser matters. This applies to economic analysis as much as other disciplines. There is a vast amount of economic data which is produced by innumerable public and private agencies internationally, and an almost endless number of ways of configuring the data supplied.

The most important issue facing the British economy is how to end the slump. No other issue, employment, incomes, government finances or anything other question can be resolved without it.

Therefore it is extremely important to analyse the trends and prospects for growth in a sober fashion and to focus on the most decisive factors. It is unhelpful or even misleading to focus primarily on secondary matters.

The recent Bank of England Inflation Report contained an assessment of the trends in growth of the British economy. Chris Giles, the economics editor of the Financial Times has provided a very useful chart showing changes in the Bank’s growth forecasts over time. The chart is shown below.

Chart 1

13 05 29 Anatomy of a recession Chart 1

This is described as a ‘hedgehog’ chart because of the various lines indicating the changes to the Bank forecasts over time. Chris Giles highlights the fact that this is the first time since 2007 that the Bank has produced an improved forecast, which raises projected GDP growth from 0.9% to 1.2% in 2013. This is shown on the chart as the difference between the orange and green spikes on the chart.

In reality, the Bank’s forecasting record is an extremely poor one. The November 2007 forecast (the purple line in the chart) was made just a few months before recession began in the 2nd quarter of 2008. This was the deepest recession since the 1930s. Yet the Bank was not forecasting any contraction in output at all. The various ‘hedgehog’ spikes arise because it has continually forecast a rapid return to growth that did not materialise.

The upward revision to the forecast this year is minimal, comprising just 0.3% of GDP. For many people, and not just supporters of austerity like Chris Giles, there is a hope that this upward revision to forecasts is the beginning of a trend and that there will be a continuous upward revision of forecasts as the outlook improves.

Yet the focus on such a slight revision to the growth outlook seems misplaced, and not just because it could be altered in either direction. Even before the slump the British economy was not growing at a fast pace by international standards. A return to prosperity would imply a rejection of permanently lower growth and a return to the previous trend. Instead the Bank’s forecasts imply a further widening of the gap between the future growth of the economy and its pre-recession trend.

This is the real scale of the economic crisis and the issue which is of primary importance. Currently the gap between the level of output and the economy’s former trend is approximately 16% of GDP.

This gap will continue to widen so that any new government will be faced with a shortfall in output of approximately 20% of GDP. In current prices these are in the region of £250bn to £300bn.

This is a measure of the effects of both recession and austerity. Therefore it is also a measure of the scale of the task facing any new government that wants to end them.T Walkerhttps://www.blogger.com/profile/11107827543023820698noreply@blogger.com1

The Deepening European Crisis

The Deepening European Crisis By Michael Burke

The economies of the European Union and the Euro Area both contracted in the 1st quarter of 2013. The renewed contraction in GDP began in mid-2011 and has now run for 18 months on both cases. But, as Chart 1 below shows, the recovery from the depths of the recession in both cases was short-lived and at no point was the previous peak in activity of the 1st quarter of 2008 recovered. In reality, the European economy has been in a slump which stretches all the way back to the beginning of 2008 and is now entering its sixth consecutive year.

Chart 1

13 05 21 Chart 1

The cause of the crisis remains unaltered. Full data for all the components of GDP in the EU and Euro Area are not yet available. But comprehensive data is published up to the 4th quarter of 2012. No substantial turn in events took place at the beginning of 2013, simply an extension of previous negative trends.

In that period from the 1st quarter of 2008 to the 4th quarter of 2012, GDP in the Euro Area has contracted by €288bn in real terms. In the European Union it has contracted by €310bn. However, if the components of GDP are examined it is clear that the decline in investment more than accounts for the entire fall in GDP in both cases.

Investment (Gross Fixed Capital Formation) has fallen in the Euro Area over the same period by €362bn and fell by €461bn in the EU. In both cases this is far in excess of the total decline in GDP, and is shown in Chart 2 below.

Chart 2

13 05 19 Chart 2

Since the slump in both the EU and the Euro Area is driven by the fall in investment, the slump itself and all its economic symptoms (unemployment, falling real incomes, strained government finances, and so on) cannot be resolved without increasing the level of investment.

This would be impossible if the mantra that ‘there is no money left’ were true. But it is very far from being true. The aim and purpose of capital in a capitalist economy is the accumulation of capital.
Where that cannot be achieved capital will simply remain idle as cash balances accumulating in banks. In the latest monthly report from the ECB the currency and bank deposits of non-financial firms in the Euro Area banking system are €2,073bn and short-term bills are a further €83bn (p.143). They are considerably more when the EU cash deposits of firms in non-Euro Area are added.
The accumulation of these assets has been more or less equivalent to the slump in investment. From the end of 2007 to December 2012 currency, bank deposits and bills held by non-financial financial firms has increased by €350bn in cash terms. The refusal of firms to invest has led to a rise in their cash holdings.

Credit direction

These are assets which could be directed towards productive investment. Firms refuse to do so because they are cannot be confident about returning sufficient  profit. But the European governments could direct these assets into productive lending at both the national and supranational level. Before the era of financial liberalisation credit direction, which is the central bank or other authority directing the commercial banks’ lending, was widespread in industrialised economies.

It cannot be seriously argued that this would interfere with market’s efficient allocation of resources, not after the crisis of 2008 and 2009. The authorities also have numerous levers to ensure that credit is direct towards productive investment in infrastructure, de-carbonisation, transport, housing, education and so on).

The banks operating in Europe can only do so because their deposits are guaranteed by the state. The state also issues banking licenses. The ECB is effectively a state body and supplies all banks with needed liquidity. The authorities could direct credit by altering capital rules to favour state-guaranteed investments. Many banks are also now effectively owned by the state. Only the political will to compel bank lending to the productive sector is lacking.

EIB & EBRD

In addition, both the European Bank for Reconstruction and Development (EBRD) and European Investment Bank (EIB) have increased their net equity in the recent past, but cut their lending just when it would have most beneficial effect. The EBRD’s equity has risen by €133bn since 2010 but its lending has fallen by €89bn (p.5). In 2012 alone the EIB’s lending fell by €8bn even though its own funds increased by €13bn (pp.7 &8).

Taken together a prudent rise in the level of lending to infrastructure and other projects in both Eastern and Western Europe based on previous lending/capital ratios could provide significant funds towards an investment-led recovery.

The question of the Euro

As the crisis in Europe is determined by a refusal of the private sector to invest, and which is compounded by cuts in government investment and the investment of entities like the EBRD and EIB, it follows that only a significant increase in state-related bodies can resolve the crisis.

The latest GDP data show that the crisis is reaching into the ‘core’ of Europe. France and the Netherlands were among the countries whose economies contracted once more. Austria, Belgium and Germany only avoided recession by the narrowest of margins. This is a crisis that is engulfing the whole of Europe.

It is frequently suggested that leaving the Euro would provide a panacea for this crisis. Yet it is self-evident that not all countries can devalue against one another. Further, the argument that devaluation without increased investment will not produce a recovery requires only a one-word proof: Britain. Sterling devalued by approximately 30% in 2008 and 2009, without much of a rebound since. Yet the current account deficit has widened from -0.2% of GDP to 3.6% of GDP over that period.

Returning to earlier data on GDP growth, investment (GFCF) in the Euro Area and EU, we can now add further points on the growth of government spending and net exports. These are shown below for the Euro Area and for the EU economies outside the Euro Area as a separate group. The results are shown in Table 1. below.

Table 1. Key Economic Variable in Europe, Q1 2008 to Q4 2012, €bn

13 05 21 Table 1

The economies outside the Euro Area have contracted just like those inside the Euro Area. Government current spending has risen in both. But non-Euro countries have not had higher levels of investment. They have, on a net basis, simply gained in terms of net exports.

In this sense, the question of in or out of the Euro is a secondary one, which would not resolve the crisis either way if the investment slump is not addressed. Of course, there is a severe structural crisis in the Euro Area, which the crisis has exposed. The US has built a continental scale economy and so too has China. India appears to be heading in the same direction. The European Union has the potential to create the same.

But the Euro is an attempt to graft a 21st century monetary unity onto a 19th century patchwork of small nation states. What is required to supplement a monetary union is a fiscal union. Since that must be democratically controlled that also requires political union. In the United States, which is very far from the EU’s former attachment to the ‘social model’ fiscal transfers vary but generally comprise 12% to 15% of GDP. In the European Union they amount to around one-tenth of that. If the single currency is to be maintained then its principal beneficiaries will need to contribute to its maintenance, led by German capital.T Walkerhttps://www.blogger.com/profile/11107827543023820698noreply@blogger.com0

Ireland – trying to solve the crisis at the expense of the people

Ireland – trying to solve the crisis at the expense of the people By Michael Burke

The European Union has become the main drag on the world economy. At the end of last year the EU Commission had been forecasting GDP growth of 0.4% for 2103 for the EU as a whole and just 0.1% for the Euro Area. The recent IMF World Economic Outlook forecasts are for a second year of outright contraction, after a fall in GDP of 0.3% in 2012.

By contrast, among the worlds other large economies the IMF now expects the US to grow by a little under 2% and China to grow by 8%. Even if these forecasts prove to be slightly inaccurate they are indicative of what the IMF has rightly noted are three actual speeds in the world economy; strong growth, stagnation and contraction.

The Irish economy comprises a little more than 1% of the entire output of the EU. But it is held up as a case study in the effectiveness of austerity measures being generally applied by the IMF, EU and ECB. This is echoed and supported by the pro-austerity government in Dublin. Yet, with barely a murmur from the official media the latest GDP data confirm that Ireland went back into recession at the end of 2012, with two consecutive quarters of economic contraction. In addition, all forecasts for growth in 2013 are based on rising exports. But in the last 4 months exports have fallen compared to the same month a year ago.

Measuring success 

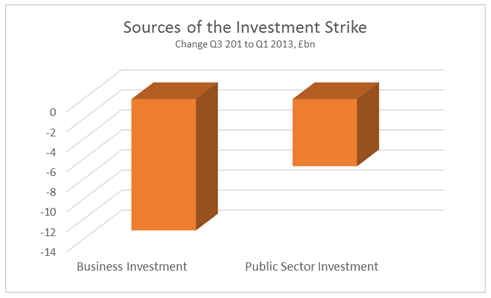
It is clear that the fall in investment remains the overwhelming source of the Irish Depression. GDP and GNP have contracted by €13.3bn and €11.9bn since the end of 2007 respectively. Investment (Gross Fixed Capital Formation) has fallen by €21bn. As elsewhere, it is an investment strike which is responsible for the slump.

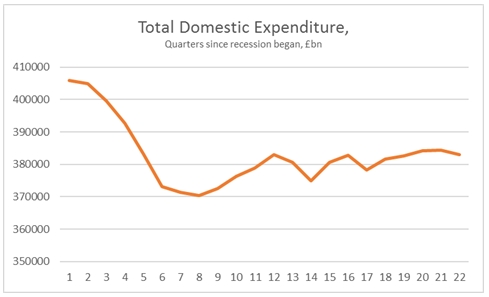
Irish national accounts are shown in Chart 1 below from the end of the boom in 2007 to the end of 2012.

Chart 1

13 05 01 Chart 1

While investment has collapsed by €21bn, the fall in personal consumption has been about one third of that, at €7.1bn and the fall in government spending slightly lower at €5.6bn. It is repeatedly asserted that the performance of exports proves the validity of current economic policy. But while the increase in net exports has been very significant, this owes more to falling imports (which are treated as a negative in the national accounts) rather than rising exports. Recorded exports have risen by €11.7bn over the period while imports have fallen by €15.8bn – and these have now begun to falter.

Investment strike

The issue of resolving the economic crisis is therefore essentially about reversing the investment slump. From that, all other questions can be resolved, such as government spending and falling real incomes.

The source of the investment strike is a broad based refusal by the private sector to invest, which embraces all sectors of the economy. It has been exacerbated by the government’s cuts in its own investment.

The purpose of capital is its own preservation and expansion, not the general public well-being, or even the growth of the economy. Without profits, or the expectation of profits, capital will not be invested by the private sector and will instead be hoarded.

It is often suggested by genuinely anti-austerity commentators that what is required is wage growth. Wage growth would be very welcome. But without increased investment it is not sustainable. This is because output only really has two destinations, either consumption or investment. If the proportion devoted to investment falls, so will the growth rate of the economy. Ultimately, the whole of output can theoretically be consumed, but this would only lead to zero growth. The OECD country with consistently the highest proportion of output devoted to consumption is Greece. The fact that the US is also close to the top of this league table is merely because the rest of the world is willing to lend it money to finance that consumption, which is not an option currently available to Greece. The major economy with the highest proportion of investment is China, which also allows it to be the economy where consumption has grown at the fastest rate.

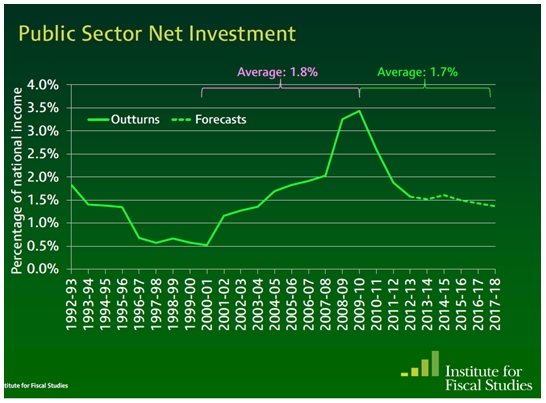
Further, industrialised economies need a high investment level simply to maintain current living standards. As each advanced economy already has a large proportion of fixed capital, so there is a rate of capital consumption (capital used in production, plus wear and tear or dilapidation) which requires investment simply in order to replace it. Currently, the proportion of investment in the Irish economy devoted to investment is just over 10% of GDP. This is approximately the same as the rate of capital consumption in the economy and means it will be impossible to sustain growth over the even the medium, let alone the long term. These are both shown in the Chart 2 below.

Chart 2

13 05 01 Chart 2

Who can pay for investment?

The international mantra of supporters of austerity is that ‘there is no money left’. But this is not the case in Ireland or anywhere else.

Data for 2012 have just been made available for wages and profits shown and are in chart 3 below. Austerity began in 2008. In cash terms the compensation of employees fell by €12.1bn over that period while the Gross Operating Surplus of firms (effectively profits before interest, taxes and other charges) has actually increased by €0.9bn. (All of these data are in nominal terms, before inflation. But inflation has been almost non-existent in Ireland over this period, so the real, inflation-adjusted level of wages and profits would be very similar).

Chart 3

13 05 01 Chart 3

This is the purpose of austerity – to transfer this reduction in incomes from capital to labour; from profits to wages. This explains why the representatives of Irish business are not up in arms over the effects of current policy and ‘falling demand’. Of course, some firms go bankrupt. But IBEC’s surviving members will not complain while profits are being restored. Austerity’s main purpose is being served – to restore profits- and to this extent, it is working.

The incomes of workers and households have declined dramatically. It is impossible for them to increase investment. But the incomes (profits) of companies are recovering. Yet their investment level has fallen, or at least it did until 2011.

There was paltry increase in investment in 2012, of just under €200mn compared to a €20.8bn decline in investment in the previous 4 years. At this rate, it would take 100 years for investment to recovery its pre-crisis levels. But it does highlight one way of resolving the crisis.

If wages and the social wage can be reduced still further, and sufficient capital can be scrapped, then the profit rate can recover. This will then encourage capital to be invested once more, which is what happened in 2012. But the very small increase in investment to date shows that the process of reducing wages and scrapping capital would have much further to run before this type of recovery can be secured. The burden of resolving the crisis is being shifted on to the shoulder of workers and the poor. It has much further and deeper to run.

The alternative is to use the levers of the state to direct idle capital towards investment; not reducing either investment or wages. These levers include the state’s own financial assets, not handing them over to creditors. They also include using the tax system to capture retained earnings, dividends and to prevent or discourage the repatriation of profits. The Government could also direct the real assets of the banks licensed in its jurisdiction, their deposits, towards productive investment with a return on those savings. Waiting for the private sector to lead a recovery will lead to poverty and immiseration for the population.

An earlier version of this piece appeared on Irish Left ReviewT Walkerhttps://www.blogger.com/profile/11107827543023820698noreply@blogger.com3

Despite Britain’s new Thatcherites, only the state sector has recovered

Despite Britain’s new Thatcherites, only the state sector has recovered By Michael Burke

The British economy is becoming more dependent on the state. This is revealed in the latest preliminary data for GDP in the 1st quarter of 2013.

The preliminary data for GDP only provide limited information – it has only a slim table of data in the preliminary release compared to 40 pages of data in the final release. The data is confined to measures of output from the different sectors of the economy. Even so the preliminary release is very revealing.

Taking the starting-point of the recession in the 1st quarter of 2008, only one sector has increased its output. This is the output of government services. It has contributed 1.4% to GDP growth over that period. The whole economy is still 2.6% below its peak level prior to the recession. Over that time the private sector as a whole has subtracted 4% from GDP. The contributions to GDP growth are shown in Figure 1 below.

Figure 1

13 04 30 Chart 1

The preliminary data itemise ten separate sectors of output. Construction has fallen by nearly 19% in the recession. Manufacturing, which comprises little more than 10% of all output, has fallen by just under 10%. By contrast the sole area of private sector activity which has almost fully recovered is business services and finance. This sector is now just 0.3% below its pre-recession peak. This is shown in Figure 2 below.

Figure 2
13 04 30 Chart 2

The revival in the business and finance sector has only been possible because of the enormous subsidies to it provided by the state. In the most recent public finances data (which is also to the 1st quarter of 2013) the total cost to the public sector of bailing out the banks has been £1,020bn.

Yet the net return on this subsidy to the private sector has been negative as the banking sector is still smaller than it was before recession. It is arguable that without the state’s support the banking sector would have collapsed entirely. But even on the most favourable comparison from the low-point of the recession the subsidy has been hugely inefficient. A £1,020bn hand-out to the banks has yielded an increase in output over that time of approximately £40bn. It would have been far more efficient if the state had directed its own capital into the production of banking services, via fully nationalised and controlled banks.

This same logic applies to all current government schemes to subsidise the private sector, and any that Labour might be considering. Currently, it is estimated that the government has already provided £43.5bn in various subsidies including the National Infrastructure Plan, the Equity Loan and Help to Buy schemes, the Enterprise Finance Guarantee and the Regional Growth Fund, with nothing to show for it. Far greater sums are in the pipeline, up to £310bn.

The state is generally a far more efficient provider of very large-scale goods and services. But it is not necessary to accept that idea to recognise the fact the currently the private sector is a drain on the finances of the state. State subsidies to the private sector are not working because the private sector’s investment decisions are determined by prospective profits. If profits are not recovering, neither will private investment. As the latest GDP data shows, currently only the state can lead a recovery. T Walkerhttps://www.blogger.com/profile/11107827543023820698noreply@blogger.com0

Economics and the debate on immigration

.647ZEconomics and the debate on immigration

By Michael Burke

Political parties in Britain have once more begun to talk about immigration, especially in the wake of the Eastleigh by-election. Unfortunately the debate is usually an all-informed one and typically just a cover to introduce racist notions about the impact of immigration. Therefore it is useful to examine some of the more important economic aspects of immigration.

Immigration

There are a number of countries in the world which have a higher per capita GDP than Britain. There are also a number of countries in the world who have a higher proportion of migrants as a proportion of the population. Both those facts are worth stating simply because discussion in Britain often seems to be dominated by the implicit assumption that Britain is both uniquely attractive to migrants and that it alone experiences immigration.

The chart below shows the countries with higher levels of per capita incomes than Britain. It also shows those countries proportion of the population which is migrant, that is not born in the host country. The table below specifies the data shown in the chart.

Chart 1

13 03 29 Chart 1

Table 1

13 03 29 Table 1

There are 13 countries in the world with a higher per capita income than Britain. Of these, 10 countries have a higher proportion of migrants. Some of these, such as Australia, Switzerland and Luxembourg have very much higher levels of immigration and have a much higher level of incomes.

There are 3 countries which have higher incomes but lower levels of immigration. However, of these 2 countries, Norway and Iceland have higher per capita GDP because they have a very large energy resource that comes pumping out of the ground (oil and geothermal energy). The remaining country is Belgium, whose geographic position means it has an exceptionally high proportion of people who work in Belgium but commute there from other countries.

By contrast, among the 18 OECD countries with a lower per capita income than Britain 12 also have a lower proportion of the population as migrants. The remaining 6 countries are small economies which generally have specific geographic or historical reasons for unusually high levels of immigration, or both. (The exception in this group is France).

Migration is part of growth

According to the IMF the total number of migrants in the world rose from 75 million people in 1965 to 195 million in 2005. Official data shows that most of that is to high income countries, about 80 million and most of the remainder to middle income countries.

The growth in the world’s migrant population is far more rapid than the growth in the total population. Over the same 40-year period to 2005, the world population doubled while the migrant population grew by 3 times.

However, this cross-border migration captures only a fraction of the world’s total migrant population. From a strict economic perspective there is little difference between cross-border migration and internal migration. This is especially the case when internal migration encompasses vast distances and differences of language or dialect.

According to China’s National Bureau of Statistics in 2008 there were 285 million internal migrants in China. This is far larger than the world’s total number of cross-border migrants. For the migrants themselves this frequently encompasses far greater geographical distances than is required, say, in intra-Western European migration. This level of migration is certainly the greatest level of internal migration in human history. It is also associated with the greatest rate of growth for any major economy in world history.

In India the level of internal migration is over 300 million people according to UNESCO. India’s medium-term growth rate is below that of China, but both countries have been growing at a rate considerably faster than the high income countries. The rate of internal migration has been a necessary accompaniment to high growth rates.

Correlation does not prove causality. But within the high-income countries higher levels of income are associated with higher levels of migration. Within the middle income countries, higher growth rates are associated with higher levels of internal migration.

Economic development depends on two key factors, the proportion of national income devoted to investment and increasing participation in the division of labour. Migration is a key part of the division of labour, allowing workers to migrate where production (and wages and jobs) are expanding. It also allows production to increase on the basis of employing the most adaptable workers.

Opposition to immigration

The government has recently produced a video to show potential migrants from Romania and Bulgaria that Britain is not a great country to emigrate to. There is a certain logic to this. The only way to stop immigration over the medium-term is to reduce the growth rate of the economy to zero or below. This is the basis for the government’s self-proclaimed success in reducing net migration in the most recent data; by curbing overseas students growth is directly reduced. Of course prolonged economic stagnation would also lead to a more rapid swelling of the 5 million British people who now live overseas.

Immigration of all types provides a substantial net benefit to the British economy, which a Home Office report clearly demonstrates. Growth attracts immigration but is also increased by it. The proportion of workers leaving a country will increases when there is an economic downturn and the proportion of the workforce arriving from overseas will tend to decrease. The reverse is also true: net immigration increases when the economy prospers.

There are a series of reactionary myths about immigration, which are perpetuated in the labour movement by outfits such as ‘Blue Labour’. These tend to focus on the supposedly local or microeconomic effects of immigration, particularly that they drive down wages. These arguments are a rehash of Labour notions which opposed the growth of women in the workforce and even supported restricting their wages relative to men.

Jonathan Portes has done very good work in countering the assertions that immigration drives down wages, even for the very lowest paid workers in Britain. As the Home Office study shows, the average wages for migrant workers in Britain are also about 5% higher than British workers, because on average they are more highly qualified. The relationship between unemployment and immigration is also equally clear; immigration increases while unemployment falls and vice versa.

Chart 2

13 03 29 Chart 2

In reality the debate on immigration in Britain is not about the economic causes and consequences of immigration at all. It is overwhelmingly a ‘debate’ that allows politicians and others to whip up xenophobia and racism, while posing as being concerned about the interests of workers or the poor. The cause of migration is growth, to which migration is a decisive contributor. The consequence is stronger growth. The contrary argument is being raised now as a reactionary diversion from the current economic crisis, and the policies which are responsible for it.

Why China can maintain 8% growth

.377ZWhy China can maintain 8% growth

By John Ross

China’s National People’s Congress (NPC) has set a 7.5% official GDP growth target for this year. Lin Yifu, former Senior Vice-President and Chief Economist of the World Bank, and one of China’s most important economists, predicts that China can maintain 8% annual growth for 20 years. A key question is evidently whether such targets are realistic. Can China maintain this type of growth rate?

The immediate negative factors are evident. The international context for China’s economy this year is bad. The Eurozone economy is shrinking, Japan is stagnant and US growth is anemic. A 16% fall in world commodity prices since their peak has led to slower growth in major developing economies such as Brazil.

China’s policy makers initially underestimated the problems in the advanced economies. Adjusted for inflation, imports by developed economies have not regained pre-financial crisis levels. China therefore did not achieve its 2012 target of a 10% trade increase – the ctual rise was 6.2%. The lower 8% trade growth target set for 2013 is more realistic if still challenging. All major motors for growth will therefore have to come from China’s domestic economy.

In terms of strengthening China’s relative international economic position, and maintaining its ranking as the world’s most rapidly growing market, all this makes no difference. China is the world’s most open major economy, so it cannot cut itself off from international trends. China’s growth rate inevitably goes up or down with global economic fluctuations – the constant is that China strongly outperforms these trends.

To give more precise numbers, a rule of thumb of over 20 years, which successfully passed the test of events, is that China grows on average at whatever the advanced economies expand at plus 6% – the greater outperformance during the financial crisis was untypical. Developed economies this year will probably grow at around 1.5-2.0%, implying China will grow at 7.5-8.0% – in line with official forecasts. This is consistent with the official target of doubling the size of China’s economy between 2010 and 2020.

But for estimating expansion of China’s market, and growth of living standards, the absolute rate at which China’s economy develops is obviously key. It is therefore worth looking beyond short term ups and downs to the fundamental factors determining how fast an economy grows. This makes clear why China will achieve its 7.5-8% growth target. It also eliminates ‘manic-depressive’ analyses of China’s economy – periodic oscillating predictions of ‘hard landing’ and ‘rampant growth’ which appear in some parts of the media.

The current infatuation with examining consumption in China’s GDP is misleading in terms of analysing its economic performance. A country’s consumption growth is overwhelmingly determined by its GDP growth – internationally 87% of consumption increase is determined by the latter. If China’s GDP grows rapidly consumption will grow rapidly. If China’s GDP growth slows its consumption, over anything other than the very short term, will be lower than its potential with high GDP growth.

Every economy’s growth, including China’s, is necessarily determined by two key parameters: how much it invests and how efficiently that investment creates growth. Taking the five year average for 2006-2011, the latest internationally comparable data, China’s fixed investment was 43.1% of GDP, and it invested 4.1% of GDP for its economy to grow by a percentage point. Consequently, as a matter of simple arithmetic, China’s economy grew at an annual average 10.5%.

The lower the percentage of GDP invested for any given economic growth the more efficient that investment is. Furthermore, contrary to some myths, China’s investment is extremely efficient by international standards as the Table shows. For example in 2006-2011 China needed to invest 4.1% of GDP to grow by 1% whereas the US invested 24.3% – China’s investment was six times as efficient in generating GDP growth as the US. Even before the international financial crisis the US invested 7.0% of GDP to grow by 1% compared to China’s 3.4%. These key numbers determine how fast China’s economy grows.

Table 1

13 03 29 Efficiency of Investment


If China’s economy is to slow, as some critics argue, then it is necessary one or both of these key parameters changes. Either China’s percentage of investment in GDP must fall or the efficiency of its investment in generating GDP growth must decline – there are no other choices.

Taking first investment efficiency, the Table shows that almost all economies were negatively affected by the international financial crisis. China was no exception – the percentage of GDP which had to be invested for its economy to grow by a percentage point rising from 3.4% to 4.1%. But this deterioration was less than for most countries – the US figure rose from 7.0% to 24.3%, Germany’s from 8.2% to 18.4%.

China’s investment efficiency would have to fall greatly not to achieve its 7.5% growth target. If China’s recent investment level was maintained then the percentage of GDP it needs to invest to grow by a percentage point would have to rise to over 5.7% before China failed to hit its growth rate target. Maintaining China’s efficiency of investment is therefore a constant challenge for the government, but China has a considerable safety margin in setting its target growth. The government’s entire focus is on maintaining the efficiency of investment, not reducing it.

The other possibility for slowing China’s economy would be a sharp reduction in the percentage of investment in GDP. There are certainly some in China advocating reducing the level of investment in GDP, but not by nearly enough to prevent China hitting its growth targets. At its present level of investment efficiency China’s GDP growth rate falls by 1% for each 4.1% reduction in the percentage of fixed investment in GDP. But in the last 5 years China’s annual GDP growth averaged 10.5%. To reduce China’s GDP growth below 7.5% requires a fall in the percentage of investment of GDP of 10%. No serious figure in China, as opposed to a few Western analysts, advocates this. A fall in investment share of 2-4% of GDP, the type of figure sometimes advocated, would only slow China’s economic growth by 0.5-1.0%.

Therefore international economic headwinds are negative. But in both the efficiency of its investment and the percentage of investment in GDP China has considerable safety margins for achieving its growth targets – unless the administration makes very large errors the growth targets will therefore be met. Indeed, looking at these margins of manoeuvre, Lin Yifu’s 8% is perhaps more realistic that the government’s 7.5% – administrations always like to announce they have exceeded targets.

*   *   *

This article is slightly edited for an international audience from one which originally appeared in Shanghai Daily.

The logic of privatisation of the East Coast mainline

.975ZThe logic of privatisation of the East Coast mainline

By Michael Burke

The Coalition government has announced its intention to privatise the East Coast mainline rail network. The network was nationalised 3 years ago when the previous private operators discontinued their franchise because they could not make a profit.

The re-privatisation of the East Coast mainline highlights a key fallacy of the current government’s failed economic policy. It also sheds light on the role of the state in resolving the current crisis.

Real aims versus stated aims

The stated aim of government policy is to reduce the public sector deficit. George Osborne has swindled and fiddled the figures in a desperate attempt to hide the real position that the deficit is actually rising, including accounting for the assets of the Royal Mail pension fund but not their liabilities, counting government interest paid to the Bank of England as income and withholding payments to international bodies. All of these devices can only massage the deficit temporarily. They cannot produce either growth or, because of that, a lower deficit.

Investment in rail could form an important part of an investment-led recovery, which would also have the effect of reducing the growth in carbon emissions. But private companies struggle because they cannot continually increase profits while very large scale investments are required. They are certainly not in the business of depleting profits further to allow investment. All the large-scale investment in rail projects over the recent past has been led and co-ordinated by government. Returning the East Coast line to the private sector will not produce increased investment.

Privatisation will also undermine the stated objective of debt- and deficit-reduction. In public hands the line has returned £640mn over 3 years to public finances. With current very low returns on capital and low government borrowing rates this represents a very sizeable return. Government propaganda is that ‘we can either invest in rail, or the NHS’. In reality, investment in rail helps to pay for the NHS.

It is possible to establish the value of the rail line which is now on the chopping block. That can be done by using Net Present Value (NPV) methods. NPV simply values all investments from the cashflows they generate. £640mn over 3 years is about £215mn each year. Currently the government’s long-term borrowing rate is just under 1.9%. So, what sum of capital would be needed to yield £215mn a year to the government when interest rates are at 1.9%? If the interest rate is 1.9% and the actual return is £215mn, the NPV is £11.3bn (that is, 215 divided by 0.019).

Therefore any sale of the East Coast franchise for less than £11.3bn is very poor value, one which will see the deficit and the debt rise faster than if it were kept in public hands. The government will be lucky to get one-tenth of that value from a private sale. The giveaway has nothing to do with growth or deficit-reduction. It has everything to do with restoring the profits of the private sector, which is the purpose of austerity.

State versus private sector

This highlights a more general point. The East Coast network is worth far less to the private sector than the public sector. It must pay a far higher rate of interest than the government, so the NPV of any major asset is lower to the private sector.

In addition, the private sector must provide a profit to shareholders. These are funds that cannot be used for necessary investment. As a result, under privatisation, the government subsidy to the rail industry (which is almost wholly for capital investment) has actually risen in real terms to £3.9bn last year from £2.75bn in the late 1980s when it was in public hands.

The private sector is unable or unwilling to make the necessary investment in the rail infrastructure. Its overriding objective is to provide a return to shareholders. The greater risks associated with the private sector mean that the state is better placed to make those investments. The real alternative, aside from government propaganda, is that the state has to fund this capital investment in either event. Keeping rail in the public sector, and taking the remainder into public ownership is simply a cheaper and more efficient option.

The same logic also applies to a series of other industries including energy, telecoms and post, house building and large-scale construction, education, and banking.

The logic of privatisation of the East Coast mainline

.407ZThe logic of privatisation of the East Coast mainline

By Michael Burke

The Coalition government has announced its intention to privatise the East Coast mainline rail network. The network was nationalised 3 years ago when the previous private operators discontinued their franchise because they could not make a profit.

The re-privatisation of the East Coast mainline highlights a key fallacy of the current government’s failed economic policy. It also sheds light on the role of the state in resolving the current crisis.

Real aims versus stated aims

The stated aim of government policy is to reduce the public sector deficit. George Osborne has swindled and fiddled the figures in a desperate attempt to hide the real position that the deficit is actually rising, including accounting for the assets of the Royal Mail pension fund but not their liabilities, counting government interest paid to the Bank of England as income and withholding payments to international bodies. All of these devices can only massage the deficit temporarily. They cannot produce either growth or, because of that, a lower deficit.

Investment in rail could form an important part of an investment-led recovery, which would also have the effect of reducing the growth in carbon emissions. But private companies struggle because they cannot continually increase profits while very large scale investments are required. They are certainly not in the business of depleting profits further to allow investment. All the large-scale investment in rail projects over the recent past has been led and co-ordinated by government. Returning the East Coast line to the private sector will not produce increased investment.

Privatisation will also undermine the stated objective of debt- and deficit-reduction. In public hands the line has returned £640mn over 3 years to public finances. With current very low returns on capital and low government borrowing rates this represents a very sizeable return. Government propaganda is that ‘we can either invest in rail, or the NHS’. In reality, investment in rail helps to pay for the NHS.

It is possible to establish the value of the rail line which is now on the chopping block. That can be done by using Net Present Value (NPV) methods. NPV simply values all investments from the cashflows they generate. £640mn over 3 years is about £215mn each year. Currently the government’s long-term borrowing rate is just under 1.9%. So, what sum of capital would be needed to yield £215mn a year to the government when interest rates are at 1.9%? If the interest rate is 1.9% and the actual return is £215mn, the NPV is £11.3bn (that is, 215 divided by 0.019).

Therefore any sale of the East Coast franchise for less than £11.3bn is very poor value, one which will see the deficit and the debt rise faster than if it were kept in public hands. The government will be lucky to get one-tenth of that value from a private sale. The giveaway has nothing to do with growth or deficit-reduction. It has everything to do with restoring the profits of the private sector, which is the purpose of austerity.

State versus private sector

This highlights a more general point. The East Coast network is worth far less to the private sector than the public sector. It must pay a far higher rate of interest than the government, so the NPV of any major asset is lower to the private sector.

In addition, the private sector must provide a profit to shareholders. These are funds that cannot be used for necessary investment. As a result, under privatisation, the government subsidy to the rail industry (which is almost wholly for capital investment) has actually risen in real terms to £3.9bn last year from £2.75bn in the late 1980s when it was in public hands.

The private sector is unable or unwilling to make the necessary investment in the rail infrastructure. Its overriding objective is to provide a return to shareholders. The greater risks associated with the private sector mean that the state is better placed to make those investments. The real alternative, aside from government propaganda, is that the state has to fund this capital investment in either event. Keeping rail in the public sector, and taking the remainder into public ownership is simply a cheaper and more efficient option.

The same logic also applies to a series of other industries including energy, telecoms and post, house building and large-scale construction, education, and banking.

John Rosshttps://www.blogger.com/profile/08908982031768337864noreply@blogger.com0

The Tories will get 29.8% of the vote at the next General Election – here is why

.834ZyesThe Tories will get 29.8% of the vote at the next General Election – here is whyBy John Ross

A lot of purely short term reasons and ‘lessons’ of the Eastleigh by-election are being drawn. None of these are of particular importance. The key reality is that crushing defeat of the Tories is simply part of the trend of Tory electoral  decline which I have analysed many times since I published Thatcher and Friends in 1983. This also enables it to be predicted that the Tory Party will get 30.3% of the vote at the next general election. This aim of this article is to explain why.

The continuing decline of the Tory vote from 1931 to 2010 is shown in Figure 1. This demonstrates that while there have been short term oscillations from election to election, which help produce individual Tory victories or defeats, the steady downward trend of support for the Conservative Party is evident. In 1983 when I first showed this it was greeted with widespread scepticism. But 30 years later the continuation of this Tory decline is evident.

Typically the Conservative vote, each time the party won a general election, was lower than at the one it won previously, and each time it lost an election its vote fell to a lower level than the previous defeat.

The result of the Tories at the 2010 election, at 36.1% of the vote, is 5.8% below the level they received the last time they were the largest party. In victories the Conservative vote has fallen progressively from its highest ever level, of 60.7% in 1931, to its post-World War II peak of 49.6% in 1955, to 41.9% the last time it won a majority of seats in an election in 1992.

The decline in the Tory vote can be calculated from a rather simple arithmetic formula. The Tory vote declines at 0.2% a year between defeats and by 0.26% a year between victories. There is a swing factor of slightly under 5% between defeat and victory. That is if the Tories won they would get 34.8% of the vote and if they lose they will get 30.3% of the vote.
John Rosshttps://www.blogger.com/profile/08908982031768337864noreply@blogger.com0

A falling pound will lower the living standards of workers and the poor

.089ZA falling pound will lower the living standards of workers and the poorBy Michael Burke

The British pound has begun to fall once more on the international currency markets. It may be further helped on its way by the loss of the AAA credit rating. This will have important domestic economic consequences.
 
The currency is also being talked down by a number of officials, effectively including both the current governor of the Bank of England and his appointed successor. Their hope is that a weaker pound will boost Britain’s woeful export performance, and perhaps lead to a revival of business investment in the export-oriented sectors of the economy.

A policy of failure

One key problem in pursuing this policy is that it has already happened in the recent past and failed. Between 2008 and 2009 the pound fell by approximately 30% against the US Dollar. Against a basket of currencies (represented by the Sterling Trade-Weighted Index) it fell by over 25%.

Chart 1

13 02 28 Chart 1

This was effectively a significant devaluation of the pound. Yet even in nominal Sterling terms, exports barely grew. Britain’s share of world export markets actually fell, from 3.5% in 2008 to 3.2% in 2012, continuing a long-term trend.

Chart 2
13 02 28 Chart 2

The effect of the devaluation was to push up the Sterling value of imports. This, combined with Coalition measures such as the increase in VAT and higher charges for transport and domestic fuel bills, pushed inflation higher.
 
Britain was the only major industrialised economy that experienced ‘stagflation’ during the crisis – that is a simultaneous economic decline or stagnation along with accelerating inflation. Using a common measure such as US Dollars for international comparison, the UK became an incredible shrinking economy, the biggest absolute decline of any major economy. Real wages and incomes also shrank dramatically, as the effect of wage freezes and welfare cuts were magnified by sharply rising prices.
 
This ought to be a lesson for all those who argue that a simple exit from the Euro and large devaluation is the remedy for the crisis-hit countries of the EU. Britain is outside the EU and experienced a large devaluation. The sole consequence was higher inflation and lower real incomes.
 
One of the reasons why membership of the Euro remains so popular even in the crisis-hit countries is that repeated devaluations punctuated the preceding decades of those economies- and failed to raise relative living standards.

Currencies and competitiveness 

Currency exchange rates are simply relative prices so that devaluation can reduce the relative price of the same or similar good. But the effects of global competition mean that an improvement in relative price competitiveness will not last if investment levels fail to match competitors.
 
This relative underinvestment is the key structural failing of the British economy. According to recent data from the Office for National Statistics productivity is 16% below the rest of the G7 and has fallen relatively by 10% during the crisis.
 
This has resulted in a structural deficit on the external accounts. The deficit on the current account, which is equivalent to the British economy’s borrowing from the rest of the world, has widened to 3.7% of GDP in the first three quarters of 2012, compared to zero in the depth of the recession.
 
Borrowing is either conducted for consumption or for investment. But as SEB has repeatedly argued, British investment has slumped. It is now just 14% of GDP. This is the cause of the slump in relative productivity, even compared to the rest of the G7, all of which have lower investment now than before the crisis in 2008.
As investment has already fallen therefore the current account deficit can only be corrected by a relative decline in consumption. This runs entirely contrary to the argument for increased consumption to resolve the crisis. But we have already seen that real wages have fallen during the crisis. This has reduced the consumption of most workers and the poor.

Who will pay for investment? 

Fortunately, there is an alternative method of reducing aggregate consumption in order to boost investment. Alongside workers’ wages and investment Marx argued that consumption was divided into necessary consumption and the consumption of luxuries. In this category may be included all items not essential to sustaining well-being, but also all items which have no production capacity. The most important of these is expenditure on armaments.
 
At £777bn the accumulated stock of profits held in cash at British banks is already a multiple of the funds required to restore all the output lost in the recession. At the same time dividend payouts to shareholders are at a record high approaching £79bn in 2012. Managerial and other bonuses (including in the City) are climbing once more. Economically, the renewal of Trident is a huge waste of resources, up to £100bn, as are increased military interventions, with lethal consequences.
 
From these multiple sources there is more than sufficient capital to increase investment and reduce consumption without in any way hurting the real incomes of workers and the poor. On the contrary, improving their living standards is both essential to and the ultimate purpose of socialist economic policy.
The obstacles to this solution are political and social. The purpose of capitalism is to preserve and expand capital, hence its name. Any policy which infringes on, let alone overturns the absolute prerogatives of capital will be resisted fiercely.
 
Instead what is currently on offer is a continuation of the long relative decline of the British economy. To alter fundamentally that path of decline would require a redirection of wasteful spending and idling capital towards investment. Instead, what is planned is a further erosion of the real incomes and consumption of workers and the poor. From that, there may eventually be some modest increase in investment. The decline of Sterling, and the inflationary effect it will produce is part of that project.