.274ZWho’s fooling who at the BBC?By Michael Burke
Robert Peston is the BBC’s new economics editor. He has opened his new role with a programme called ‘How China Fooled the World’. For a time it is available on BBC iPlayer and Peston’s own summary is here.
In the blog and the programme Peston argues that China dodged the global economic crisis by increasing investment, specifically state-led investment. But the prevailing level of investment was already excessively high, the argument runs, and merely postponing the crisis by increasing it further will only exaggerate the inevitable crash.
The strangest thing about this argument is not the misapprehensions about the Chinese economy or even the evident lack of understanding about the forces that created what is described as the Chinese ‘economic miracle’. The main fault is that Peston does not seem to grasp the mutual relations between economies, or what is the motor force of economic growth. The BBC’s economics editor is making economic howlers.
This is the most important feature of the programme. Neither what Peston nor what SEB says is likely to affect the outcome for Chinese growth. But understanding its dynamics is crucial to a wider understanding of the economy and how to address crises where they actually exist. One of the countries where there is currently an economic crisis is Britain, not China.
Growth Forecasts
The argument rests on Peston’s own forecast of an imminent economic and financial crash in China. This puts him at odds with all the main leading global economic institutions, the IMF, World Bank, OECD and so on.
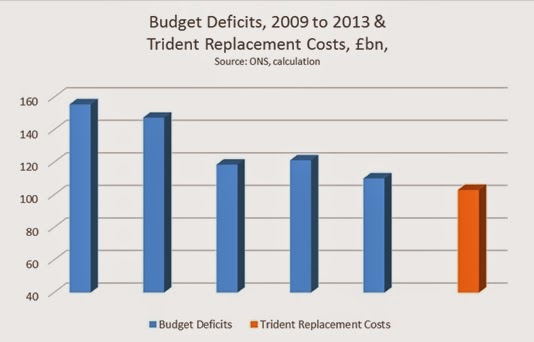
To take one example the IMF estimates that China’s real GDP growth will be 7.3% in 2014 after increasing by 7.6% in 2013. It also forecasts an increase of 7% in each of the three years from 2015 to 2018. By contrast, the IMF forecasts that British growth is stuck around the 2% rate every year until 2018, when it accelerates to 2.3%. The IMF data and projections for GDP real growth for Britain and China are shown in the chart below (Fig.1).
Fig.1 IMF data & forecasts for China and Britain real GDP Growth
It is entirely possible that the official bodies are all wrong on Chinese growth. But without making the argument on why growth is destined to collapse, Peston is simply joining the very long list of those who have wrongly forecast China’s imminent demise, some of whom have continued to do so over a very prolonged period.
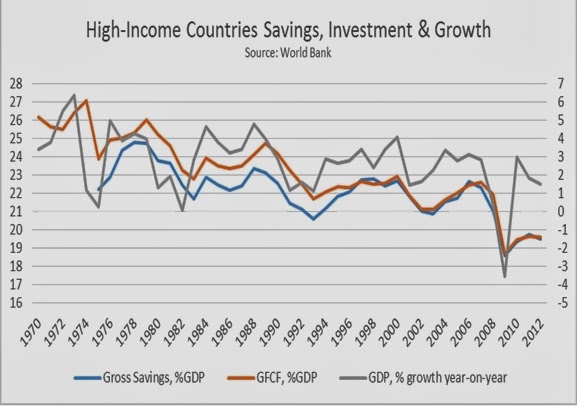
SEB is firmly associated with the view that the crisis of the British economy and of the leading Western economies in general is accounted for by the slump in investment. By contrast, Robert Peston argues that the underlying source of China’s alleged crisis is an excessive level of investment. This is a crucial question for growth and for prosperity.
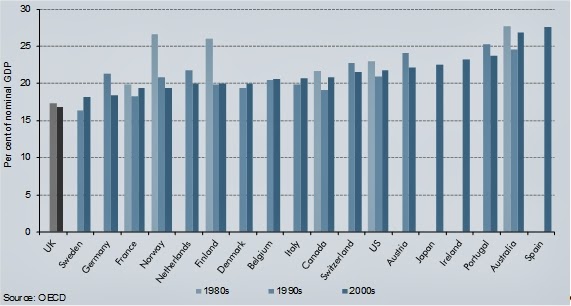
Since the reform period began at the end of the 1970s, Chinese annual investment has not fallen below one-third of GDP and is approaching 50% of GDP. Britain’s investment as a proportion of GDP has not much exceeded one-fifth of GDP for any sustained period and has declined to 14% of GDP. The relative proportions of GDP devoted to investment are shown in Figure 2 below.
Fig. 2 Investment as a proportion of GDP 1980 to 2018 (IMF forecast)
It is this rate of investment which is the main driver of growth in the Chinese economy over a prolonged period. It is a decisive element in the growth of all economies. The charge that China invests ‘too much’ does not stand up. China has steadily increased its rate of investment while in Britain it has steadily reduced.
The results are plain to see. The chart below (Figure 3) shows IMF data and forecasts for the level of real GDP in China and in Britain from 1980 to 2018, using international US Dollars at current Purchasing Power Parities.
Fig.3 Real GDP, China & Britain US Dollar PPPs
In 1980 the Chinese economy was a little over half the size of the British economy. By 1990 the two economies were at the same level and by 2000 the Chinese economy was double the size of the British economy. The IMF forecasts that by 2018 the Chinese economy will be more than 7 times the size of the British economy.
To combat any mistaken notion that this relentlessly higher investment and growth rate is at the expense of living standards, at the beginning of the reform period per capita GDP in China was just 3% of British levels. According to IMF forecasts, Chinese per GDP will be more than one-third of the British level by 2018.
To reinforce this, the Table below shows the long-term growth rate of consumption for the economy as a whole and for households in real terms, based on World Bank World Development Indicators. China has by far the fastest growth rate in consumption of any of the countries listed and of any large economy. Both total consumption and the consumption of households are shown.
Table 1. Percentage change in Consumption and Household Consumption
It is only possible to have such strong rates of consumption growth because such a high proportion of GDP is devoted to investment. It is this factor which determines the growth of the economy as a whole and from which it is then possible to raise living standards.
Increasing investment leads to increasing growth and rising living standards. While the current structure of the British economy does not allow for the rate of investment to match that of China, anything that raises British rates of investment towards Chinese levels would improve the trend rate of growth and allow the improvement in living standards.
Chinese growth can be good for British prosperity
Perhaps the strangest idea of all in the Peston argument is presented at the end of his programme and blog. Rhetorically, he asks would a weaker China be good for the West, and answers that “it wouldn’t be all bad”.
This follows from the assertion is that British manufacturers were killed off by Chinese competition. But this begs a very important question which relates to the current structure and future growth of the entire British economy. Why did many US, German, Swedish French and Italian car markers survive, even though in many cases their rates of pay are higher than in Britain? We could go further. What was it that caused the demise of steel making, ship building, mining and many other industries in Britain, long before China emerged into the global economy? The decisive factor was lack of global competiveness caused by under-investment.
Rather than address this issue, and the consequences of repeating the same mistakes, the BBC’s economics editor prefers to recycle myths that the rise of Chinese destroyed British industries. This may be very comforting but is delusional.
The pernicious consequences of an unwillingness to face reality can be seen from the simple fact that the rate of Chinese economic growth is a significant benefit to many economies, but that Britain is barely one of them. According to the British Foreign Office, in 2011 Chinese imports from the rest of the world were equivalent to £1.2 trillion, or approximately 80% of British GDP. Yet the British share of that market has fallen to 1%. This contrasts with Germany whose share of China’s imports is 5 times greater than Britain’s.
Britain could benefit from China’s growth. The question is how to realise that potential. It would require large-scale investment in key industries, in aerospace technology, business services, pharmaceuticals, the creative industries and so on. It would mean integration in global supply chains where China is sometimes a destination but also where it is a link in that chain, adding value for re-export. It would mean acquiring language skills, and would be aided by some knowledge of Chinese culture and history. All of this would boost British GDP, jobs and prosperity.
The alternative is equally clear. Britons could sit at home watching TV programmes that provide distraction from the long-term decline of Britain’s economic performance with reassuring fictions about the imminent collapse of the Chinese economy. This would be very foolish.


Recent Comments