September 2014

Austerity is on course to be a lot worse

Austerity is on course to be a lot worseBy Michael Burke

The Office for Budget Responsibility (OBR) has produced its latest assessment of the economic crisis and its impact on government finances (pdf here). In common with the UK Treasury the OBR tends to underestimate the impact of austerity policies and consequently has a persistently over-optimistic outlook for the British economy. This is no surprise as the OBR uses the Treasury economic model.
Even so the detailed analysis by the OBR is very valuable as it reflects official thinking on the economy and on economic policy. This view will continue to be shared by the OBR and Treasury beyond the next election.

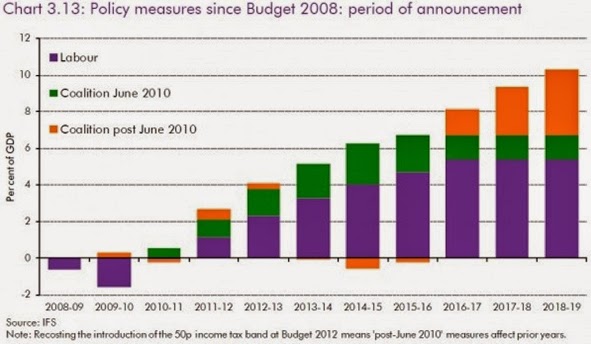
A key conclusion of the latest report is the assessment that austerity policies are set to continue for some time to come. The chart below shows the OBR’s assessment of the austerity policies and their composition from 2008/09 with projections until 2018/19. The policy measures of government spending cuts and tax change changes are expressed as a percentage of GDP.

Fig.1
Source: OBR

The OBR persists in projecting the effects of Labour policy over the entire period even though the Coalition has been in office since May 2010. Labour’s austerity measures (announced by Alistair Darling in March 2010) are shown in purple. The additional measures introduced by the Coalition in June 2010 are shown in green. The further measures after that time (beginning with the Austumn Statement in 2010 and March 2011 Budget) are shown in orange.

Currently we are approximately midway through the Financial Year 2014/2015, when the fiscal tightening rises from 5.1% of GDP to 5.6% of GDP. So the current fiscal tightening is approxumately 5.35% of GDP. By 2018/19 the OBR projects the entire austerity policy will reach 10.3% per annum.
In effect we are currently only half way through the austerity programme.

At the TUC, Geoff Tily points out that that the entire OBR analysis is based on an incorrect framework (adopted from the Treasury). This framework assumes that austerity reduces the deficit while doing little damage to the economy. Yet the OBR’s own data show this assumption is incorrect.

The data below is extracted from the OBR’s Chart 1.3 in its latest report. It shows the level of Total Managed Expenditure versus Current Receipts as a proportion of GDP during the entire period of the crisis to date.

Fig.2  Expenditure & Receipts, % GDP
Source: OBR

Since FY 2008/09 expenditure has fallen by just 0.6% while receipts have also fallen by 0.2% of GDP. The OBR forecasts that this will improve imminently, but forecasts of that type have been made ever since the OBR was established. The latest data for the current Financial Year actually show the deficit widening once more. The effect of austerity policies is to produce the weakest recovery on record while the reduction in the deficit has been minuscule. If 5% or more fiscal tightening has been required to reduce the deficit by just 0.4%, the OBR projections of further policy measures shown in Fig. 1 are likely to be a significant underestimate.

A continuation of austerity policies is unlikely to produce a different outcome. Unless there is a radical break with OBR/Treasury thinking, austerity is set to get a lot worse.

Austerity killed off improving productivity. Investment is needed to revive it

Austerity killed off improving productivity. Investment is needed to revive itBy Michael Burke

Supporters of government austerity measures have been quick to claim that recent revisions to GDP growth show a much shallower recession and much stronger recovery than previously thought. These claims are factually incorrect. The Office for National Statistics (ONS) accurately summarised the effect of its revisions as follows,

“Although the downturn in 2008-2009 was shallower than previously estimated and subsequent growth stronger, the broad picture of the economy is unaltered. It remains the case that the UK experienced the deepest recession since ONS records began in 1948 and the subsequent recovery has also been the slowest.”

The current situation for the British economy is characterised by an exceptionally weak recovery. The actual increase in output is minimal, much worse than any previous recovery. The very slow improvement in GDP is a product of more people working longer hours for less pay.

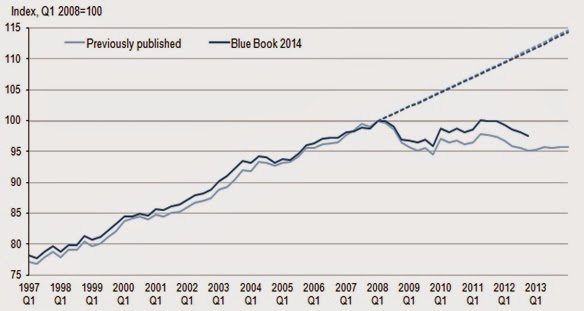
In the most recent reassessment of the data, the ONS noted the continuing exceptional crisis of productivity (the amount produced per hour of work). This is shown in Fig.1 below. The dotted line shows the previous trend growth in productivity. The unbroken light blue line shows the previous ONS data and the dark blue line shows the most recent revision.

Fig.1 Output Per Hour and trend
Source: ONS

It should be noted that productivity had been growing very moderately from the end of 2009 until the Coalition’s austerity policies began to take effect at the beginning of 2011. There has been no recovery since.

This is far worse than any previous recovery, as shown in Fig.2 . It is unprecedented in Britain for productivity to be lower than the pre-recession peak 6 years previously. But that is what the previous estimate (unbroken black line) shows. The more recent revision (broken black line) is slightly better but is unlikely to alter the main trend.

Fig.2 Output Per Hour, comparisons with previous recovery periods
Source: ONS

In the average of previous recessions and recoveries, productivity was 16.3% higher 6 years after the recession began. The complete data for the current slump is yet to be published. But if it is still below the pre-recession level (as seems likely) then the gap between the current trend in produtivity and the recovery from previous recessions could be in the order of 17% or 18%. There is also no sign of improvement.

If output per hour does not increase it is exceptionally difficult for average pay to increase. That would require a sharp rise in labour’s share of output, which is extremely rare when output is not expanding. This is the cause of the wage crisis in the British economy.

In a market economy there are also great difficulties in raising social expenditure when there is no growth in productivity. In any event is impossible to both raise wages and increase spending in education, health, transport, housing and so on if there is no increase in output per hour.

The cause of the productivity crisis is no puzzle. Just as a heavy load can be lifted much more quickly by machinery than by hand, productivity increases with the amount and sophistication of the capital machinery that is used. Cutting back on that equipment, by refusing to invest and/or letting existing machinery dilapidate will reduce output per hour. This is what has happened in Britain and many other western economies.

The argument that all that is required is increased demand is false. The final up-to-date data for the British economy will certainly show that demand, both household and government consumption have recovered since the recession. But investment has not. Increasing consumption by reducing investment is the road to impoverishment.

Private firms do not exist to satisfy demand, but to accumulate profits. Currently they remain uncertain about profits, and there is growing opposition to increased private investment.

But government has no such constraints. It can invest because the investment is necessary and reap returns not available to the private sector in the form of increased tax revenues and lower social security payments. State-led investment is needed before the crisis can be ended.