Staring in to the future by looking at Japan’s past
By Michael Burke
The G7 meeting in Tokyo ended inconclusively, with no agreement on how to lift the advanced industrialised economies out of stagnation. The venue was appropriate. It used to be commonplace to talk of a Japanese ‘lost decade’ yet the recession that generally began in the G7 and elsewhere in 2008 is now 8 years old. Without any programme to end the crisis, Western governments are following the Japanese path, with a repeat too of the failed policies of successive Japanese governments.
In reality is there has now been a lost generation in Japan. The Japanese economy has effectively stagnated for 25 years. Since the stock market and property bubbles burst in 1989, Japan’s real GDP growth has on average been well under 1% per annum. In nominal terms the economy is substantially smaller now than it was in 1997 as deflation has also taken hold of the economy, that is persistent falls in the price level.
The source of the Japanese crisis is the slump in investment. In 1990 the proportion of GDP devoted to investment (Gross Fixed Capital Formation) was 29.7%. By 2014 it had fallen to 20.3%. While GDP as a whole has crawled along since the bubbles burst, investment has fallen outright, as shown in Fig.1 below.
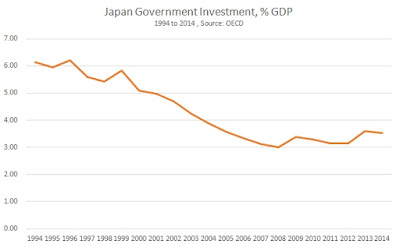
Yet bizarrely this has not prevented the growth of a cottage industry devoted to claims that the Japanese crisis is based on over-investment (pdf). Even more extreme is the notion that it is excessive investment by the Japanese public sector which has caused the crisis, or at least has been useless in counter-acting it. This reaches ludicrous proportions with anecdotal evidence about ‘bridges to nowhere’ substituting for economic analysis. This propaganda against public sector investment obscures a central fact- that Japan’s public sector investment, like investment as a whole, has been cut and is contributory factor in the investment-led downturn (Fig.2).
However, these packages typically took the form of a stimulus to consumption. Where there was any focus on increasing investment this took the form of incentives, subsidies and outright bribes to the private sector, especially to the construction sector which is one of the main funders of the LDP and in whose interests it serves. As noted above, government investment was cut. But the private sector does not consider that increasing investment is in its own interests, which would be to increase profits.
Subsequently, these packages have been supplemented by a series of apparently ground-breaking policies including money-creation, inflation-targeting, deregulation, and currency devaluation. None of this has led a to a revival of investment. Therefore the crisis is unabated.
Could it happen here?
The Western advanced industrialised economies have nearly had a lost decade of their own, from 2008 to 2015. In all cases their growth has been weaker than the initial period of Japan’s lost decade from 1990 onwards which did not begin with outright recession. This is shown in Table 1 below.
It should be noted that in all cases the fall in investment preceded the decline in GDP, often by some years. Falling investment in all cases was therefore the main factor driving recession, led by the fall in US investment.
There is no indication to date that the industrialised economies either individually or as a group are correcting this main force driving the Great Recession and the subsequent Great Stagnation. On the contrary, in all cases the proportion of GDP devoted to investment has failed to recovery its pre-recession peak (Fig.3). Even this picture may be flattering as indications around the turn of this year were that investment is once more weakening.


Recent Comments