
Britain’s lost decade By Tom O’Leary
The economic crisis which began in the 1st quarter of 2008 is now entering its tenth year. It is the longest economic crisis that anyone alive today in this country will have experienced. It is not abating. On the contrary, it is showing signs of deepening once more.
As this is such a decisive turning-point in economic life, it will have a profound impact on political life for many years to come, even long after it finally ends. The key question is how will it end?
Characteristics of the crisis
The UK economy has grown by just 8.1% over 9 years, from the 1st quarter of 2008 to the 1st quarter of 2017. This is an annual average growth rate of less the 1% in real GDP. By comparison, 9 years after the 1929 crash, the economy had expanded by 18.6%. In the UK, the current Great Stagnation is now much worse than the medium-term outcome of the Great Depression.
The driving force behind the slump is a lack of investment. Chart 1 below shows the change in real GDP and its components from the 1st quarter of 2008 to the 1st quarter of 2017.

GDP has risen by over £151bn during the crisis. While Consumption (both Household and Government Consumption combined) has risen by over £112bn, Investment has risen by just over £9bn. The decline in Net Exports is simply a function of the much greater growth in Consumption than Investment over the period – both exports and imports have risen, but imports have risen more.
There could hardly be a more striking refutation of the idea that there can by any such thing as a ‘consumption-led’ recovery. During this crisis Consumption has been rising much faster than Investment. Taking Consumption as a whole, both Government and Household Consumption, this has risen by 7.8% during the crisis, more than twice as fast as Investment which has risen by just 3.1%.
As a result, the proportion of the economy directed towards Consumption has risen and the proportion directed towards Investment has fallen. This can be illustrated very starkly by what has occurred during the crisis itself.
It is widely accepted that one characteristic of the pre-crisis period is that Consumption had been growing faster than Investment for a prolonged period. Taking just Consumption and Investment (and leaving aside net exports, inventories and accounting discrepancies) by the 1st quarter of 2008 the proportion of the economy directed towards Consumption had reached 82.5% and Investment fell to just 17.5%. However, in the crisis itself, Consumption has risen to 83.1% while Investment has fallen further, to 16.9%.
Taking the whole economy, in the crisis Investment has risen by just £9.3bn and GDP has expanded by £151.3bn. Therefore the rise in Investment has comprised just 6.2% of the rise in GDP during the crisis, down from Investment being over 16% of pre-crisis GDP. The course of the recovery has not begun to resolve the crisis. It has only deepened it.
Naturally most people do not obsess about GDP data. They do care though about living standards. These have fallen dramatically for most people. Chart 2 below shows the trend in real household disposable income.
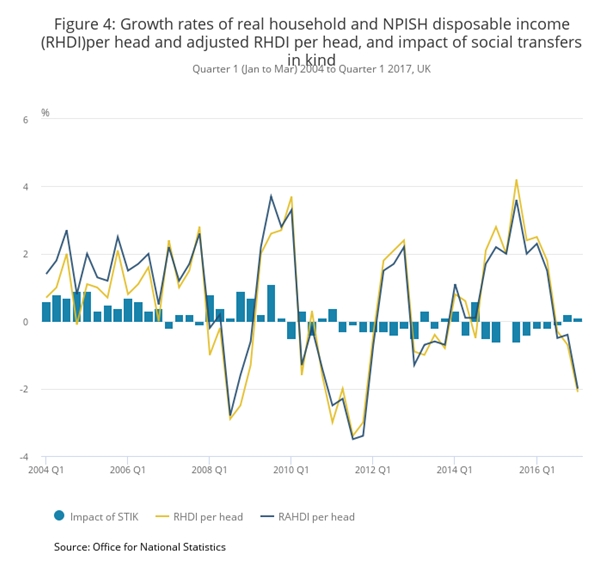
This is third episode of falling real household disposable incomes. The first was the Great Recession its in 2008 onwards. The second was austerity from 2010. We are now in third fall in incomes in a decade.
From simple arithmetic, if real GDP has risen even marginally but real household incomes have fallen sharply, this means that some other actor in the economy is gaining a greater share of GDP at household’s expense. This is the case currently, as profits are rising.
The implications of this important development will be examined in a follow-up piece.

Recent Comments