By John Ross
Note:
This article is based on Marxist economic theory and macro-economic study of Latin American countries combined with two primary direct experiences:
· The author is a specialist on China’s economy – having written over 200 articles on it, published in English, Chinese, Spanish, Portuguese, French and Russian over a 26-year period.
· He was directly involved in some economic discussion in Venezuela during the period of Chavez, including directly with President Chavez (articles related to this in Spanish and English may be found at http://thevenezuelaneconomy.blogspot.com/).
However, the author has insufficient knowledge of the detailed situation in all Latin American countries and this article does not deal with directly political issues. This article therefore only deals with certain key economic issues which can be clearly seen both in the trends in Latin America and in comparison, to Asian countries – particularly China. It is therefore circulated for discussion in the expectation of inevitable criticism and improvement – these are greatly welcome.
***
The new wave of social struggles in Latin America
Recent events in Latin America entirely refute the claim in the Western media that the right wing was carrying all before it in the continent. Certainly, the right wing in Latin America is strongly coordinated by outside forces, and the left in Latin America does not have the same advantages in easy unification and coordination – despite the great successes and achievements of the ‘pink tide’ at the beginning of the century. But the reality is that both the right and the left have very deep social roots in Latin America and that there will be a prolonged period of struggle between them. To take simply some recent key events.
· The election of the new left President of Mexico, Andrés Manuel López Obrador, popularly known as AMLO, is an important advance for the whole left internationally, especially in the Americas.
· Polls show that in Brazil Lula would win the Presidential election – which is why a fraudulent state policy is being carried out to imprison him and ban him from the election.
· A new economic crisis in Argentina has forced its neo-liberal government to humiliatingly go to the IMF – discrediting it and launching a new round of social struggles.
Confronted with this situation the Latin American right is increasingly using a strategy proposed by the US of ‘lawfare’ – that is the use of an unelected judiciary, which in reality is controlled by the right and the US, to block popular politicians.
The ‘Brazil Wire’ news service carried an excellent description of strategy noting: ‘ The US has launched a new kind of war on Latin America and it’s called “lawfare”: using the local legal system to oust unfriendly but democratically elected politicians while ignoring corruption by their allies on region’s far right.’
This noted the launching of this strategy to deal with the ‘pink tide’ of the election of left wing governments in Latin America: ‘Hillary [Clinton] gave a speech in 2009 in which she said, “having a functioning democracy isn’t enough in Latin America, we have to support these countries to have strong, independent judiciaries.”’
This strategy also drew on the experience of the right wing in Italy, where similar methods were used a decade earlier to install entirely corrupt governments which carried through massive privatisations. There is a direct link of this to the Lava Jato (Car Wash) campaign being used against the left in Brazil: ‘in 2004 Lava Jato’s inquisitor judge Sergio Moro published a paper called “Considerations of Mani Pulite”, his interpretive thesis on the 1990s Italian – with US cooperation – anti-corruption probe which decimated Italy’s political order, in particular its center-left, and paved the way for both the political emergence of Silvio Berlusconi, the most corrupt leader in its history, and a wake of privatizations of its massive public sector nicknamed “the pillage of Italy”. Mani Pulite in particular, its use of the media to whip up public indignation and support of convictions served as the prototype for Moro’s own operation Lava Jato, launched a decade after his paper…. this new intensified order of privatization, all starting with a scam corruption trial causing media indignity and the overthrow of democratically elected governments with social welfare programs, only to be replaced by truly corrupt leaders who sell off all the goods’’
The bias in such right wing campaigns was blatant: ‘two of the former presidential candidates from the conservative PSDB party, which is the main conservative opposition to PT in Brazil and a long time friend of the United States, have been implicated in tens of millions of dollars worth of bribes with audio and video evidence and had all charges thrown out against them, even though you can just go online and see the evidence yourself, whereas ex-president Lula was given a 9.5 year prison sentence for supposedly receiving $200,000 worth of reforms on a luxury apartment that the prosecutors and judges – who are the same people in this investigation – cannot prove that he ever owned or set foot in. There’s no proof. Lula himself recently said in a speech, “the least they could do is give me the deed to this place.” So it is very selective. You don’t see any politicians from the conservative PSDB party going to jail in Brazil over this…
‘there is a general consensus among the majority of the Brazilian people that this is a witch hunt against Lula. The majority of the people consider him to be innocent. 96% of the Brazilian people reject the Coup president Michel Temer. He’s got a 4% approval rating. And I would also say that most people, probably slightly over a 50% majority, believe that Lava Jato is a witch hunt targeting the PT party, that has had disastrous results for the Brazilian economy.’
The aim of this ‘lawfare’ is to prevent left wing politicians running for office who would be elected, or to attempt to block them in general from campaigning on policy within their countries. This anti-democratic ‘lawfare’ has seen:
· Lula blocked from running for president in Brazil – as already analysed.
· In Argentina former left President Cristina Fernández de Kirchner has been charged with treason, a crime punishable by 10 to 25 years in prison. The right-wing government, in office since 2015, was already unpopular before it signed a bailout deal with the IMF and its support is expected to further decline. Kirchner would be a strong candidate for next year’s Presidential election, so the aim is to block her from running.
· On 3 July the National Court of Justice of Ecuador ordered the preventive detention of the country’s former President Rafeal Correa and requested that he is extradited from Belgium where he is currently living.
Confronted with this assault on democracy and social progress the first and unconditional requirement is international solidarity from progressive forces in every country.
The second issue, however, is preparation of the struggles by an analysis of the strengths and weaknesses of the previous ‘pink tide’ in Latin America – the series of left wing governments that were elected across the continent from 2000 onwards.
The strengths of these progressive governments are well known. They bought about a radical reduction in poverty, inequality and increase in popular living standards. This ‘revolution in distribution’ was the common achievement of all of them and a tremendous contribution to progress both in the continent and globally. But objective analysis shows that only in certain cases was this accompanied by a ‘revolution in production’ – that is the ability to protect their economies from the downturn in international commodity prices which started in 2014 as an aftermath of the international financial crisis. It is therefore useful to examine the different experiences and the reasons for them in terms of economic policies. The main economic examples will be analysed in turn.
Political success and economic success – Bolivia and Nicaragua
The most combined experience of both continuing economic and political success, the two of course being interrelated, was in Bolivia and Nicaragua. In both cases the left has retained political power. The economic record of the left governments in these countries is shown in Figure 1
· In Bolivia Evo Morales was elected President in December 2005 and has been re-elected to office ever since. The Bolivian economy has grown in every year since Morales was elected with the total expansion of per capita GDP up to the end of 2017 during his term being 46% with an annual average growth rate of per capita GDP of 3.2%.
· In November 2006 Daniel Ortega was elected President of Nicaragua and has been re-elected to office since. The Nicaraguan economy has grown in every year since Ortega was elected with the exception of 2009 when it was hit by the international financial crisis. The total expansion of per capita GDP up to the end of 2017 during Ortega’s turn in office has been 38% with an annual average growth rate of per capita GDP of 3.0%.
This relatively smooth and substantial economic growth, of course, significantly underpins, and helps explain, the political success of the governments in Bolivia and Nicaragua.
If the reason for this impressive economic success in Bolivia and Nicaragua is examined, its key macro-economic factor is shown in Figure 2 – the significance of this will become even clearer when less successful cases are analysed.
It should be recalled that GDP is divided into two parts:
· Inputs into production, that is investment – in Marxist terminology Department 1 of the economy
· Consumption which, by definition, is not an input into production – Department 2 of the economy in Marxist terms.
As ‘nothing can come from nothing’, only inputs into production can increase economic output. Figure 2 shows how an increasing proportion of the economy devoted to fixed investment underpinned Bolivia and Nicaragua’s economic growth.
· The percentage of fixed investment in Bolivia’s GDP rose from 14.3% to 20.8%.
· The percentage of fixed investment in Nicaragua’s GDP rose from 24.9% to 30.1%.
This high/rising percentage of fixed investment in GDP is in line with the pattern, as will be shown below, of the successful Asian socialist economies such as China.
To summarise, Bolivia and Nicaragua both carried out not only a ‘revolution in distribution’ but also a ‘revolution in production’ – sustained increases in economic growth even when faced with negative trends such as the fallout of the international financial crisis and the decline in commodity prices after 2014. This is a decisive factor underpinning both their economic and political success.
Economic success, political defeat due to betrayal– Ecuador
Ecuador constitutes a special case in Latin America in that the political setback came from treachery from within the camp of the left.
Rafael Correa was elected President in December 2006. He was re-elected President to three terms as president until 2017. His successor, Lenin Moreno, was the nominee of Correa’s party Alianza País. However, in office Moreno subordinated the country to the US. To attempt to block Correa’s support in the country the fraudulent arrest warrant already noted was issued in July 2018.
Despite great economic obstacles in Ecuador, which does not even have its own currency but uses the US dollar, great economic and social progress was made under the Correa government as clearly summarised by the US Center for Economic and Policy Research (CEPR).
· Annual per capita GDP growth during the past decade (2006–16) was 1.5%, as compared to 0.6% over the prior 26 years.
· The poverty rate declined by 38%, and extreme poverty by 47% percent. The reduction in poverty was many times larger than that of the previous decade.
· Inequality fell substantially, as measured by the Gini coefficient (from 0.55 to 0.47).
· The government doubled social spending, as a percentage of GDP, from 4.3% in 2006 to 8.6% in 2016.
· Public investment increased from 4% of GDP in 2006 to 14.8% in 2013, before falling to about 10% of GDP in 2016.
This increase in the proportion of fixed investment in GDP in Ecuador can be seen in Figure 2 above – it rose from 20.9% of GDP in the year before Correa was elected to a peak of 27.6% of GDP in 2013.
In 2015-2016, in addition to problems created by the increase in the exchange rate of the dollar, with no ability to devalue, Ecuador was struck by severe natural disasters such as the eruption of the Cotopaxi volcano and the El Nino phenomenon and, most substantially, the severe earthquake, which killed at least 676 people with over 16,600 injured and which by itself had a negative impact of 0.7% on GDP. This led to the necessity in the short term to devote more of the economy to consumption, in order to maintain the population’s living standards, but there was no confusion on the fundamental strategy of increasing the level of investment in the economy. This simply tactical shift was politically successful in ensuring the election of the candidate of the Alianza País in the 2017 Presidential election.
Overall the development in Ecuador therefore was an economic success but culminating in a political defeat due to treachery by Correa’s successor Lenin Moreno.
Economic inability to deal with the effects of the decline in commodity prices creates political setback – Brazil and Argentina.
Brazil and Argentina were the two biggest countries in Latin America in which the left came to power, before AMLOs recent victory in Mexico – being respectively the largest and fourth most populous countries in the continent, and its largest and third largest economies.
· Lula was elected president of Brazil in October 2002. He was succeeded in 2011 by Dilma Rousseff who won re-election in 2014 until being removed from office by a fraudulent ‘constitutional coup d’etat’ in August 2016 – with Temer becoming president, whose current approval rating is 4%.
· Néstor Kirchner became Argentina’s president in May 2003. He was succeeded by Cristina Fernández de Kirchner who remained in office until the right winger Macri was elected president in December 2015.
The economic dynamics in Brazil and Argentina are shown in Figure 3
· In Brazil, under the left government, the economy grew steadily until 2013. Per capita GDP in 2002-2013 rose by 33%, an annual average 2.6%. However, from 2014-2016 Brazil’s per capita GDP fell sharply by 9%.
· In Argentina per capita GDP grew by 58% from 2002-2011 – an annual average 5.2%. However, after 2011 GDP growth stalled and by 2015 per capita GDP had fallen by 3% compared to 2011.
Such a negative economic trend in the final periods of the left governments in Brazil and Argentina necessarily undermined their support. While they had made a ‘revolution in distribution’ delivering great progress for the population of their countries, they unfortunately did not succeed to make a ‘revolution in production’ – that is the ability to develop an economic policy capable of continuing substantial economic growth when faced with economic difficulties such as the aftermath of the international financial crisis or the fall in commodity prices.

Major political difficulties faced these governments – for example in Brazil the PT did not possess a majority in the legislature and the 1990s had seen many aspects of neo-liberalism institutionalised in the Central Bank and other bodies. Very negative economic circumstances were also inherited by Brazil’s left-wing government in exceptionally high interest rates and an overvalued exchange rate. Nevertheless, confronted with such strong objective difficulties, compared to positive examples in Latin America and the experience of China, it appears there was an insufficiently clear perspective on strategic macroeconomic direction which had negative consequences when the period of high commodity prices came to an end.
Turning to the explanation of the difference between the left wing governments which achieved both economic and political success and Brazil and Argentina, this can be clearly seen by comparing Figure 4 below with Figure 2 above.
· In Brazil the percentage of fixed investment in in GDP did rise significantly from 2003 to 2013 – from 16.6% of GDP in 2003 to 20.9% of GDP in 2013. However, from 2014 onwards it was allowed to fall, dropping to 16.4% of GDP by 2016.
· In Argentina the increase in fixed investment was shorter lived than in Brazil– from 15.1% of GDP in 2002 to 19.5% of GDP in 2007, before falling to 15.8% of GDP in 2015.
Therefore, whereas in Bolivia and Nicaragua, and for most of the period of the left government in Ecuador, the percentage of fixed investment in GDP rose continuously, underpinning economic success, no comparable scale of increase took place in Brazil and Argentina. This meant that Argentina and Brazil were not so capable of resisting the negative economic trends unleashed by the aftermath of the international financial crisis and the fall in commodity prices.
A special case Venezuela – the left in political power but problems in the economy
Venezuela constitutes a special case in Latin America. Chavez was elected president in 1998 and assumed office in February 1999. Initially he faced great opposition from capitalist control of the state oil company PdVSA, the overwhelmingly dominant economic resource in Venezuela, which created great economic difficulties. But the popular uprising of April 2002, to defeat the attempted anti-Chavez coup d’etat, by destroying capitalist control of the army, transferred the centre of state power into the hands of the working class. The working class has retained state power in Venezuela until the present – a great victory. In December 2002-2003 Chavez defeated the management strike in PdVSA – thereby for the first time securing firm control of the country’s most important economic institution.
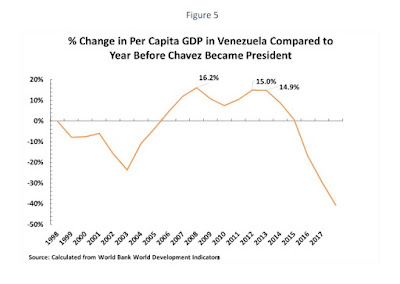
These victories were followed by rapid economic expansion in Venezuela. Between 2003 and 2008 per capita GDP rose by 52% – an annual average 8.7%. Despite a moderate economic setback in 2008-2010, due to the impact of the international financial crisis, recovery then took place and in 2013 Venezuela’s per capita GDP was still 50% above its 2003 level – an annual average increase over that period of 4.1%. Chavez died in March 2013 and was succeeded by Nicolas Maduro who has remained President until the present.
From 2013 onwards, however, Venezuela’s economy sharply contracted primarily with both a fall in the price of oil and a decline in oil output. By 2017 Venezuela’s per capita GDP was 39% below its level of 2013 and 8% below its level of 2003. This economic contraction, whose social consequences were greatly exaggerated in the Western media, did not prevent the working class retaining power, with Maduro securing re-election in 2018. But it undoubtedly lowered support for the government, with Maduro’s voting falling by 1.3 million between 2013 and 2018. The economic situation in Venezuela was identified by Maduro as a key issue to address. These overall economic dynamics are shown in Figure 5.
Turning to analyse these trends in Venezuela they are greatly affected by the oil price – shown in Figure 6. The key Venezuelan macro-economic variables, fixed investment and saving, are shown in Figure 7.
For most of the period of Chavez presidency Venezuela was sustained by a sharply rising oil price – which rose from $12.2 on 1 February 1999, the date of Chavez inauguration as president, to an all time high of $145.3 on 3 July 2008. There was then a very severe fall during late 2008 and 2009, due to the international financial crisis, but by 29 April 2011 the oil price had recovered to $113.9. It was still $105.7 in July 2014. After that, however, in line with other commodity prices, the oil price fell sharply reaching a minimum of $26.2 on 11 February 2016. It then recovered to over $70 by July 2018. These trends are shown in Figure 6.

The results of the very high oil price during most of the period prior to 2014 was to create a very high level of total savings in Venezuela – total savings are equal to savings by companies, savings by individuals, and saving by the government. This very high oil price created very high company savings – total savings in the Venezuelan economy reached 42% of GDP in 2007.
As investment is financed by savings such a high level of savings would have permitted a very large increase in fixed investment in Venezuela, of the type seen in Bolivia, Nicaragua, or Ecuador – or of the type seen in China as analysed below. But although fixed investment in Venezuela recovered from their extremely low level of 2003 they never reached even the level of 1998. That is, Venezuela was not transforming its savings into fixed investment – as were, in contrast, Bolivia, Nicaragua, Ecuador or China. These trends are shown in Figure 7 – data in an internationally comparable form is only available up to 2013.
Without a high level of investment Venezuela’s economic growth could not be sustained in the face of the downturn in international commodity prices after 2014, and, even more directly damaging, without a high level of investment the rate of production of oil could not be maintained.
Therefore, Venezuela did not follow the successful economic path of Bolivia, Nicaragua, and Ecuador. This economic failure, as already noted, had a negative effect on the situation of the government – despite the overall great political success of retaining state power.
China
Finally, in addition to noting the positive lessons from Latin America, it is worth making a comparison of these experiences in Latin America with the successful socialist economy in China – as China’s experience and progress is still considerably underestimated in parts of Latin America.
In the almost 40 years since the beginning of China’s economic reform China’s economy has grown every year without exception. Its annual per capita GDP has increased on average by 8.4% a year over the 39-year period from 1978-2017. China experienced no serious economic crisis following the international financial crisis beginning in 2008.
As a result of that growth China has changed itself from a situation where in 1980 every country in Latin America had a higher per capita GDP than China to one in which by 2017 China had a higher per capita GDP than every country in Latin America except Panama, Chile, Uruguay, Argentina, Mexico and Costa Rica – China overtook Brazil in 2016. By 2023, on IMF projections, China’s per capita GDP will also overtake Mexico and Costa Rica.
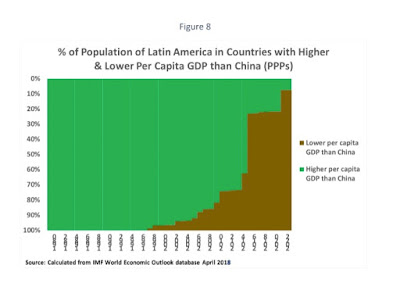
Translating that into terms of the percentage of the population of Latin America, as Figure 8 shows:
· In 1980 100% of the population of Latin America lived in countries with a higher per capita GDP than China.
· By 2017 only 23% of the population of Latin America lived in countries with a higher per capita GDP than China and 77% lived in countries with a lower per capita GDP than China.
· By 2023, on IMF projections, only 7% of the population of Latin America will live in countries with a higher per capita GDP than China and 93% will live in countries with a lower per capita GDP than China.
To understand the scale of this transformation, however, it must be understood that China is far larger than Latin America – China’s population of China, at 1.4 billion, is more than two times that of the continent of Latin America.
Figure 9 therefore looks at the combined population of China and Latin America and notes the percentage of that combined population with per capita GDPs above and below China’s – that is, in a sense, it treats China as though it were a Latin American country for purposes of comparison. This shows that as recently as 1997 every country in Latin America, and therefore 100% of the population of Latin America, lived in countries with a higher per capita GDP than China. But, as already noted, by 2017 only 23% of the population of Latin America lived in countries with a higher per capita GDP than China and 77% lived in countries with a lower per capita GDP, while by 2023, on IMF projections, only 7% of the population of Latin America will live in countries with a higher per capita GDP than China and 93% will live in countries with a lower per capita GDP. As a result of this development China achieved the fastest increase in living standards of any major country.
In short, due to its economic policy, China has transformed itself from a country poorer than any in Latin America to one with a higher per capita GDP than all except the very richest Latin American countries. In particular it has overtaken Brazil in per capita GDP.
What, therefore, explains this extraordinary economic development in China and how does it interrelate with the lessons from Latin America? Figure 10 shows the similarity of China’s macro-economic development to the most economically successful left run governments in Latin America – Bolivia, Nicaragua and Ecuador. It shows that China’s growth, like theirs, was underpinned by a sustained and considerable increase in fixed investment. The contrast to the failure to raised fixed investment in a sustained way in Brazil, Argentina, and Venezuela is clear.
Conclusion
The lessons of the advance of the left in Latin America from 2000 onwards, during the ‘pink wave’, was one of the most inspiring and progressive in human history. The lives of many millions of people were improved.
It is also a complete myth, spread by the right, that the right wing has swept all before it. On the contrary the continuing success in a number of Latin American governments, the new left victory in Mexico, continuing struggles in Brazil and Argentina and elsewhere show that the left, as well as the right, has deep social roots in Latin America. The fact that the right in Latin America has to resort to ‘lawfare’ is precisely because it believes that if a democratic process were allowed to unfold the left would win.
At the same time, to confront the new round of struggles, it is necessary to draw lessons, both positive and negative, of the previous wave of struggles in Latin America. A key part of that is to draw the economic lessons. Study both of the successful examples in Latin America and of the socialist economy of China is crucial for this.
***
The above article was originally published here on the Brazilian website Opera Magazine










Recent Comments