By Michael Burke
There are widespread hopes that the surge in prices may be coming to a halt. Yet there is little evidence to support them. There is very little to suggest the main driving forces of global inflation are receding. This can be shown factually in a few graphics.
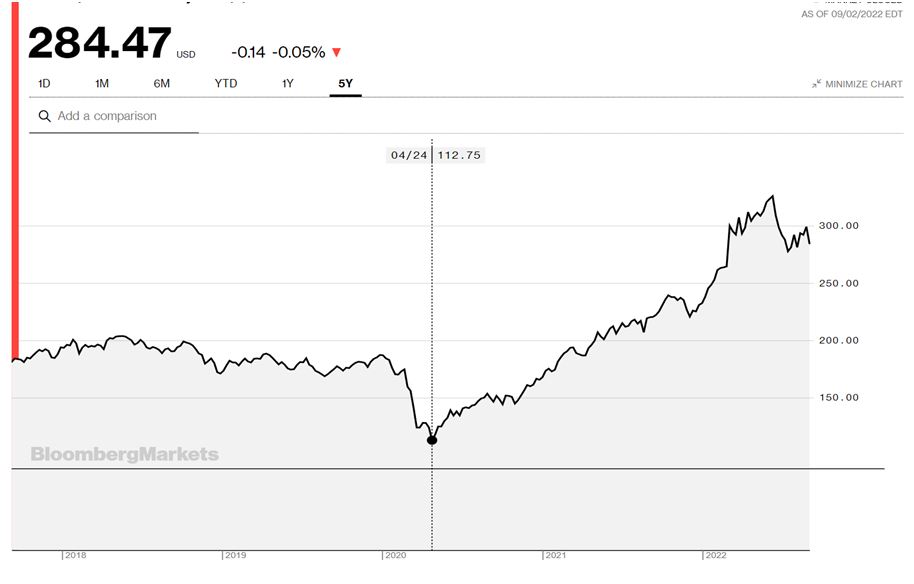
The main causes of inflation have nothing to do with the war in Ukraine. The chart below shows an index of globally traded commodities. It is clear that the surge in prices began in April 2020, while the current military conflict in Ukraine began on February 24 this year.
Chart 1. CRB Commodities’ Index, last 5 year
Source: Bloomberg
SEB has previously argued that the impulse for the inflationary wave was provided by an extraordinarily reckless US economic policy. This combined an unprecedented growth in money supply with an equally unprecedented rise in US government Consumption. This was also timed for the synchronised exit from lockdown that was taking place in early 2020 in the main Western economies. It also came after a prolonged period of low or falling Investment in those same economies.
This was almost a textbook case of causing inflation by printing money and stimulating Consumption without anything remotely like a corresponding rise in Investment. As in the textbooks, this led to inflation.
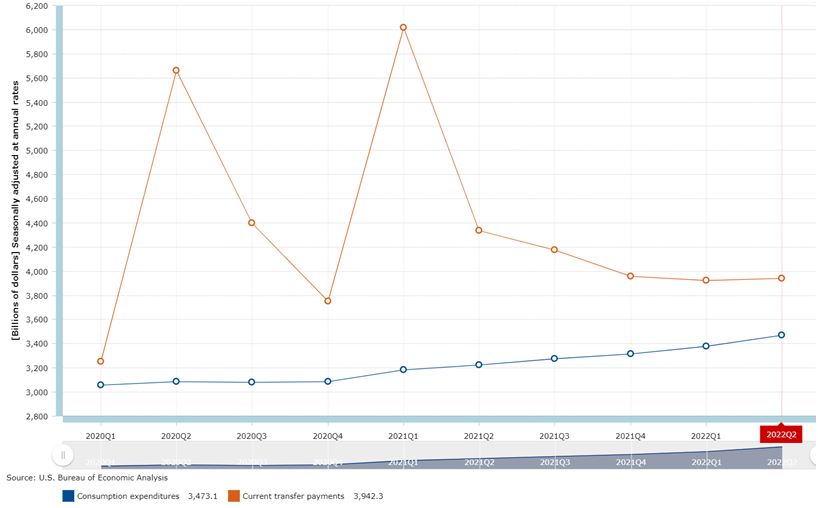
The first of these factors can be seen in Chart 2 below, which shows the main components of US Government Consumption Expenditures from the beginning of 2020 onwards.
Chart 2. US Government Consumption Expenditures, $bn
Source: BEA
Before the policy began, the combined US government outlays on Consumption Expenditures and Current Transfers totalled $6.3 trillion. The largest inflationary impulse came from an increase in this total the 1st quarter of when the combined total of outlays was $9.2 trillion. This level of spending has subsequently receded, but at $7.4 trillion remains way above the starting point at the beginning of 2020.
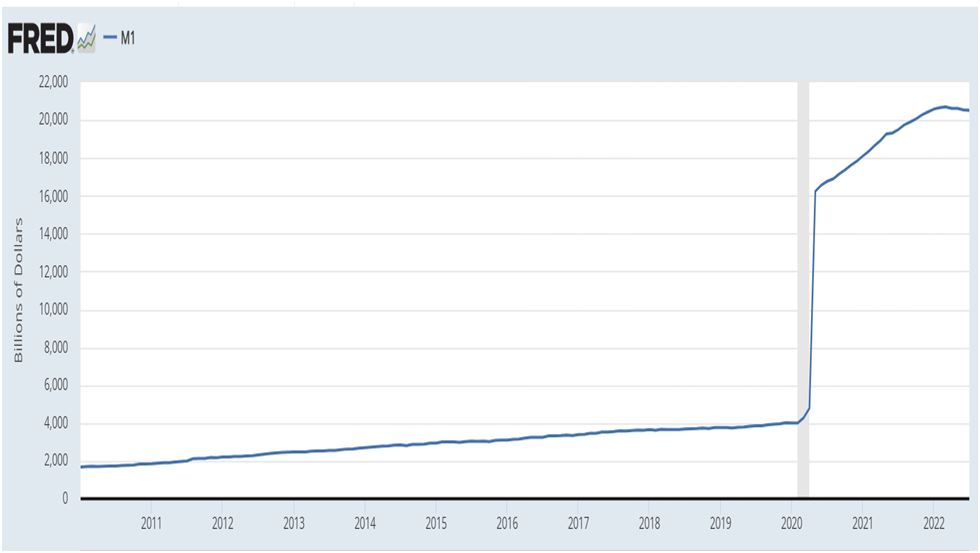
The inflationary trend is reinforced by the exceptional growth in US money supply, as shown in the chart below. The exceptional pace of growth in the supply of money can be illustrated by the point that it took 10 years for US M1 money supply to double from $2 trillion to $4 trillion. But M1 money supply rose from $4 trillion in February 2020 to $20.7 trillion in March 2022, over 5 times larger in little more than 2 years.
Chart 3. US M1 money supply, US$ billions
Source: FRED
The level of money supply has since edged lower, down to $20.5 trillion. It is probably not prudent to withdraw this money at the same reckless pace it was created. But the consequence of such exceptionally high level of money supply circulating in the economy will be to reinforce inflationary pressures for some time to come.
As already noted, the same note of caution applies to US Government Current Expenditures. They have fallen back but remain at a level likely to support inflation rather than suppress it.
Crucially, none of this has huge stimulus to spending has led to increase in Investment. Increasing the means of production through Investment is the only method for raising the level of output up to the inflated levels of government Consumption and money supply growth.
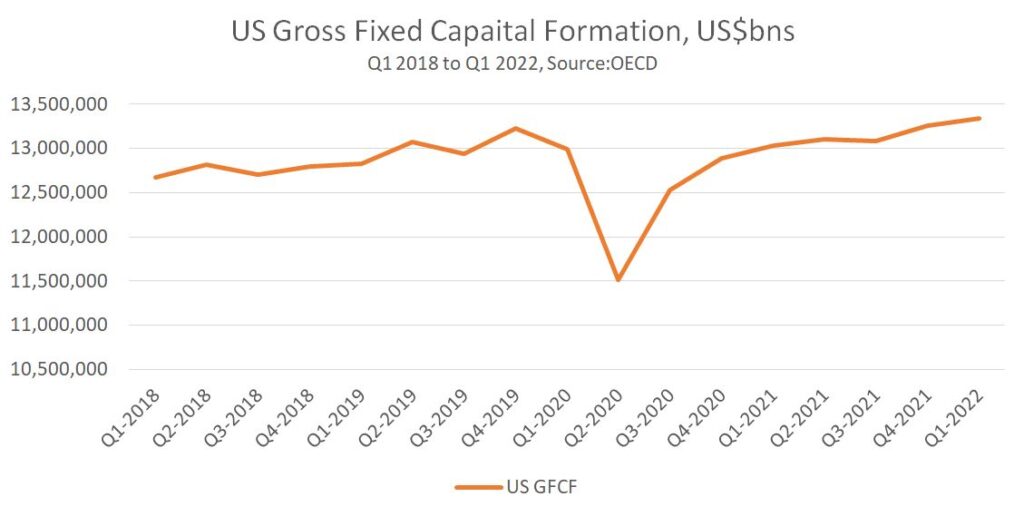
As shown in Chart 4 below, over the 2-year period from the 1st quarter of 2020 to the 1st quarter of 2022, the total level of Investment (Gross Fixed Capital Investment, GFCF) has risen by just 2.6%. There has been almost no increase over that period in the means of production (especially when the rate of depreciation is considered). As the consequences of this completely negligent US economic policy are euphemistically described as ‘bottlenecks’, this highlights there is limited spare capacity slack in the economy to prevent prices rising further.
Chart 4. US Gross Fixed Capital Formation, US$ billions, 1st Quarter 2018 to 1st Quarter 2022
Source: OECD
Finally, it is important to note the impact of central bank monetary policy, as interest rates are generally being increased in the Western economies in a misguided attempt to dampen inflation. Because those price pressures are caused by an economic policy which has created a huge imbalance between supply and demand, interest rate rises are an attempt to correct that imbalance by suppressing Consumption.
The central bankers explicitly state they aim to suppress wage growth below inflation. This will mean adding to the risks of slump and amount to a redistribution of wealth and incomes from workers and the poor to the profitable and to the asset-rich.
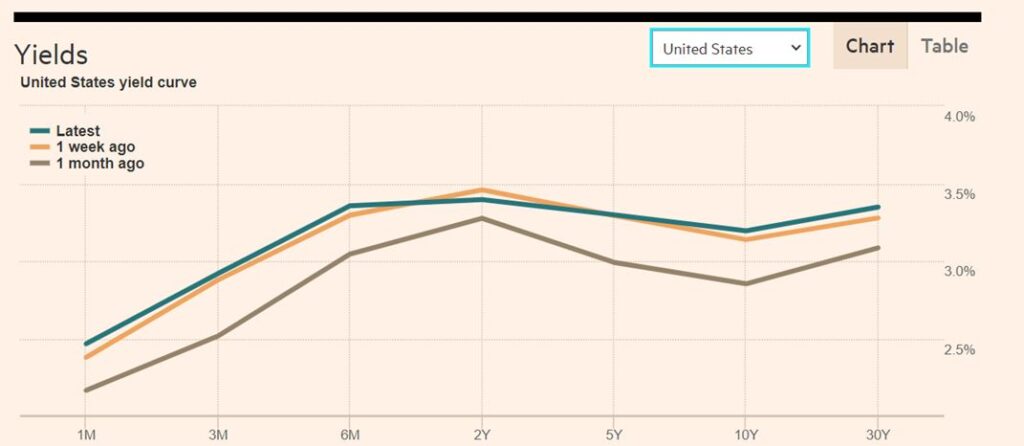
In addition, for those with access to credit, real interest rates remain extraordinarily low. Chart 5 below shows the US government yield curve, which is the interest rate payable on US government bonds from 1 month out to debt that matures in 30 years.
One of the key benefits for the US of the US Dollar dominance in global trade is mirrored in global financial markets, with the US setting the floor on global interest rates for most countries (the main exception being Japan).
Chart 5.
Source: FT
There is no part of the US government yield curve where interest rates are currently more than 3.5%. Yet US CPI inflation is currently 8.5%, meaning that interest rates in real terms are -5%. For anyone who can borrow at interest rates close to these levels in real terms, credit is exceptionally cheap.
However, this is available only to those with the best credit ratings, big businesses and the very rich. In practical terms, while most of the population is suffering a sharp fall in real incomes, the financial markets operate in such a way that only widens class divides and deepens the upwards redistribution of wealth and incomes that is currently taking place.
Yet the best credit ratings of all, and the cheapest borrowing costs still belong to government. The Western governments could slow and then reverse the surge in inflation with a massive level of Investment in the productive economy. The imbalances between Investment and Consumption could be ended by a very large increase in Investment, rather than suppressing Consumption.
But that would significantly increase the role of the State in the productive economy and lessen the dominance of the private sector. This is not at all the current policy programme, and is in fact its opposite.


Recent Comments