In Britain, Marxist economics is not very popular, even among Marxists. Instead, an eclectic mix of ideas prevails. Beginning with an objective analysis of the current state of the economy, the framework here is that Marxist analysis cuts through the popular misconceptions on the economy and addresses the sources of the current crisis.
It is now possible to argue that a chronic British crisis is becoming an acute one.
It is widely understood that historically, Britain was the dominant economic power in the world. That period lasted effectively after defeat of Napoleon and from 1820 onwards to 1870, when relative economic slowdown began. For a long time, this trend was obscured by the existence of the British Empire. It seems that in the minds of many, it still is. The cause of the decline was that British capitalism found more profitable outlets for investment internationally, where it could use superior technology and/or brute force to win and dominate new markets. The Empire meant that the potential for profits in the domestic market was always going to struggle to compete with starvation wages in the colonies.
This became the ‘British disease’, the lack of private investment and the inevitable economic relative decline that followed. That is the long history.
But this is also extended through to the current crisis. The chronic relative lack of investment has now become acute. In 6 years since the 1st quarter of gross 2019 private sector investment has risen by just 8.7%. This is barely 1% a year and questionable whether this corresponds to a rise in net fixed capital formation, as it may well be less than the rate of depreciation and dilapidation.
The British economy’s Investment (Gross Fixed Capital Formation, GFCF) is about £500bn a year, equalling about 9% of existing capital stock. Most accountants would not allow a firm to depreciate its capital stock by just 9% a year, it would need to be much higher. Even if ‘UK plc’s’ capital stock does include railways and bridges (which have a much longer useful lifespan than firms’ fixed capital), GFCF which is just 9% of the existing capital stock seems too low to match the replacement level. The functioning capital stock of the British economy may be contracting.
The competition with confusion
Marxism is not necessary to outline this crisis. But it is necessary to explain why this has happened in this way, or to begin to outline an effective response to the crisis.
Firstly, this is because mainstream economics offers only confusion where explanation should be. To give a very concrete example of this, the Bank of England insists that there is a ‘productivity puzzle’ in terms of explaining the low growth of the economy and of productivity in particular. And there are 792 citations for 10 scholarly articles on the productivity puzzle on the first Google page alone. It is a very popular idea.
Yet there is no puzzle at all. If we take manufacturing, ONS data are startling and decisive. In real terms the manufacturing stock of fixed assets is almost unchanged over nearly 30 years. The means of production in the British manufacturing sector are not increasing.
As a result, it is extremely difficult to increase the output of the manufacturing sector. Yet, in fact, manufacturing production has increased at a very moderate pace over that time. In addition, when the total workforce and hours worked have also both declined sharply, the modest rise in output is closer to a productivity miracle than a productivity puzzle.
Of course, mainstream economics has a vested interest in obscuring the causes of the crisis, including at the very top like the Bank of England and the OBR. They represent the interests of the class that is responsible for the dearth of investment and the crisis overall. That is inevitable.
To take another example, there is an army of private sector economists in this country, many of them working in finance. Yet how many of them ever refer to the 2007-2008 crisis being caused by the over-speculation of the finance sector, its deregulation the economy’s over-reliance on finance and the role of US finances in provoking the global slump? Of course they do not. They have a vested interest in obscuring that truth too.
But what about the non-mainstream forces? The people who do not accept mainstream explanations for the crisis? If the British capitalists are on an investment strike, why is the British left on a strike against Marxist economics? Why is the most popular economist on the British left Keynes, who was a Liberal? And, even then, why do they mostly reject his prescription for a “somewhat more comprehensive socialisation of investment”?
They refuse to accept the role of the public sector, the State, interfering in the realm of the private sector, which in a capitalist economy like Britain in peacetime, dominates the investment function. They do not advocate increasing socialisation of investment.
Instead they promote a series of alternative explanations. These merit discussion because unfortunately they dominate the economic thinking of the progressive forces in this country.
These ideas include, but are not exhausted by:
The government can just print money to get out of the crisis
Tax revenues don’t fund government spending
Governments can spend without limit
Boosting Consumption is the way of the crisis, because under-Consumption is the cause
Financialisaton is the cause of the crisis, and ethical banks or bankers are the answer, there are many more.
The fact that most of these nostrums, where possible, have been tried in the very recent past and failed does not impinge on their thinking:
Biden/Trump/Sunak boosted Consumption without Investment and all we got was inflation
All the G7 central banks printed money without limit and we got no substantial economic recovery
Liz Truss spent without limit, and look what happened next
Aside from abolishing taxation, it is hard to test the claim that taxation does not fund government revenues, but we can be sure disaster would strike very quickly. Merely cutting taxation, like Reagan and Thatcher, or Milei now leads to ballooning deficits
And, good luck with finding ethical banks or bankers!
As we know, Keynes was a Liberal, albeit one who, in the realm of finance and the economy was attempting a largely objective analysis of the various economic crises of his lifetime, related to WW1, Versailles, the 1929 Crash and WW2.
However, much of the inner workings of the economy remained a mystery to him, even though those inner workings, and their ‘laws of motion’ had already been analysed by Marx. These include trade, which is how Capital begins, profits and their centrality under capitalism, the law of the tendency of the profit rate to fall, the Marxist law of value, and so on.
Many of these key analyses are either completely misunderstood or neglected altogether, even in left narratives on the economy. You are more likely to hear the word profits on a US business channel that you are in a political discussion about the economy.
But they all need to be reinstated, even if this seems like an uphill task. Because there are material interests and social forces which have every interest in removing Marxism from our lexicon, in denying his analysis and ignoring a whole body of work.
Harold Wilson famously said he had opened Capital at the second page and promptly closed it again. True or not, matters have not improved since.
The explanation for this lies in the role of the labour and trade union bureaucracy. They preach social peace, Marx does not. The prefer ‘keynesian’ solutions, not disruptive Marxist ones that might lead to conflict with capital. They hanker for a return to keynesianism now, when Marxism suggests that is no longer possible. Attacks on welfare, the war drive, repeated bouts of high inflation and the renewed turn to draining the public finances all point in the same direction. Capital is on a major offensive, essentially to increase the rate of exploitation as their way out of the crisis. They have no interest in listening to pleas for pump-priming the economy.
There is an alternative
Marxism tells us that a society develops economically through the accumulation of capital and the development of its productive capacity. In addition, the development of those productive forces outgrow and come into conflict with the existing relations of production, private ownership. But it also tells us that the capitalists’ dream is to accumulate without investment.
Taking these together, in Britain now we have instead the nightmare where the capitalists do not invest, the productive forces are not growing and their only method of accumulation is to increase the rate of exploitation.
A government attempting to operate in the interests of the working class and the oppressed would need to break this logjam. The main way to break it is through a sharp increase in public sector investment.
Of course, there is no reason in principle why at least sections of the ruling class might oppose such a policy. As for the allocators of capital in the bond markets, there are no borrowing restraints either when real long-term interest rates are below 1%, contrary to the claims of even some left economists.
After all, many private sector firms would benefit from public investment in housing, transport, IT and renewable energy. And many more would benefit indirectly from policies that improved conditions and health of workers, that cut delivery times, that improved connectivity or lowered their bills. The public sector has frequently rescued the private sector, most recently in the banking crisis of 2007-08.
But there is both a structural and conjunctural objection to these policies. In extremis, previously violent objections the public sector intervening in the economy can fall away if sectors of the economy have either exhausted their potential for profitable returns (say the train operating companies) and/or their disrepair undermines other sectors of the economy (such as the coal industry at the end of World War II). But these are exceptions, not the rule. Generally, there is ferocious resistance to any efforts by the state to encroach on private sector investment.
There is now also a conjunctural difficulty to a programme of public sector-led investment. The crisis of profitability of the British economy means there is a strong tide in favour of dismantling public sector institutions in favour of the private sector. This takes place through underfunding, outsourcing, overcharging, PFI and outright privatisation. The largest public sector organisation in the country is the NHS, and it is subject to all these impositions. But they are widely applied across the public sector.
The most recent development is to funnel public money to private arms’ manufacturers through an increase in the military budget, providing huge profits but no economic benefit whatsoever. There is too the general drive against wages, principally by the policy of stoking inflation, and reducing the social wage through cuts in welfare and the social safety net. Overall, the policy to increase the rate of exploitation to resolve the crisis.
Therefore, the central demand for public investment remains the appropriate economic response to the crisis, and all other schemes have failed over 15 years. But only the working class and its allies have no interests preventing the adoption of this policy. Politically, advocates of the policy should expect to be ignored and dismissed and then viciously attacked only when these ideas become more popular.
Overcoming the failed policies which have lasted centuries is sure to be a prolonged struggle.
The above are some notes made for a meeting at the Marx Memorial Library, ‘What can Marxism tell us about the crisis of UK plc?’ Video of all the presentations can be found here.
Austerity and war, leavened with racism and authoritarianism is what is now being served up to the bulk of the population in the NATO countries. The Alternative Defence Review (ADR) published by CND has a very different perspective to Britain’s recent Strategic Defence Review (SDR), could hardly be more timely or more pertinent.
A mass of evidence is assembled in the report to make a series of arguments that counter the assumptions and findings of the SDR. Here, the focus will be on the key economic arguments for opposing the war drive.
There is no surprise that the war drive is linked to a renewed austerity drive. It is now even drawing in the US, which had previously declined to follow the failed European austerity model. But then Biden let inflation rip to hammer living standards, especially wages, and Trump is completing that one-two on workers and the poor by more traditional methods. In his ‘great big, beautiful bill’ he will raise military spending and cut taxes for the very wealthiest, funded by a combination of borrowing and cuts. Social welfare programmes, especially Medicaid will be cut by $880 billion, which low-paid and poor Americans rely on for any access to health care at all.
Trump makes the link between his military bonanza and the cuts to social protection explicit. There is also an effort in Britain by campaigners to link the two, through slogans such as ‘welfare not warfare.’
In fact, the linkage between the two areas of government spending is a logical economic imperative. Grasping that logic will only strengthen the anti-war movements in this country and internationally.
There are only two broad categories for production; Consumption or Investment. Of the two, only Investment can augment the means of production, and so create the conditions for an increase in production which is the basis for prosperity – that increased production can then only be directed either towards consumption or towards Investment. Therefore, while the sustainable satisfaction of human needs (consumption) is or ought to be the purpose of economic policy, the necessary means to achieve that is Investment.
The definition of Investment is that it will add to or replace the existing means of production. Anything which adds to level of fixed assets in the economy is properly categorised as Investment (Adam Smith’s term for the level of fixed assets in the economy was simply ‘stock’).
Despite the best efforts of Keir Starmer and others, spending on the military is not Investment, not even military hardware. This is because missiles, bombs and fighter jets are not additions to the means of production. They can only destroy the means of production, as well as people. Military hardware is the opposite of Investment. They are the means of destruction.
As it is not an input into production military spending can only be categorised as consumption. But other items that are categorised as consumption are not only extremely useful but vital to the well-being of the population. These includes spending on health, or education, or social welfare. Not all consumption is equal. Some of it is vitally necessary to human society, other consumption spending is simply destructive of it.
In this country and in many other NATO members there is a great deal of talk about public Investment. But the reality is very different. So, the recent announcement from Rachel Reeves following on from the Treasury’s Spending Review is that there will be £725bn in public Investment over the next 10 years. But this is less per year than the £77.6bn of public Investment in 2024. Public Investment is being cut.
But once the (smaller) envelope for public Investment has been set, that determines the level of funding available for consumption. In the domestic economy as a whole Investment + consumption must equal 100% of the economy. So, public Investment + public consumption must account for 100% of public spending.
The inescapable logic is that this government must choose between types of consumption within the total funds allocated to consumption. The Starmer government has chosen. It chose to cut international aid and to cut welfare in order to increase military spending. Essentially, under the current total allocated to public consumption, the government chose between welfare funding or military funding. It made the wrong choice.
Anti-war campaigners and anti-austerity campaigners objectively have unified interests. There are no additional funds currently available for military spending except by imposing austerity. This also means there is no logic in supporting increased military funding while opposing austerity. The first is not possible without the second.
The Alternative Defence Review has done a great service in raising these issues. The economic argument reinforces the overall campaign against austerity and war, in favour of prosperity and peace.
The government is in denial about its own austerity policy. It repeatedly claims that it is not reproducing the failed austerity policies of the Tory years. Ahead of the Spending Review this week, it is important to set the record straight – to show that the government’s policy is austerity and attempts to do that are misleading and counter-productive.
The latest effort is by Torsten Bell MP, who holds two junior ministerial posts at the Treasury and the Department for Work and Pensions. He previously worked as director of policy for Ed Miliband when he was leader of the Labour party and, more recently as a principal of the Resolution Foundation. He is widely considered to be one of the more astute economic brains in the Starmer government. So, his intervention in the government campaign of denial about austerity is worth consideration.
That intervention came in the form of a chart on his ‘X’ account, reproduced below, as well as a longer explanatory video which is also available there.
The chart shows Total Departmental Spending (TDEL) from 2009/10 to projections under the Labour government until 2029/30. On the face of it the red line of Labour planned spending clearly shows a rising trend, which seems to strongly supports the claim that austerity is over.
However, a closer examination of the chart does not support Bell’s contention. The dark black line starts to rise in in 2016/17. On this basis, “we” did not end austerity. The Tories did 9 years ago. All of us who have been complaining about austerity are fools! Austerity ended years ago, according to Bell’s chart.
Yet public services have deteriorated, NHS waiting lists lengthened and living standards have deteriorated over that time. Austerity has been very much in place over the entire period.
The reason austerity did not end in 2016/17 despite real terms increases in government spending is because those increases were not sufficient to cope with the pressure of a rising and ageing population, or to reverse the damaging effects of previous austerity.
Under current plans, the Labour government will continue that trend. Spending will increase, but insufficiently to end austerity. The table below is taken from the March 2025 Economic and Fiscal Outlook from the Office for Budget Responsibility.
Table 1. Total Departmental Expenditure Limits
The table shows that the government plans for TDEL (Total Departmental Expenditure), highlighted, are extremely weak, beginning with a cut over 1.6% in the last year of the Sunak government by ending with just 0.6% and 0.7% growth in the last 2 years of this parliament. Over the entire period, growth in Departmental spending will be little over 1% on average per year.
Of course, it is possible that the Spending Review will show a complete change of heart by the government, a recognition that austerity does not have the claimed effects and that large-scale public investment is necessary to lead economic recovery. But the signs do not look encouraging.
The whole world is caught up in the negative effects of Trump’s tariffs. But the US Administration’s principal target is clearly China, which has been singled out for extortionate levels of trade tariffs, combined with threats to third countries who continue to trade with China.
At the same time the rest of the world has been subject to far lower, but highly damaging tariffs, with the threat of further actions to come. A further consequence is the impact on the US itself, with the prospect of much lower growth, higher prices and job losses now widely anticipated. This in turn has caused turmoil in US financial markets and has led to the unusual situation where all main US assets, the stock market, government bonds and the US Dollar have all fallen at the same time.
The main questions posed are:
Why has Trump conducted policy in such a reckless manner?
What will be the effects of the tariffs?
What are the long-term consequences?
Falling behind China
The context of the US economy’s weight in the world in framing Trump’s policies. The US economy has been growing at a considerably slower pace than China since at least the late 1970s and the beginning of the Chinese ‘reform and opening up’ period. For much of that time, this was of little consequence to the US.
But in terms of economic size (using Purchasing Power Parities, PPSs, to measure real output and ignoring the effects of currency differentials), the World Bank calculates that the Chinese economy surpassed the US economy in 2016, as shown below.
Chart 1. Chinese and US economies’ real GDP (PPPs)
Source: World Bank
The World Bank now estimates that the output of the Chinese economy was $34.66 trillion in 2023, versus $27.72 trillion for the US. This makes the Chinese economy effectively 25% bigger.
But the growth trends in the two economies are making this disparity an urgent matter for the US. This is because the growth gap continues to widen rapidly.
This is illustrated in the recently published IMF World Economic Outlook (WEO) database (April 2025). On their projections, by the end 2030 the US economy will be $37.15 trillion (PPP terms), while the Chinese economy will be $54.23 trillion. This means that by 2030 the Chinese economy will be 46% bigger than the US. For comparison, just six months ago in the October 2024 WEO, the IMF projected that by end-2029 the Chinese economy would be 38% larger than the US economy.
Over a slightly longer time frame, it is easier to see why there is a sense of urgency, even reckless urgency, from the Trump Administration. The US economy has doubled in size in last 17 years, according to World Bank data, while Chinese the economy doubled in size in 9 years. If both economies maintained that trend from their current starting points, the Chinese economy will be double the size of the US economy in little more than a decade. It would be four times the size of the US economy in 20 to 25 years’ time.
So in a very few years, on current trends, the Chinese economy will be out of sight compared to the US economy. The US will have decisively lost its position of global economic dominance and all that goes with it.
As this would be a world-historic defeat for the US, it is not something that its ruling circles are willing to accept at all. The ultra-aggressive stance on tariffs reflects both the scale of what is at stake and the urgency of their response.
Tariffs and how they operate
It has been widely shown that the supposed logic for the scale of the tariffs for each country is completely spurious. This is further underlined by the repeated changes to the tariff levels and, the date of their implementation and the the exemptions in certain sectors (and the U-turns).
This is because the tariffs themselves, while having a serious negative global economic effect are essentially politically determined.
At one end of the scale is a country like Britain, which regards itself as a close ally of the US, which has been hit with general tariffs of 10%, with 25% on cars and possibly more to come on pharmaceuticals. As noted previously, China is regarded in the US as its principal rival, if not enemy, and has been hit with 145% tariffs. This is effectively an attempt to end US-China trade. It is reinforced by the US threat of further sanctions on theird countries which continue to trade with China.
The negative effects for the global economy are widely acknowledged, if somewhat understated in terms of the impact on the economies of the Global South. In the April 2025 WEO, for example, the IMF slashed growth forecasts as a result of the tariffs, while simultaneously raising inflation forecasts for the advanced industrialised countries.
By contrast, UNCTAD, the UN trade agency is much more pessimistic. UNCTAD forecasts that global growth will slow to just 2.3% this year, which below its marker for world recession of 2.5%. UNCTAD says “developing countries and especially the most vulnerable economies” will be hardest. This is because, as UNCTAD argues, many low-income economies now face a “perfect storm” of tariffs and lower trade, existing unsustainable debt levels and slowing domestic growth.
It should also be remembered that an immediate casualty of the tariffs is the US economy itself. Although Trump continues to insist that the US is financially benefitting from tariff revenues, this cannot be true. This is because tariffs are never paid by the exporters, but by the businesses and individuals who are importing the goods. This means US businesses and consumers are paying Trump’s tariffs, which will reduce incomes in the US itself. It is in effect a Federal tax on the imports of US economy, whether for investment or consumption purposes.
Trump’s other key claim in favour of traiffs is that they will lead to ‘re-shoring’ of jobs. This is based on the false assumption that the jobs naturally belong in the US, and by punishing other countries and damaging their ability to export to the US, production will relocate to the US. Again, this includes all countries in its scope, but is particularly aimed at China.
The entire framework for this policy is shot through with contradictions and false assumptions. To highlight just some of the more important ones:
The US economy now accounts for something over one quarter of world GDP and a little over one-eighth of world imports. Unless any country is almost wholly dependent on US imports (and for most of the world China is now a bigger trade partner) then higher import tariffs to the US will tend to force diversification to other markets (including into domestic markets) rather than economic collapse. Even for countries such as Mexico and Canada, the tariffs are so damaging and other demands from Trump so stringent they too are probably forced to diversify away from the US.
Advanced manufacturing is increasingly complex, capital-intensive and relies on global supply chains. Price (and raised prices via tariffs, or the cost of labour) are just one element in the question of the location of production. Access to high skills, openness to the required supply chains, access to raw materials and reliable energy sources, highly developed infrastructure and a large, growing domestic market are all key factors. In many instances, the US simply does not offer these prerequisites.
The same issues apply to re-location as to location. The world is not obliged by costs to relocate to the US. In fact, in light of the tariffs to be paid by relocating to the US, there is an incentive to seek alternatives.
Tariffs have been tried in the recent past, with little success. There was a roughly 10% increase in US manufacturing jobs in the years following both the tariffs of Trump’s first term and coming out of the pandemic. But neither of these were ‘re-shoring’ as world manufacturing jobs increased at a greater rate over the same period.
In effect, Trump’s policy is to lay siege to the whole world in order to isolate China. However, given the US weight in the world economy and global trade, as well as the enormous complexity of global supply chains, with China often at their hub Trump, he risks the main effect is to isolate the US economy.
Trump’s gambit
In any contest where one side is decisively losing, a high-risk strategy may become appealing for them. The increased risk contains its own pitfalls, but opens the possibility of eventual victory, which is more attractive than inevitable defeat.
Trump’s tariff policy is incoherent and unworkable, for reasons noted above. Fundamentally, they cut across a decisive factor of economic development. The necessary condition for optimal economic development is the fullest possible participation in the international division of labour (or more accurately, the socialisation of production).
For fledgling industries or even economies, protectionist tariffs can be a useful tool for economic development, with the intention to lower those tariffs when there has been sufficient development and participation can actually take place. But for advanced industrialised countries like the US, tariffs entail cutting off the economy from participation in the international division of labour.
The same applies too to protectionism in other advanced industrialised countries in the G7. Protectionism, subsidies without sufficient investment and ‘buy domestic’ campaigns just lead to a cycle of higher prices, low investment and decline. The EU was born as the European Coal and Steel Community behind tariff walls (with Britain treading the same path, sometimes independently) but now there is very little steel, coal, shipbuilding or other industries which are thriving in the rest of the world. Cars may be next.
But Trump’s tariffs are not designed to succeed by economic means. They are a device to politically re-engineer the world in the US’s favour.
As previously noted, China is the principal target for the US, as the singularly extortionate tariff levels show, the absence of a 90-day pause and the threat to third countries continuing to trade with China. The much softer but damaging tariff threat to third countries is designed to enlist those countries on the US side in the trade war with China. Even then, there will be a price to pay as Trump seeks to enrich the US at their expense. This aligns with his military policy, also increasingly directed at China, with strong pressures on other NATO countries (and others) to ramp up their funding of the US war efforts.
The tactic is to force other countries to choose the US over China as a trading partner, cemented by the US’s long-standing military dominance over all other countries. Clearly, China’s rejection of Trump’s various demands and ultimatums means it has no intention of acceding in its own demise.
But there are a number of other economies which have sufficient weight in the world economy and provide crucial links in global supply chains, which mean they have both the capacity and incentive to resist Trump’s enforced choice. Principally, these are the EU, India and Japan.
It is unclear ultimately how they will respond, but surprisingly militant and public pronouncements from Japan suggest that Trump will not get things all his own way. Many other countries simply cannot choose the US over China because of existing trade relationships, or have very little incentive to, given China’s active role in their economic development. This is especially true in poorer parts of Asia, much of Africa and some countries in Latin America.
By contrast, the incoming German Chancellor Merz is reported to have offered Trump a zero-zero tariff regime on trade. Others who have offered the same have been rebuffed by the US. But zero tariffs (and presumably alignment on food standards) would devastate European agriculture and cause huge social unrest.
The Trump offensive is also not confined to overseas opponents or enemies. It is also a two-pronged attack on American workers and the poor. In this way, Trump aims to increase the profits of major corporations and their share of national income.
The first prong is a direct attack on social spending with $2 trillion in planned government spending cuts. The largest slice of this is a planned $880 billion cut to Medicaid and other federal healthcare programs. But the second prong is inflation. Since the financial crisis of 2008 it has proved very hard for Western governments to cut nominal wages via austerity. It has been much easier to cut real wages by stoking up inflation, which began in the US in early 2020. Not only will the effect of tariffs be to increase US (and other) rates of inflation, that process will be reinforced by a simultaneous $1 trillion tax cut which will overwhelmingly benefit the ultra-rich.
Inflationary tax cuts for US oligarchs and social spending cuts for workers and the poor are a blatant class war approach to fiscal policy. It remains to be seen what resistance these policies meet from those most badly affected.
Finally, there is the Achilles’ Heel of Trump’s policies in the form of US financial markets. Typically, stock markets rise with improving sentiment on the economy, while bonds rise as economic optimism fades. The global dominance of the US Dollar should mean that either one ought to be the international ‘safe haven’ in a time of political and/or economic turmoil. But in response to Trump’s policies both main US financial markets have fallen simultaneously, along with the US Dollar itself. This directly impacts the market wealth of millions of Americans, and particularly the set of oligarchs that Trump represents. Any softening of the tariff policy is greeted with huge relief in these financial markets; every new threat from Trump provokes a renewed sell-off.
Conclusion
This combination of linked factors; China’s refusal to be subordinated, other countries’ reluctance, the conflict with American workers and the fragility of US financial markets all mean that Trump has lost the first battle in this war, as even arch neo-liberal outlets like the Wall Street Journal acknowledge. ‘China called Trump’s bluff and seems to have won this round’, was its verdict.
But following from the analysis above, and the incredibly high stakes for the US, we can be certain that there will be many more rounds to come. The whole world will be affected for many years to come.
The contrast between the way the crises in steel production at Scunthorpe and Port Talbot has been stark. Both plants owned by companies based overseas. Both seeking a way out of unprofitable production. Both in negotiation for subsidy from successive governments for outcomes that would lead to massive job losses. Both looking to close aging blast furnaces earlier than originally planned because they have been making significant losses.
In the case of Port Talbot, this led to a deal to convert to Electric Arc Furnaces to secure sustainable steel production at the site, but with the loss of 2,500 jobs and only 300 retained. This was dependent on a subsidy from the government of £500 million. A similar deal was not clinched at Scunthorpe, as the crisis was brought forward by Trump’s imposition of a 25% tariff on UK manufactured steel – which led to an announcement of imminent closure from the company the following morning. A closure would mean 2,700 jobs lost – on the same scale as Port Talbot.
In Port Talbot, in the absence of a serious just transition process involving the unions, which were excluded from the discussions by the company and the then Tory government, the job losses are being dealt with by the same sort of offers of retraining as have been proposed for the Grangemouth oil refinery in Scotland. In the case of Scunthorpe, also with no just transition process, the government has rightly stepped in to take charge of the plant to keep the blast furnaces running in the short term; which means that the losses previously borne by the company will now be borne by the Exchequer. With the company losing £255 million a year, the governments £2.5 billion steel transformation fund can absorb this in the short term. Workers at Port Talbot have expressed some bitterness that this was not considered for them.
What has been different is the mobilisation of Sinophobia around British Steel’s ownership by a Chinese company, Jingye. Indian based Tata Steel’s ownership of Port Talbot was certainly mentioned in news coverage, but not on the blanket, verging on obsessive scale that British Steel’s Chinese ownership has. Tata’s brinkmanship in negotiations was also mentioned, but they were not accused of “negotiating in bad faith” in the way that Jingye have. Both companies have behaved as you’d expect a capitalist company to behave, though if you read Jingye’s Group Introduction you can see how their operations inside China are turned to more positive social objectives – from a high wages policy to greening their workplaces – from being based in a country run by a Communist Party, not by their own class. But here, both Tata and Jingye are in it for the money. Their UK operations have only been viable as a tiny loss making fragment of a much larger business, as part of an attempt to implant themselves in a variety of global markets in the hope of profitability in the medium to long term. Steel production at Port Talbot in 2022, for example, was just 10% of Tata’s global production of 35 million tonnes.
After Port Talbot, there have been no denunciation of Indian investment into the UK, nor any calls in the media or Parliament for any “urgent review” into India’s role in the UK, or paranoid accusations made explicitly by Farage but echoed by “senior Labour figures” as well as Tories in the media but not in the recent Saturday debate in Parliament, that the attempted closure in Scunthorpe is part of a dastardly plot by the Chinese government to sabotage a strategic British industry, not a commercial decision in which a company is seeking to cut its losses in all the ways British capitalist company law allows them to; including cancelling orders for the raw materials they’d need to keep running the blast furnaces they want to close. Instead, there has been serious negotiations with the Indian government to set up a trade deal, which was reported last week as “90% done”.
No decoupling there.
The attack on commercial engagement with China fulfills two objectives. One is a straightforward attempt to mobilise popular sentiment in defence of steel workers jobs behind a Cold War sentiment in a wider context in which the Trump administrations policies have shaken up popular faith in deference to the US. An anti Chinese attack distracts from that and pushes people back towards habitual hostilities.
The other opens another front in the resistance to any serious action on climate change that could threaten the profits of the fossil fuel sector. Accusations from the Right have been:
The blast furnaces could have been kept running with locally sourced coking coal from the cancelled Whitehaven mine. This misses the point that the coke from this mine – had it been developed – would have had such a heavy sulphur content that it was too poor quality to be used at Scunthorpe, so this is a consciously mendacious and fundamentally unserious talking point.
High energy prices in the UK are because of “Net Zero”. This, as they know, is the opposite of the truth. The UK has high energy costs because they are tied to the price of gas far more than any other country in the G7. See Figure 1. We should also note that the oft repeated “solution” to this problem from Reform or the Tories is massive investment in nuclear power instead. The problem with this is that the cost per Kilowatt hour of energy generated by nuclear power is higher than gas, which is higher than renewables. See figure 2. So their way forward would actually compound the problem. Paradoxically, their attack on Chinese investment in UK nuclear power development, and the withdrawal of Chinese investment from Sizewell C in Suffolk and Bradwell in Essex, is making the financing of these projects almost impossible. So, in this case, the contradictions of their politics means they will neither have their cake, nor eat it.
Figure 1
Figure 2
These themes came together in a front page broadside from the Times on 15th April directed at Ed Miliband’s recent trip to China aiming to improve relations and develop better sharing of expertise on the climate transition. Miliband’s is the head that the right wing press is keenest to have on its trophy wall of sacked ministers, hence quite limited and inadequate targets being described as “swivel eyed” and “eye watering” in a constant hammering of lead articles from the Sun to the Telegraph and all the low points in between. Attacks on solar panel installations are increasingly taking the form of accusations of “forced labour” in China, which are untrue, but because it is almost universally believed at Westminster, this threatens a reactionary result on the basis of an apparently progressive concern – as China is the source of 80% of the world’s solar panel supply. However, even if the UK sabotages its green transition by impeding imports of Chinese solar panels this will have little effect globally, as China is increasingly exporting them to the Global South. See Figure 3 Miliband is nevertheless the most popular government minister among Labour members in Labour List’s survey – in which he has a positive rating of 68, compared to Keir Starmer’s 13 – because he is seen as getting on with something positive and progressive, while Liz Kendall and Rachel Reeves are in negative territory.
Figure 3
The call from Dame Helena Kennedy for “an urgent security review of all those Chinese companies operating within our infrastructure which could pose a threat to our national interests – and maybe not just confined to China” threatens to compound the damage already done by the UKs removal of Huewei’s investment in the 5G network, ensuring that the version the country has is slower and more expensive, and the financial difficulty set for Nuclear power station projects by the removal of Chinese investment on the basis of “national security” paranoia. Applied more widely, this neatly lines the UK up with Trump’s trade war against China and sets the UK up for a potential trade deal in which US capital is looking hungrily at the NHS, wants to sell chlorinated chicken and other additive saturated and nutrition less food from their agricultural industrial complex and open up a tax and regulation free for all for their abusive big tech companies, while their President is actively sabotaging global progress towards sustainability by doubling down on fossil fuels. China is doing none of these things. A more positive approach is that being taken by the PSOE government in Spain, which is both encouraging inward Chinese investment – like the joint venture between CATL and Stellantis to build a battery factory in northern Spain and deals signed last year between Spain and Chinese companies Envision and Hygreen Energy to build green hydrogen infrastructure in the country.
Farage, and others on the Right are arguing for nationalisation as a temporary measure just in order for the company to be “sold on” – treating nationalisation as an emergency life support process for private capital -is that there is not exactly a huge queue of companies waiting to buy, and any that did would most likely to be looking at asset stripping. Jingye was the only company interested in 2019, when previous owner Graybull capital gave up on it.
This would also be the government’s preferred approach, because they are nervous of the capital costs involved in making the plant viable. There are three intertwined problems with this.
Attracting a viable private company prepared to put serious money into reviving the plant means attracting overseas capital. Given that more than 50% of global steel production is made by Chinese companies (see figure 4 below) Jonathan Reynolds has changed his tune since the weekend debate in Parliament. That Saturday he was decrying allowing Jingwe into UK steel manufacturing as a national security issue, but by mid-week, a few days later, he was prepared to be more pragmatic about it.
Making the plant viable cannot mean investing in new blast furnaces. These would become stranded assets before they had reached the end of their design life. Despite the determined rearguard action from Trump and others, trying to carry on as though the world isn’t changing makes no business sense. In 2024, for example, all new steel plants developed in China were Electric Arc Furnaces, designed to use scrap steel as raw material. As yet, production of virgin steel has been dependent on coking coal, but the first production using (green) hydrogen and electricity looks like coming on stream in Sweden by next year; so if virgin steel production is considered an imperative for the Scunthorpe site, that model will have to be looked at and emulated as a matter of urgency.
New investment in different production on the site – like almost all capital investment – replaces labour with capital. As with Port Talbot, far fewer workers would be needed for EAFs. Reynolds has talked about “a different employment footprint” for the plant; which is one way to put it. So, the issue of how the transition can be made in a way that opens up alternative employment with decent terms and conditions has to be negotiated with the workers themselves through their unions.
What’s needed is a clear industrial plan that consolidates the nationalisation as a precedent for other sectors and builds on the Scunthorpe plant’s strengths in producing, for example, 90% of railway tracks used in the UK, as part of a strategic plan for green transition. This has hitherto been focussed on a transition to Electric Arc Furnaces, but linking the production of green hydrogen to new generation furnaces capable of producing the tougher virgin steel needed for a full range of industrial applications should also be part of the process; because blast furnaces can’t be kept open indefinitely if we are to stop the climate running away out of a safe zone capable of sustaining human civilisation by mid century.
Appendix
UK steel production is the 35th largest in the world, comparable to Sweden, Slovakia, Argentina and the UAE. Its 4 million tonnes in 2024 is just over a tenth of the production of Germany, a twentieth of the United States, a thirty seventh that of India and a 250th that of China. See Figure 4.
Figure 4
The niche, almost token, position of UK based steel manufacturing reflects a wider process in which UK based capital is no longer primarily engaged with manufacture.
The last time the steel industry in the UK was nationalised in 1967 it had 268,500 workers from more than 14 previous UK based privately owned companies with 200 wholly or partly-owned subsidiaries. These companies were considered increasingly unviable because they had failed to invest and modernise, so were increasingly uncompetitive. This is part of a wider story about how the UK capitalist class has transformed itself since the 1960s. While the quantity of manufactured goods has increased since then, the proportion of manufacturing in the economy has shrunk from 30.1% in 1970 to 8.6% in 2024. The service sector has grown from 56% to more than 80%. UK based capital primarily makes money from selling services, mostly financial, to manufacturing capitalists at home and abroad. They are spectacularly bad at large scale manufacturing start ups, as the debacle of British Volt (whose approach of setting themselves up a luxurious executive office suite before they’d secured funding to even build their factory might be described as cashing in on your chickens before you’ve sold any).
What that means is that most of “British Industry” is owned by firms based overseas, so might be better described as “manufacturing that happens to take place in Britain”. Consider the automotive sector. While there are locally based SMEs in the supply chain, all the big manufacturers depend on overseas investment. Nissan, Stellantis, BMW, VW, Geely, Tata (again). As with locally based steel production, firms like Morris, Austin, even Rover, are long gone for the same reasons as BSA – once the world’s biggest motorcycle company – now only builds retro classic designs as a niche luxury product and Guest Keen and Nettlefold had to be nationalised to save its assets.
Welfare cuts. Reductions in departmental spending. Job cuts in the public sector. But a boost to spending on the military.
These were the main elements of the Spring Statement delivered by the Chancellor.
Yet government ministers seem dismayed that they are accused of implementing austerity, pointing to rising spending in real terms. In reality, as the Joseph Rowntree Foundation shows, the average family will be £750 a year worse off by 2029, and 400,000 households will be pushed into poverty.
Under the Tories, austerity was characterised by cuts for ordinary people and the services they use, while providing tax cuts and tax breaks for big business and the rich. This time is different. Both the October 2024 Budget and the latest Spring Statement imposed cuts for ordinary people, while the statement also provided a bonanza for arms manufacturers. It is still austerity.
It is necessary to unpick some of the government’s policies to show the real changes being imposed, which stand in contrast to ministerial claims. The most important claims centre on the projected rise in day-to-day or current spending, and claims on the growth of public investment.
In the Spring Budget 2024 introduced by Sunak and Hunt, a string of austerity measures was announced, but only to be implemented after the election for obvious electoral reasons. Labour under Starmer signed up to those Tory cuts as part of its own election campaign. It began to implement them in October. The Spring Statement continues and deepens that process.
That explains why we have seen cuts to welfare for the most vulnerable, cuts to international aid, cuts to the winter fuel allowance, and many more austerity measures. The largest of which, by far, was the decision to implement Hunt’s freeze on income tax bands rather than raise them in line with inflation. This will take tens of billions of pounds out of the pockets of ordinary people over time, who will find chunks of any pay rises eaten up by the Inland Revenue.
By contrast, government ministers claim that there is no austerity because total spending is rising in real terms.
But there are a series of problems with this line of argument. The first is that two elements of government spending that are included by the austerity-deniers have no benefit at all in terms of public services. The first is defence spending, which is rising to 2.5 per cent of GDP.
The second, and even larger item, is the rise in debt interest payments. This was referenced in her Spring Statement by Rachel Reeves. In 2021, the cost of servicing government debt amounted to just 1.2 per cent of GDP but soared to 4.4 per cent of GDP two years later and remains at elevated levels. Both of these items are included in the total for government spending, which ministers and others claim “proves” this is not austerity.
Even when these two items are included, government spending is falling as a proportion of GDP. We know that the economy has effectively been stagnant over a prolonged period. The fact that government spending is not even increasing in line with the snail’s pace of GDP is evidence of how hard the handbrake has been applied to government spending.
There is a further factor that should be taken into account. As the population grows, the requirement for public services grows. This is especially true in areas such as health, where the population is not simply growing but ageing too.
As societies become richer, there is a natural tendency to spend more on areas which are fundamental to people’s wellbeing. Health and education are the most important contributions to wellbeing once the requirements for food, shelter, and clothing have been met.
Ministers who insist their cuts are not austerity are ignoring all of these factors. They are also ignoring the reality of the effect of their own policies. Destitution — the lack of these basics — is already on the rise and will accelerate because of these policies.
Scrutiny is needed for claims about the other key area of government expenditure: government investment. There is now a planned increase in capital expenditure, at least over the next two years. But as the Office for Budget Responsibility (OBR) points out, most of this planned increase in public investment is a by-product of the decision to slash the international aid budget to fund the military budget, which is a much more capital-intensive department.
Even with this artificial uplift, the government plans that its own capital investment will go back down in 2029 to the same levels as in 2026. This is not a long-term plan for growth. It is a short-term plan to boost the arms manufacturers, without any significant beneficial effect.
In the run-up to the Spring Statement, there was a lot of propaganda claiming that military spending would provide a significant boost to the economy and to jobs. Both of these claims are false, and the OBR does not include any wider benefit from it.
Capital investment either replaces or adds to the productive capacity of the economy. It enlarges what we used to call the means of production. So, investing in a factory, a machine tool, or a railway allows new production or faster or more efficient production. The opposite is the case for expenditure on a missile, or a tank, or an assault rifle. This can only be used, if at all, to destroy people or the means of production.
The supplementary argument is that investment in arms manufacturers is “jobs-rich.” Rachel Reeves promises to spread those economic benefits geographically across the country. But it is a false promise. As the OBR says, the military sector is capital-intensive, not labour-intensive.
In fact, detailed economic analysis shows that investment in the defence sector is one of the lowest generators of jobs of all. For example, the health sector generates 2½ times the number of jobs for the same level of investment as the defence sector, while also providing a major public benefit. The result of large increases in military spending is overwhelmingly the production of useless or destructive weaponry.
Behind the spin, the inclusion of debt interest payments as “spending,” and the false claims on the benefits of military spending, it is clear that the Spring Statement is deepening austerity. The poor will be made poorer, vital support will be removed, and the average household will be worse off. There is a drive to rearm, being paid for by disabled people, the poor, and the young. It will leave no-one except arms manufacturers better off.
The above article was originally published here by the Morning Star
What are the real U.S. economic choices facing Trump?
China has set its economic growth target for 2025 at “about 5.0%”. That this can be successfully achieved, what is necessary to ensure it, and the implications for achieving China’s strategic goals to 2035, was analysed in an earlier article “China’s economy in 2024 continued to far outgrow the U.S.”. But the other key economy in the world, whose development has major implications for China is the United States. In particular Trump has set as his explicit goal speeding up the U.S. economy, and slowing down China’s. Given the U.S. tariffs, sanctions and other measures taken by the U.S. against China the comparative economic performance of China’s and the U.S. economies is a major factor for geopolitics and the situation facing China.
The aim of this, and a succeeding article, therefore, is to make the most precise analysis possible of the fundamental factors that will determine U.S. economic growth in the next period—and their interrelated geopolitical and U.S. domestic political consequences. This in turn, as will be seen, determines and is affected by the real, as opposed to illusory, choices which face the Trump presidency 2.0.
The real situation facing the U.S. economy as opposed to myths about it
President Trump habitually misrepresents his own economic record. For example, at his 2024 presidential campaign rallies he repeatedly claimed that during his first term the U.S. had the “greatest economy in our history”. In reality, during his first term, the U.S. economy had the slowest growth during any post-World War II presidency (see Figure 1).
Serious Western analysts do not bother to hide their disbelief in these, and similar, fallacious claims. Thus, for example, Financial Times U.S. affairs editor, Edward Luce, wrote of Trump’s recent speech to Congress:
“It is Mardi Gras in New Orleans. Yet no parade could match the carnival in Donald Trump’s Tuesday night speech to Congress… one could almost hear the remnants of the fact-checking community snap their laptops shut… It would be… futile to compare Trump’s address to any by his predecessors… This was in a category of one… Trump’s speech was a fever dream of extravagant promises. His pledge to cover America with a ‘golden dome’ modelled on Israel’s ‘iron dome’ would use up every gold bar in Fort Knox. A few minutes earlier, Trump had promised to balance the federal budget. Was his pledge to take Greenland ‘one way or another’ a threat or a fantasy? Ditto for the Panama Canal… when historians look back on March 4 2025, his speech might barely rate a footnote.”
Discussion in some sections of the media about the Trump presidency also frequently primarily focuses on speculations about his subjective intentions, or what he would like to achieve in a second term, or belief that some short term superficial measure by Trump could substantially speed up the underlying growth of the U.S. economy—as will be seen this is entirely untrue.
Both such approaches are unhelpful when assessing the practical choices possible for Trump: these are not determined by what Trump wants, or by his unreal propaganda claims, but primarily by the objective situation of U.S. politics/geopolitics and the U.S. economy and the interrelation of forces within this.
Making such an analysis of the objective situation facing the U.S. economy, in turn, requires as precise quantitative analysis as possible of the most powerful factors affecting the U.S. economy and their consequences for U.S. politics and geopolitics. The terms “systematic” and “accurate” are stressed here, as any analysis which focuses merely on a single Trump policy does not deal with the consequences of the fact that the U.S., as with every economy, forms an interlinked whole—any changes in one aspect of the U.S. economy therefore have consequences for, and are affected by, its other aspects. To be accurate, in turn, it is necessary to study in quantitative terms the interrelations which exist between the major determinants of U.S. economic performance.
To do this the author, therefore, gives below a great deal of precise quantitative data on the situation of the U.S. economy—and does not apologise for doing so. The situation of the U.S. economy, and its geopolitical implications, is one of the most important factors in the world—including for its consequences of China. It is therefore necessary to analyze the fundamental forces driving this in as much detail, and with the greatest accuracy, as possible—exaggeration or inaccuracy in any direction, “optimism” or pessimism”, is not helpful and is potentially dangerous in such a serious matter as the dynamics of the United States. “Seek truth from facts”, in the field of the economy, requires precise numbers not imprecise and vague generalities.
To deal with these interrelated issues this analysis is divided into four questions:
What is actual situation of the U.S. economy, what are the domestic political consequences for Trump, and what are the geopolitical consequences, in particular as they affect China, that flow from that situation?
What are the real steps that would be required to significantly increase the U.S. economic growth rate?
What are the economic consequences of the policies Trump has chosen, and therefore can they succeed in significantly speeding up the U.S economy?
What are the political and geopolitical implications of the economic means which Trump has chosen?
The first two of these questions are dealt with in this article, and the other two in the second article in this series.
Figure 1
Section 1—the immediate situation facing Trump
Starting with the immediate situation facing Trump. It is crucial to understand accurately the actual growth trajectory of the U.S. economy. Taking first the results simply for 2024, the U.S. economy grew by 2.8% while China’s economy grew by 5.0%—China’s economy grew 80% faster than the U.S..
This data alone highlights that much Western media during the last period served simply as propaganda rather than objective reporting. Statements from outlets like The Economist, claiming that the U.S. is “leaving its peers ever further in the dust,” or from the Wall Street Journal describing China as having “a stagnant economy,” were either deliberate lies, propaganda distortions, or failures to investigate the facts. Regardless of the reasons for putting them forward these statements are purely misleading, and it is therefore rather disgraceful, and a sign of the real worth of claimed quality “journalism”, which turns out to be propaganda or failure to investigate the facts, that similarly inaccurate statements regularly appeared in the medias.
Current slowing of the U.S. economy—why China’s growth lead over the U.S. is likely to somewhat increase in 2025
The reason that “in the last period” is stated above is because much discussion in the U.S. media now focuses on the possibility of significant slowdown in the U.S. economy. The modelling at the time of writing of “GDP Now” by the Atlanta section of the U.S. Federal Reserve, the U.S. central bank, for example, predicts that in the first quarter of 2025 the U.S. economy will actually contract by 2.4% on an annualised basis.
Whether or not the U.S. falls into an actual contraction or merely slows in 2025 in line with its long term growth rate—and present trends, for reasons shown below, do not indicate why there should be any serious recession in the U.S.—is not crucial for the present purposes of analyzing medium/long term growth trends in the U.S. economy. But what is the case is that in 2023 and 2024, with growth respectively at 2.9% and 2.8%, the U.S. was growing above its long-term trend—which is slightly above two percent annual growth. This means that in 2025, if China achieves its “about 5.0%” growth target, the growth rate lead of China over the U.S. is likely to increase somewhat — to a greater or lesser degree depending on how significant the slowdown in the U.S. economy is. This would have some significant psychological effect on international perceptions of the two economies. It is therefore important to explain this situation internationally—with no exaggeration but simply as an objective presentation of the facts.
What is also clear, however, for reasons analysed below, is that attempts by Trump to raise the medium/long-term U.S. growth rate will inevitably lead to clashes with a series of other countries and also produce conflict within U.S. politics.
Broader international comparisons
Regarding broader international comparisons, a detailed analysis of China’s economic performance in 2024 compared to other countries, including the U.S., was made in “China’s economy in 2024 continued to far outgrow the U.S.”. Therefore, only the most important facts for analysing the international economic situation facing the U.S. are summarized here.
Figure 2, therefore, shows the data now available for GDP growth in 2024 for the major economic centres. China, the U.S.’s, and Japan’s GDP growth of 5.0%, 2.8% and 0.1% are actual results, while the EU’s 1.1% is the IMF’s projections for full-year growth based on the first three quarters results. Based on this data, as well as China’s 2024 GDP growth rate being 80% higher than the U.S.’s, it was four and a half times faster than the EU’s, and fifty times faster than Japan’s.
Looking at this international situation from the U.S. viewpoint, its economic growth was two and a half times faster than the EU, 28 times faster than Japan, but only 56% the rate of China. The objective situation facing the U.S. is therefore that its economic growth considerably exceeds its major Western competitors, the EU and Japan, but is far slower than China—it for this evident reason that the Trump administration will focus its attention on China.
Figure 2
Medium term economic growth performance
Even more clarificatory for judging trends, as it removes the effect of short-term fluctuations due to lock downs during COVID and recovery since, is to take the situation of the major economic centres during the entire period since before the pandemic. Figure 3 shows that in the five years since 2019 China’s economy grew by 26.2% and the U.S. economy by 12.5%, That is, in the period since the beginning of the pandemic the U.S. economy grew at only 48%, less than half, China’s rate.
This once more confirms that to close the economic growth rate gap between the U.S. and China, the Trump administration must therefore achieve one, or both, of two aims:
The U.S. must slow China’s economy.
The U.S. must accelerate its own economy.
Taking the first of these, the U.S. attempt to slow China’s economy, the means available to the U.S. to attempt to achieve this were analysed in detail in the previous article “China’s economy in 2024 continued to far outgrow the U.S.”. To seriously slow China’s economy the U.S., for reasons analysed in that article and briefly below, must secure a significant reduction in the percentage of net fixed capital investment in China’s GDP. However, unlike previous uses of this method, to force their economies to slow down, against competitors which were economically and militarily subordinate to the U.S.—Germany, Japan and the Asian Tigers—the U.S. has no way to compel China to adopt such a course. The U.S. instead has to rely on attempting to persuade China to commit economic suicide by voluntarily reducing its level of investment in GDP—the means used to attempt to persuade it to do so being economically fallacious arguments about consumption, as the previous article discusses.
As the issue of the most serious means by which the U.S. could attempt to slow China’s economy was analysed in detail in the previous article it is not dealt with further here. The present articles only deal with the issues involved in any attempt by Trump to accelerate the growth of the U.S..
That is, the question addressed in these articles, is whether Trump can decrease China’s lead in growth over the U.S. by speeding up the U.S. economy?
Figure 3
Political situation in the U.S.
Turning to the implications of these U.S. economic growth figures for United States domestic politics, the reasons for Trump’s return to office, and therefore the political situation facing Trump, it is clarificatory to examine the trends in the U.S. economy in terms not only of total GDP but also per capita GDP—as per capita GDP is more closely related to living standards than total GDP.
Figure 4 therefore illustrates the long-term post-World War II trends in U.S. per capita GDP growth, using a 20-year moving average to smooth out short-term business cycle fluctuations. This shows a clear 70-year trend of declining U.S. annual per capita GDP growth—with this falling from 4.9% in 1953, to 2.8% in 1969, 2.4% in 2002, and 1.3% by 2024. This last figure is very slow, indeed bordering on stagnation.
Such a very slow rate of per capita economic growth necessarily fuels social and political discontent and instability in the U.S.. This has duly occurred with the increasingly bitter confrontations in U.S. politics during the first Trump term, the Biden presidency, and leading to the second Trump presidency—indices of this being the increasingly harsh rhetoric between the U.S. political parties, the physical attack on the U.S. Congress on 6 January 2021, the forced withdrawal of Biden from the presidential race 2024, the criminal cases started against Trump before the presidential election, the pardoning by Trump of large numbers of violent 6 January rioters, the rapid closing by Trump of entire government departments such as USAID on resuming the presidency etc. Unless the present slow growth of U.S. per capita GDP can be reversed it is impossible to stabilise the social and political tensions in the U.S. This, in turn, has major knock-on geopolitical consequences which affect China.
Figure 4
The U.S. economy under Biden—why Trump won the presidential election
More significantly still for understanding the U.S. social and political situation, is that an increase in U.S. per capita GDP only creates the potential for the possibility to increase living standards for the mass of the population. Whether this actually occurs depends on how that increase in GDP is distributed.
The data shows that In the U.S., in the recent period, the benefits of even the slow increase in per capita GDP which has been occurring did not go to the mass of the U.S. population—the statistics on this easily explain why the Democrats lost the election and why this was foreseeable in advance. During Biden’s presidency, up to latest available data for wages, which is for the third quarter of 2024, U.S. per capita GDP went up by 10.9%, but real inflation adjusted wages were actually lower than when Biden/Harris were inaugurated—see Figure 5. That is, American wage earners, who form the overwhelming majority of the population, became worse off under Biden.
Figure 5
The facts show that the Biden administration carried out a redistribution of wealth from workers, the mass of the population, to owners of capital. Figure 6 shows that during the period of the Biden presidency, from January 2021 to the latest available data for U.S. wages, the S&P500 share index rose by 55.7%, inflation by 21.0%, but U.S. median nominal weekly wages by only 20.4%. That is, owners of capital made large gains in real inflation adjusted terms while wage earners, that is the mass of the U.S. population, became worse off—while simultaneously those able to live from income from capital, a small part of the population, became substantially better off. It is therefore no surprise that social and political tensions in the U.S. rose.
This trajectory under Biden therefore also shows what is likely to happen to Trump if he in turn cannot improve U.S. living standards. Social tensions will rise again, and Trump will become unpopular. It is therefore significant that Trump’s poll approval rating at the end of February, at 45%, was the lowest for any U.S. President, at that time in their presidency, since World War II except for Trump’s first term’s 42%—the historical average approval rating for U.S. president’s since World War II after their first quarter in office was 61%. By 16 February the number of those disapproving of Trump, 51%, was already higher than those approving at 45%.
Figure 6
Economic failure during the first Trump presidency
To complete the immediate picture, it was already noted that, contrary to Trump’s claims that his first presidency was a great economic success, the data shows clearly that this was untrue. Figure 1 above showed that annual average GDP growth during the first Trump presidency, at 1.8%, was the lowest for any post-World War II president. Trump may claim that this was due to the impact of Covid, which was certainly a factor, but the factual reality is that Trump has no track record as president of fast economic growth. The slow economic growth during the first Trump presidency (together with the extremely powerful Black Lives Matter movement following the racist murder of George Floyd in May 2020), was clearly the key factor in the defeat of Trump in the 2020 presidential election
The consequences of the very slow growth of the U.S. economy under both the first Trump presidency, and under Biden, therefore, confirms the socially and politically destabilising effects of the present situation of very slow U.S. growth, and for significant sections of the population decline of U.S. living standards. Unless this trend can be reversed, and U.S. economic growth accelerated, socio-political tension in the U.S. will persist and the Trump administration itself will become unpopular. Failure to understand this factual situation, to instead believe Trump’s self-serving propaganda, or to concentrate on speculation about his subjective intentions, therefore leads to an inaccurate understanding of the dynamics within the U.S.
For both economic and political reason, therefore, the decisive issue for the Trump presidency is whether it can accelerate U.S. economic development. Analysing what would be necessary to achieve this therefore forms the subject of the rest of this series of articles.
The slowing U.S. economy
To initially assess how easy or difficult it is to speed up the U.S. economy, and the political and geopolitical consequences of this, it is necessary to consider long-term U.S. growth rates: these show the fundamental factors in the situation which are sometime obscured by purely short-term fluctuations. Figure 7 shows that U.S. annual average economic growth rates have been declining for almost 60 years. Taking a 20-year moving average, to remove the effect of short-term business cycle oscillations, U.S. annual average GDP growth fell from 4.4% in 1969 to only 2.1% by 2024—that is by more than half.
Clearly a process of economic slowdown which has been taking place for almost six-decades has extremely powerful roots. Only if Trump tackles these, therefore, can this powerful and prolonged slowdown of the U.S. economy be reversed.
Figure 7
Section 2—What is required to speed up U.S. economic growth?
What determines the speed of U.S. economic growth
To then ascertain which policies would be necessary to speed up the U.S. economy it is necessary to analyse the underlying relation between changes in the structure of the U.S. economy and changes in U.S. GDP growth rates. Table 1 shows these for the entire last U.S. business cycle of 2007-2019.
Statistically, to avoid distortions caused by short terms economic fluctuations, it is preferable to consider an entire business cycle, but to show that no “cherry picking” has been done Appendix 1 shows these correlations over the entire period from prior to the international financial crisis, 2007, up to 2024. This appendix shows that this makes no fundamental change to the relative significance of changes in the structure of the U.S. economy.
Table 1 shows an entirely clear pattern:
If merely short-term periods are taken the correlation between changes in U.S. economic structure and its growth rate are moderate/low regardless of whether positive or negative correlations are considered—that is, whether an increase of the percentage of a particular component in U.S. GDP is associated with an acceleration or a deceleration of GDP growth. The highest correlation, taking a one-year period, is 0.53 for net fixed capital formation—a moderate correlation. All other one-year correlations, positive or negative, are between an extremely low 0.08 and a moderate/low 0.47.
However as medium and longer-term periods are taken the correlations become progressively higher and higher. Taking positive relations, the correlation between the percentage of net fixed capital formation in GDP and GDP growth, the highest correlation for any factor in U.S. economic development, is 0.53 for one-year but rises to a high 0.71 for five years and an extremely high 0.85 over a 12-year period. Taking negative correlations, the 12-year correlations of household consumption in GDP, exports in GDP, imports in GDP and total consumption in GDP are all very high at between 0.77 and 0.85.
What such a data pattern demonstrates is that that in the short term no single factor in the U.S. economy is decisive. But in the medium/long term regarding positive correlations, the correlation of the percentage of net fixed capital formation in U.S. GDP and GDP growth is extremely high—that is an increase in the percentage of net fixed capital formation in U.S. GDP is associated with an increase in GDP growth. In direct contrast the correlation of the percentage of consumption in U.S. GDP and GDP growth is strongly negative—that is, the higher the percentage of consumption in U.S. GDP the slower will be GDP growth.
It is unnecessary, for present purposes, to establish the causal connection between the percentage of net fixed investment in GDP and GDP growth—that is whether the percentage of net fixed investment in GDP determines the rate of GDP growth, or the rate of GDP growth determines the percentage of net fixed investment in GDP, or some other factor(s) determine both. But the consequence of this extremely close correlation means that it is impossible to increase the rate of U.S. GDP growth without increasing the percentage of net fixed investment in GDP.
Therefore, for Trump to succeed in accelerating U.S. medium- and long-term growth, he has no option but to attempt to increase the percentage of net fixed capital formation in U.S. GDP.
Table 1
The short, medium and long term
To show this situation still more clearly, and grasp its practical implications, Figure 8 shows visually the correlation between the major domestic components of U.S. GDP and annual GDP growth taking moving averages for different periods of years. Thus, as can be seen, if only a one-year period is taken there is only the medium correlation, 0.53, between the percentage of net fixed investment in GDP and annual GDP growth. There is also a low correlation, 0.39, between the percentage of gross fixed capital formation in GDP and GDP growth. There are negative low/medium correlations, -0.35 and -0.47, between the percentage of household consumption and the percentage of total consumption in GDP, and U.S. GDP growth.
This once more illustrates, as already noted above, that in the purely short term no single factor has a decisive influence on U.S. GDP growth. However, as the time frame increases from the short to the medium and long term the correlations become higher and higher:
Taking a 5-year period the positive correlation between the percentage of net fixed investment in GDP and GDP growth has become a high 0.71, and the negative correlation between the percentage of total consumption in GDP and GDP growth is on the verge of becoming high at 0.68.
By the time a long term 12-year period is taken the positive correlation between the percentage of net fixed investment in GDP and GDP growth is an extremely high 0.85, and the negative correlation between the percentage of total consumption in GDP and economic growth is also a very high 0.83.
The practical implication of these correlations is clear. In the short-term Trump can use other factors (e.g. budget deficits, short term boosts to consumption) to increase U.S. GDP growth, but in the medium and long term the only way that Trump, or any other U.S. President, can increase GDP growth is by increasing the percentage of net fixed investment in U.S. GDP. Similarly, while in the short-term stimuluses to consumption may increase U.S. GDP growth, over the medium and long-term increasing the percentage of consumption in GDP will slow U.S. GDP growth.
It should be noted that in this regard the U.S. is in the same position as China and all large economies—for the detailed data on this see 从210个经济体大数据中,我们发现了中国和世界经济增长的密码.1
Figure 8
U.S. economic correlations are in line with economic theory
These factual relations in the U.S. economy are entirely in line with economic theory. Consumption plus investment constitute 100% of domestic GDP. Investment is an input into production: therefore, increasing the percentage of the economy used for investment will increase the GDP growth rate. However, consumption, by definition, is not an input into production and therefore increasing the percentage of consumption in GDP, thereby reducing the percentage of inputs into production, will decrease the rate of GDP growth.
To take a longer period than the last business cycle, the extremely strong correlation between the long-term percentage of net fixed investment in U.S. GDP and U.S. GDP growth is confirmed in Figure 9 which takes the entire period of U.S. economic development since 1960—that is, over a 64 year period. As may be seen the long-term correlation between the percentage of net fixed investment in GDP and annual U.S. GDP growth is an extremely high 0.87.
Figure 9
Policy implications for Trump
In terms of practical policy for Trump, therefore already even in one year the percentage of net fixed investment in U.S. GDP has a significant if moderate correlation with annual U.S. GDP growth. But this correlation it is not so high that it dominates the situation. That is, in the short-term Trump could, at least theoretically, increase U.S. GDP growth by measures other than increasing the percentage of net fixed investment in GDP. But over the medium and long-term these extremely high correlations mean that this is impossible—the U.S. can only increase its rate of GDP growth by increasing the percentage of net fixed investment in GDP.
However, practically, a short-term period is quite insufficient to reverse the consequences of the situation of much lower growth in the U.S. than in China—this could only be reversed over a long time period. To accelerate the U.S. economy in a way capable of competing with China, therefore, Trump and succeeding U.S. presidents can only do this by increasing the level of net fixed investment in the U.S. economy. This objective situation strictly determines the policy choices which face Trump.
The negative relation between the percentage of consumption in GDP and the growth of consumption
Given a confused discussion on consumption in some sections of the media, as an aside it should also be noted that the correlation between the percentage of consumption in U.S. GDP and the rate of growth of U.S consumption is strongly negative. That is, the higher the percentage of consumption in U.S. GDP the slower is the growth rate of U.S. consumption. In the case of U.S., taking a five-year moving average, the negative correlation between the percentage of consumption in GDP and the growth rate of consumption is an extremely high 0.89—see Figure 10. This is, in the U.S., the same negative correlation between the percentage of consumption in GDP and the rate of growth of consumption which exists in China and other major economies—for comprehensive data see 从210个经济体大数据中,我们发现了误解促消费对经济的危害.
This negative correlation between the percentage of consumption in U.S. GDP and GDP growth therefore confirms the extreme importance of distinguishing between the percentage of consumption in GDP and the rate of growth of consumption. Not only are they different things but they move in the opposite direction. That is in the U.S., as in China, the higher the percentage of consumption in GDP the slower will be the growth rate of consumption, and therefore the slower the growth rate of living standards.
Figure 10
International comparisons
Finally, to complete the picture, it should be noted that this situation of the U.S. in regard to the relation between the percentage of net fixed investment in GDP and GDP growth, as already noted, is in line with other very large economies—all of which have very similar patterns of development. To see how strong this relation is, Figure 11 shows the development of the world’s 10 largest economies over the entire last international business cycle of 2007-2019. (Once again, the entire business cycle is taken to remove the effect of short-term business cycle fluctuations, although it should be noted that extending the figures to the latest available data makes no essential difference to the correlations despite the fluctuations created by Covid). For the world’s 10 largest economies, including China and the U.S., the positive correlation between the percentage of net fixed investment in GDP and annual GDP growth is 0.95—as close to a perfect correlation as will be found in any practical example.
Figure 11
Growth accounting
So far, to see accurately the determinants of U.S. economic development, the correlations of U.S. GDP growth with the structure of its economy as shown in the national accounts have been analysed. The reason for starting with this analysis is that national accounts are universally used in economics. However, it is also clarificatory to analyse the U.S. economy from the complementary viewpoint of growth accounting—that is measuring in terms of the inputs of capital, labour and total factor productivity (TFP). The fact that, as will be seen, the conclusions arrived at by the two methods are the same, confirms the decisive factors determining U.S. growth.
Taking long-term correlations, Figure 12 therefore shows the long-term correlation of the contributions of inputs of capital (capital services) to GDP growth and U.S. GDP growth during the whole of the last business cycle from 2007-2019. This shows an ultra-high correlation of 0.95 and an R squared of 0.90—once again as close to a perfect correlation as will be found in any real economic phenomenon.
Figure 12
For comparison Figure 13 shows the correlation in the U.S. economy of the contribution to GDP growth of labour inputs. As may be seen the correlation is 0.51 and the R squared is 0.26—that is a moderate/low correlation.
Figure 13
Figure 14 shows the correlation of the contribution of the growth of TFP and the annual growth of GDP in the U.S. economy. The correlation is 0.60 and the R squared 0.40—that is a moderate correlation.
Figure 14
In summary, there is an extremely high, almost perfect correlation, in the U.S. economy between capital inputs and GDP growth, a medium correlation between TFP growth and GDP growth, and a moderate/low correlation between labour inputs and GDP growth.
This finding of the extremely high correlation in the U.S. economy between capital inputs and GDP increase, using growth accounting methods, is entirely in line with the conclusion from national accounts data.
The contribution of factors of production to U.S. GDP growth
So far only the correlations between production inputs and GDP growth in the U.S. have been analysed. But this is insufficient by itself to analyse what are the key determinants of U.S. GDP growth: there may be a high correlation between an input into U.S. production and GDP growth, but if this factor of production only accounts for a small part of U.S. production it will not play a decisive role in U.S. GDP growth. Therefore, to accurately analyse the determining factors in U.S. growth, it is also necessary to know the relative weight of the different inputs. Figure 15 shows this. As may be seen by far the largest contributor to U.S. GDP growth is capital inputs (58%), second is labour inputs (33%) and finally growth in TFP is a small contribution (9%).
In short, therefore, summarising the significance of different factors of production in U.S. GDP growth:
Capital investment dominates U.S. GDP growth, being both the highest contribution to growth and with the closest correlation to GDP growth.
Labour inputs are the second largest source of growth in the U.S. economy, although having only slightly over half of the weight of capital inputs, but they have only a medium/low correlation with GDP growth.
TFP has a moderate correlation with U.S. GDP growth but it only contributes a small part, 9%, of U.S. GDP growth.
In summary growth accounting confirms the national accounts data that capital investment is by far the decisive factor in U.S. economic growth.
Figure 15
Conclusion
In summary, to return to the starting point of whether Trump can close the gap in growth rates between China and the U.S.. If Trump cannot substantially slow China’s economy, the issue of which was discussed in 能否实现2035年远景目标?有一个关键事实中国无法回避, then it should be noted:
In the short term, the U.S. economy under Trump is likely to experience some slowing in 2025.
More fundamentally, the only way that Trump can increase the underlying growth rate of the U.S economy is by increasing the level of net fixed capital formation in U.S. GDP.
The reason that in this article such precise detail of the situation of the U.S. economy has been gone into is because this situation that Trump can only significantly increase the growth rate of the U.S. economy by increasing its level of net fixed investment in U.S. GDP is of fundamental importance—with huge consequences flowing from it. It means, if the U.S. cannot slow China’s economy, then the only way in which it can close the growth rate gap with China is by increasing the level of fixed investment in the U.S. The forms in which Trump attempts to increase the percentage of investment in GDP will therefore determine the dynamics of the U.S economy—with great consequences for U.S. domestic politics and U.S. geopolitics as it affects China.
Analysis of this will form the subject of the second article in this series.
Appendix 1—a technical statistical note
This appendix is not necessary to be read by non-economic specialists. It is included because the conclusion that it is impossible in practice to raise the U.S. GDP growth rate without increasing the level of net fixed capital formation in U.S. GDP is so fundamental in its consequences that it is included to show that there has been no “cherry picking” of the data and therefore it is impossible to escape the consequences of this correlation.
Statistically, as the U.S. economy, as with all capitalist ones, has business cycles, in addition to an underlying long term growth rate, it is preferable, to accurately see trends, to make calculations covering an entire business cycle—or from one point in one business cycle to the same point in another (for example from the top of one cycle to the top of another, or from bottom to bottom). Otherwise, cyclical effects obscure the fundamental trends or even produce entirely fallacious results. For example, if the starting point of measuring U.S. economic growth is taken as 1933, the bottom point of the Great Depression, to the peak of the last pre-World War II business cycle in 1937, then during that period the U.S. had an annual average growth rate of 9.4%. The 1930s might appear as a period of rapid economic growth! The reason for this is that the gigantic fall in U.S. GDP, of 26%, between 1929 and 1933 is ignored, that is two peaks in the business cycle are not being compared but a trough and a peak.
For this reason, in this article the entire U.S. business cycle from 2007-2019 is taken as the period focused on. However, to avoid any suggestion that 2019 is chosen as the end date to avoid bringing data up to date, Table 2 shows the entire period from 2007 to the latest available data, for 2024. As may be seen this makes no qualitative difference to the trends.
The one-year correlation between the percentage of net fixed capital formation in the U.S. economy and GDP growth is 0.50, which is a moderate correlation. However, if a five-year period is taken the correlation rises to a high 0.73 and if a 12-year correlation is taken it rises to an extremely high 0.85—by far the highest positive correlation of any major component of the U.S. economy and U.S. GDP growth.
This confirms the fact, the fundamental point, that in the short term no single factor has an extremely high correlation with U.S. GDP growth, but in the medium/long term the correlation between the percentage of net fixed capital formation and U.S. GDP growth is so high that it is impossible to speed up U.S. economic growth without increasing the percentage of net fixed capital formation in GDP and that any reduction in the percentage of net fixed capital formation will reduce the GDP growth rate.
If there is a strong underlying correlation, however, then if very long periods of time are taken, as in the 1960-2024 period in Figure 9 above, then the correlations typically become less affected by whether similar periods in the business cycle are being compared.
The conclusion is therefore clear. In practice the U.S. cannot break out of its present low average annual growth, of slightly above two percent a year, without increasing the percentage of net fixed capital formation in GDP. Or, in comparative terms, if the U.S, cannot succeed in slowing China’s economy, then the U.S. can only decrease China’s lead in growth rate by increasing the percentage of net fixed capital formation in the U.S. economy.
Table 2
Notes:
1. The only exceptions to this are the relatively small number of economies dominated by oil and gas exports, which is not relevant for either the U.S. or China, as neither are dominated by oil/gas exports.
This article was originally published in English at Monthly Review and in Chinese at Guancha.cn.
There can be no doubt that the government’s announcement on welfare ‘reforms’ amounts to a fierce assault on the well-being of the most vulnerable in society. As this will cause a significant backlash for relatively modest projected savings, the question arises, Why would they do this?
The answer lies in the common interests of workers and poor. Although they are an enormously heterogeneous mass of individuals their pay and conditions are each linked to the overall fight between labour and capital over the share of national income.
In effect, impoverishing those on welfare is an attempt to pick off the most vulnerable sections of the working class and poor by targeting them, and to lay the basis for wider and broader attacks on living standards.
In the first instance this is a savage, targeted austerity imposed on those entitled to benefits. According to the Resolution Foundation, if the Government plans to save £5 billion from restricting PIP by making it harder to qualify for the ‘daily living’ component, this would mean between 800,000 and 1.2 million people losing support of between £4,200 and £6,300 per year by 2029-30.
It is disingenuous for ministers to present these reforms as providing broader benefits, which are tiny. Universal Credit (UC) support for up to four million families without any health conditions or disability will rise by around £3 a week. Clearly, this is a pittance by comparison.
The government also presents further cuts as savings, to be achieved by cutting the level of the health-related LCWRA (Limited Capability for Work-Related Activity) element within Universal Credit, which is currently claimed by 1.6 million people.
Scandalously, these proposed cuts are focused on young people (aged 16-21), who may no longer be eligible for any extra support, and those who fall ill in the future, as their additional support will be halved, from £97 per week in 2024-25 to £50 per week in 2026-27.
This is a policy based on Tory/reactionary tabloid headlines about feckless or indolent young people. These are the same young people already burdened by student debt, who suffer low wages and are more subject to precarious employment. Together these are a strategic project, which aim to permanently lower the expectations and living standards of an entire generation, compared to older workers.
Ministers have played fast and loose with the ‘savings’ element of this package. When challenged about the negative effects of these measures on other areas of social policy and their associated costs (housing, employment, skills, ill-health, mental ill-health, crime and so on), ministers have talked about the cuts being a moral issue, which is simply insulting to welfare beneficiaries.
But this fake moralism is also a tacit admission that the cuts will not lead to anything like commensurate savings, because of the negative impacts on other social budgets.
Ministers are rightly wary of trying to justify the cuts on the basis of savings. As the history of austerity has shown, cuts are not savings. Yet these cuts are also being made as the military budget is rising, there is £3billion a year for the Ukraine war ‘for as long as it takes’, non-doms are being sweetened with reduced taxes and fossil fuel companies’ windfall taxes are set to be abolished.
What is the real motivation behind these cuts? In effect it is an attack on all workers and poor people, with disabled people, the sick and young people first in the firing line. The effect of the cuts will be to force many people to take very low-paid and/or precarious work or go without income altogether. This in turn will have a general knock-on effect on the rate of pay and conditions for all workers on low-paid or average wages. It also paves the way politically for further cuts.
From 2010 onwards austerity has repeatedly transferred incomes and wealth from poor to rich and from labour to business in an attempt to revive the economy. These attempts have failed.
With these severe, targeted measures, the government hopes to have more success precisely because they are targeted on the most vulnerable, the least able to resist. It represents a further, vicious twist to the austerity policy that has been in place for 15 years.
At a time of budget cuts, the propaganda in favour increased military spending is positively dangerous domestically as well as internationally, as it could only occur at the expense of other, useful or productive areas of government spending. It is therefore vital for the defence of public services and public investment that the false arguments in favour of increased military spending are thoroughly rebutted.
Military ‘keynesianism’
There is an entire body of thought devoted to the idea of promoting military spending as an economic benefit dubbed by its supporters as ‘military Keynesianism’. The idea is a vulgarisation of Keynes’ work, which supporters suggest means that any type of government spending is beneficial to the economy, and given that military spending enhances the power and prestige of the country, then military spending should be prioritised.
The idea had fallen into disrepute partly because its advocates, not just prioritised military spending, but treated it as an exception. In no other sector of the economy did they argue that there would a benefit from increased government spending.
But the decisive development took place in the real world as the ideas behind military Keynesianism (and a left variant known as the ‘permanent arms economy’) were tested to destruction in the Viet Nam war. The US government granted itself unlimited published and covert budgets to fight the war and almost bankrupted itself in the process, as well as destroying the Bretton Woods economic system and unleashing global inflation.
A contrary example is from Britain’s own history. After World War II West Germany was not allowed armed forces. It was obliged to use its Marshall Plan funds for economic regeneration, which became known as the German ‘economic miracle’. Britain had no such restrictions and spent freely on the military. There was no British economic miracle and it became known as the ‘sick man of Europe’.
But in the present era, the suddenly reduced state of Western Europe’s military weight in the world has caused a widespread panic. In the drive to rearm, old or discredited ideas are being dusted off to justify the diversion of public funds, a blatant project of policy-based evidence-making. These include growing claims on the positive effects on technology, R&D and jobs.
None of these claims is correct.
Productive versus unproductive investment
The purpose of investment (GFCF, Gross Fixed Capital Formation) is either to replace or to supplement the existing level of fixed investment in the economy. It is the additional investment, Net Fixed Capital Formation which augments the existing level of fixed investment in the economy. This represents an increase in what was formerly called the means of production and is now more usually called the productive capacity of the economy.
Of course, building a factory that is never used or constructing one of Japan’s infamous (but largely mythical) ‘bridges to nowhere’ does not constitute useful or productive investment. The traditional mainstream definition of investment is an outlay on which there is a financial return.
Yet in many cases, government fixed investment will not include a direct financial return at all. This would apply to a new road or railway, or the latest technology in universities. But in each case there is a financial benefit to the users (who are not charged tolls, or in the form of quicker journeys or cheaper fares or who can develop new scientific methods, and so on). But the users will receive a financial benefit which raises prosperity generally. In turn, government will itself usually benefit from their increased economic activity through its ordinary tax receipts.
But this highlights the fallacy that there is any potential for prosperity through military spending. The benefits of these other categories of government spending arise because they boost other areas of activity. This is because the bridge, or road, or home is not just a social benefit. It has a monetary benefit to the users and then wider society. But there is no benefit to the wider economy from a tank, a bomb, or a missiles system. There is no benefit in terms of efficiency, speed, productivity to other economic sectors. Economically, military spending is not even a bridge to nowhere.
Inputs to military spending
There is also a widespread yet false claim that military spending is ‘jobs rich’. All types of government spending require labour inputs. Military spending is not unique in that respect, although some of its advocates never suggest that increased NHS spending, or greening the economy creates jobs at all.
But, since military spending does not add to the productive capacity of the economy, the labour used in the manufacture of weapons is the equivalent of Keynes’ digging holes and filling them in again. It has zero net economic benefit.
In a time of high unemployment, even digging holes and filling them in again can have the effect of a stimulus to wider job-creation (which was Keynes’ ironic point). But if the aim is to create better, higher-skilled, higher wage jobs, then there are far better ways to spend government money.
The military budget is already one of the largest areas of government spending, £53bn in 2022/23, behind only the Departments of Health and Education. It is more than the spending of the Departments of Housing, Transport and Work & Pensions combined.
In terms of direct employment, the MoD employs just under a quarter of a million military and civilian staff. But the claims made for military spending being ‘jobs rich’ rely on assertions about the effect of MoD procurement on creating jobs in the private sector arms industries and related services.
It would be easy to get bogged down in highly technical analyses in this area. Thankfully, though, this work has been down elsewhere, in analysis for the Scottish Government on what are known as ‘employment multiplier effects’. This is an analysis of the structure of the economy which then shows the relationships between inputs and outputs in the economy. The analysis applies to individual sectors and includes labour inputs.
Here the key point is the conclusion. This is that military spending has one of the lowest ‘employment multipliers’ of all economic categories. It ranks 70th in terms of the employment it generates, out of 100. Health is rated number 1. Everything from agriculture to energy to food manufacture, chemicals, iron and steel, to computers, construction, and a host of others in between all have greater ‘employment multipliers’ than military spending. Investing in health is two and half times more ‘jobs rich’ than investment in military spending.
Conclusion
The frenzy for increased military spending has generated an enormous number of spurious claims about it alleged economic benefits.
Since the outputs of military spending serve no wider economic purpose, these claims are clearly false. In terms of generating prosperity, military spending is completely wasteful government spending, as historical evidence shows.
The related claim that military spending generates jobs exaggerates its effects, even in these narrower terms. Many other sectors of the economy are far more ‘jobs rich’ that military expenditures. Many of these also have a wider economic better, such as health, construction, food and many manufacturing sectors.
The logic of government investment to restore prosperity and generate higher-skilled and paid jobs should be applied to these sectors instead.

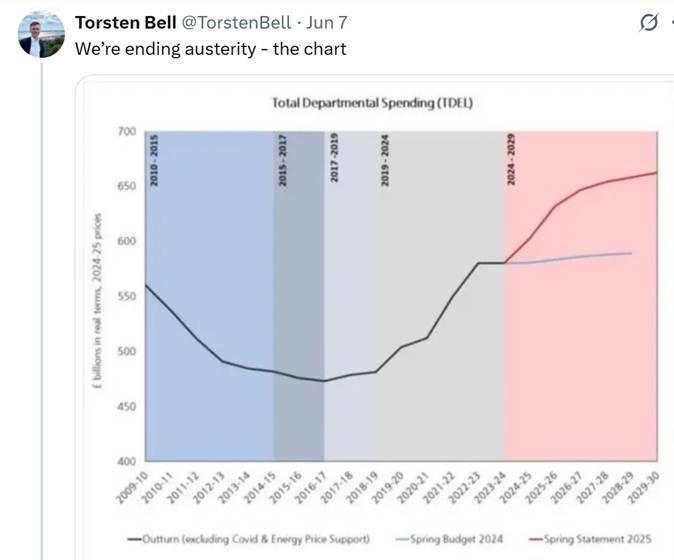
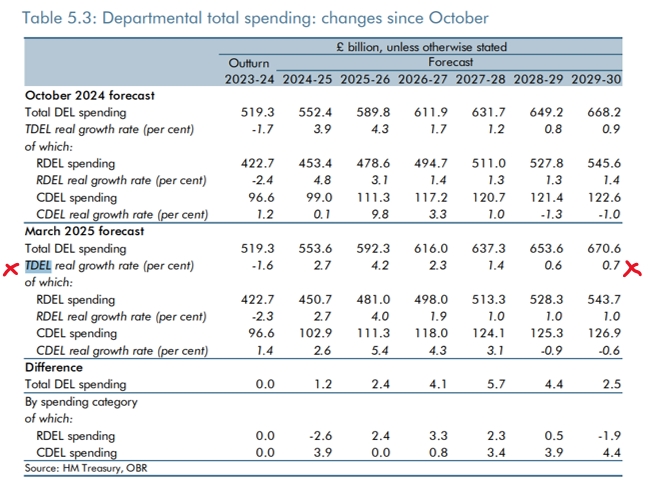
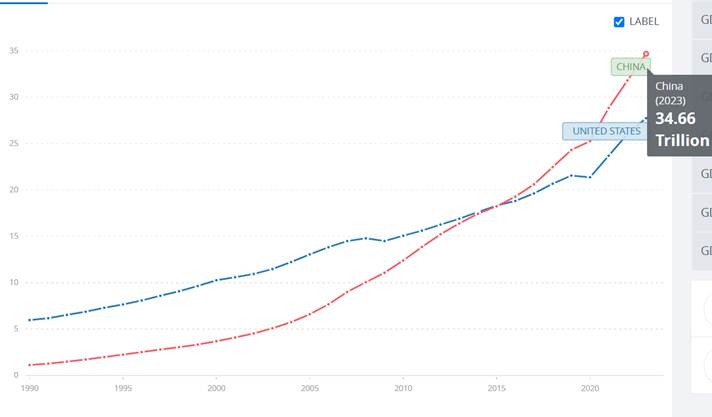

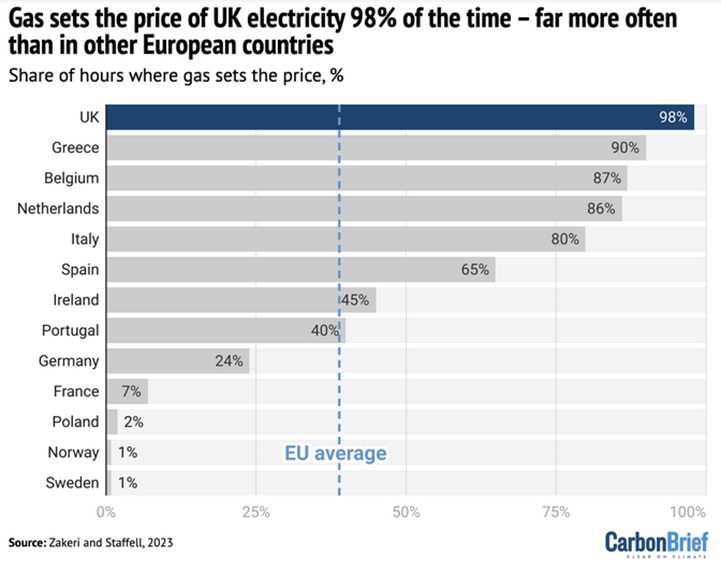
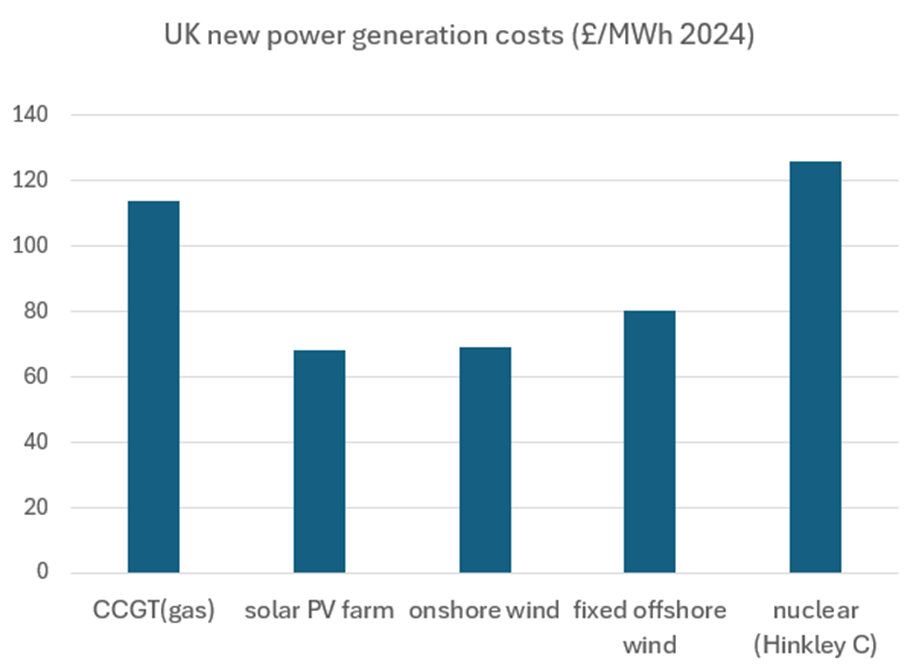
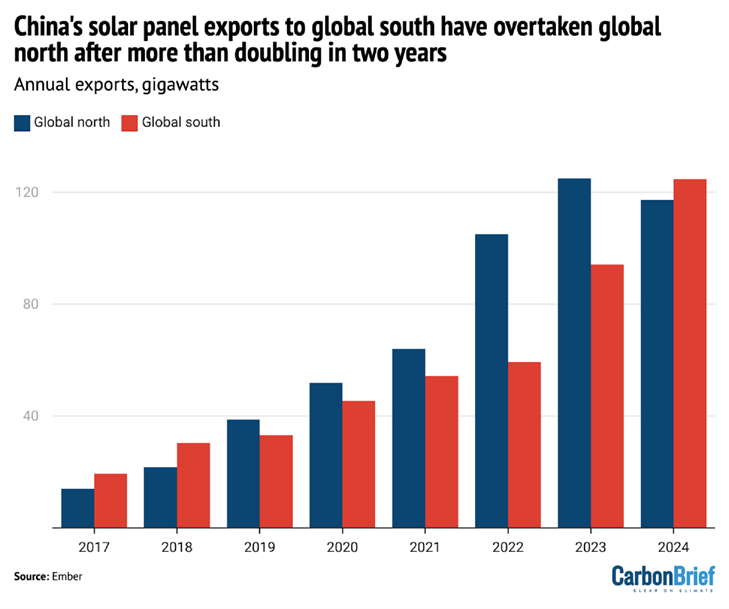
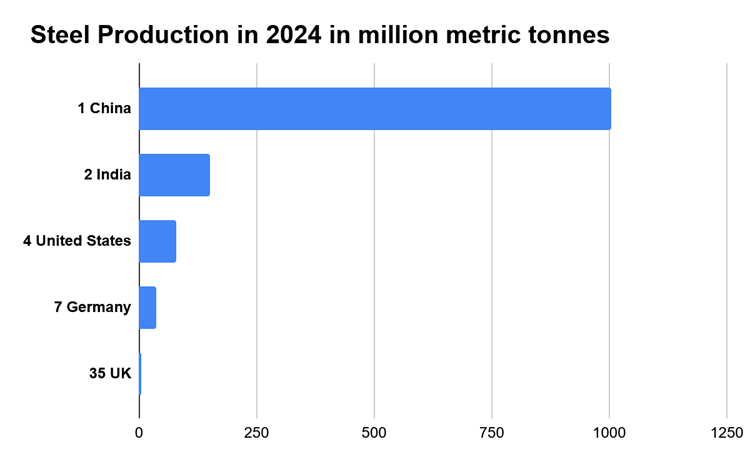


Recent Comments