The latest British GDP data are being hailed not just as the end of the recession but as the beginning of a strong recovery. These are widespread evaluations, but they are evidence-free. The actual data show that the private sector of the economy remains in recession. Instead, there is a splurge in government spending, both Consumption and Investment. This is not sustainable with current economic policies and structures, and the government’s own forecasts show they have no intention of continuing beyond the election.
The British economic situation is chiefly characterised by prolonged stagnation. This is primarily driven by weak private sector investment which is creating falling living standards on broadening horizon. Structurally weak private investment has recently been temporarily boosted by tax breaks, as will be shown. The government response in an election year is to make up the shortfall in the hope it will take it through to the election date.
The medium-term stagnation of the economy is clear from the fact that real GDP is now just 1.6% higher than the pre-pandemic peak in the 3rd quarter of 2019, 4½ years ago. At the same time, as a result of negative redistribution, from poor to rich, average living standards (GDP per head) are now 1.3% below their pre-pandemic peak. All of this is driven by weak business investment which is just 3.1% higher than its previous peak in the 3rd quarter of 2016, 7½ years ago. It is clear from these data alone that the fundamental trends in the British economy have not been altered by the latest quarterly data.
Private Sector Remains in Recession
But the contrast between the claims of recession end and an accurate analysis becomes quite stark once the data is examined in greater detail and the factual trends are revealed. Grant Fitzner, the chief economist for Office for National Statistics (ONS) was widely quoted as saying the economy is now “going gangbusters”. The reality is quite different.
In the first instance, it is impossible to examine real trends by highlighting the change in economic activity from one quarter to the next. The year-on-year date is much more useful, because more accurate in that light. On that measure, real GDP rose by just 0.2% in the 1st quarter of 2024, effectively a continuation of stagnation.
However, examining the sources of spending that comprise GDP shows a remarkable picture, completely undermining any idea that a self-sustaining recovery has begun. In effect, almost every major category of spending is contracting, the sole exception being Government spending.
Table 1 shows the changes in key components of real GDP in the 1st quarter. For completeness the changes are shown on the basis of both quarter-on-quarter and year-on-year terms.
Table 1. Changes in Real GDP and its components in 1st quarter 2024
In addition to its role in the economy through Consumption, the government also plays a significant role in Investment, although usually Gross Fixed Capital Investment (GFCF) is presented as a total, with Government Investment included in that total. As can be seen from Table 1, Business Investment (which accounts for the bulk of GFCF) fell faster than total GFCF in the 1st quarter.
In fact, general Government GFCF rose by 9.5% from a year ago in the 1st quarter. This magnifies the role that the public sector has played in boosting GDP. Inevitably, it also reduces further the role played by the private sector in rebound in GDP in the 1st quarter.
Chart 1. Below shows the recent trends in GDP and the main expenditure components. As can be seen, Business Investment has previously been stronger, based on tax breaks given to businesses which encouraged them to bring forward investment. This has now petered out and has become negative, along with other private sector expenditure (separately, both exports and imports are declining from a year ago). Only Government Consumption and Investment show a rising trend.
Chart 1. UK Real GDP and Expenditure Components, Q4 2022 to Q1 2024, % change y-o-y
These diametrically opposed trends in the public and private sectors becomes evident when examined in monetary terms. In year-on-year comparisons, real GDP rose by £1.169bn. The combined level of Government Consumption and Investment (GFCF) rose by £6.295bn over the same period. The private sector (including the statistically tiny non-profit sector) contracted by £5.126bn on the same basis. These are shown in Chart 2., below.
Chart 2. Real GDP and Public and Private Sector Sources, Q4 2022 to Q4 2024, change £bn
A Political Splurge of Spending
SEB has long argued for both an increase in Government Investment and Consumption as the alternative to austerity, although it has placed much more emphasis on Investment than others. That is because without an expansion in the means of production through Investment, it is not possible to sustain increases in Consumption. From ancient times farmers have understood that the greater proportion of this year’s crop preserved (Saving) for sowing next year (Investment) the greater the next crop will be, all other things being equal. Unfortunately, this is largely forgotten in modern neoliberal, and other Consumption-based economics.
But the conditions do not exist to allow this type of increase in Government spending to be sustained. First, from tax breaks to companies who respond by cutting Business Investment, to ignoring the effects of climate change, to stupid and reactionary spending on the military and deportation policies, a large proportion of the recent increase in Government Consumption is either wasteful or actually counter-productive. There is a huge misallocation of resources.
Secondly, given the acute requirement to adopt an Investment-led recovery programme which also tackles the crisis in public services, there is simply not the tax structure in the British economy to sustain this splurge in spending. The tax burden falls overwhelmingly on those who can least afford it, workers and the poor, and not on those who can, big business and the rich. This would need to be reversed to generate the tax revenues required.
Thirdly, the government itself does not intend to sustain either rising Investment or Consumption. The Office for Budget Responsibility (OBR) forecasts for government spending and its components are based on briefings from government departments about ministerial intentions. The government plans to cut both its own Consumption and Investment next year, if re-elected.
Excluding the welfare bill (which must rise because of an ageing population) the OBR estimates (pdf Table 4.4) that combined Government Consumption and Investment outlays will be cut in real terms by 7.1% by the end of the next parliament compared to the fiscal year just ended in April 2024. The government has no intention of sustaining these increases in spending and could not sustain them without a radical transformation of fiscal policy.
In 2014 and 2015 the Osborne/Cameron-led Coalition increased both government Investment and Consumption in the run-up to the 2015 election. It was a pre-election giveaway which worked, and they promptly slashed both once re-elected. Sunak and Hunt may be hoping to repeat the trick. The data certainly suggests that.
It would also be no surprise then to see the spending splurge continue all the way through to the election. But, extending unsustainable Government spending does not make it sustainable. Like any sugar rush, the comedown will only be harder the longer the binge continues.
The government is attempting to bribe its way to election victory, or least limit the scale of their losses. As this rise in spending is not sustainable, for the reasons shown above, the greater will be the next planned round of austerity after the election.
Recent well-publicised analysis has cast doubt on the sustainability or affordability of a United Ireland economy, arguing that it would cost taxpayers in the Irish Republic up to €20bn per year.
Below we reproduce an article, which first appeared on the Slugger O’Toole website in 2015, which attempts to address these long-standing arguments in a popular fashion.
For readers with a close interest in the topic, a much more detailed argument is presented here, also from 2015.
* * * * *
Growth and the ‘subvention’
By Michael Burke
The economic case for Irish unity is a growth story; that people across the whole of the island would be substantially better off. So, as the author of a recent report, the Economic Case for Irish Unity, I was disappointed but not surprised to find that most commentary on it related to the issue of the ‘subvention’.
Apparently, supporters of the Union want to make the case that the NI economy, which has always been part of the UK, is such a basket-case that there is no future for it except as a subsidy-junkie; Stockholm syndrome economics. Fortunately, this caricature is not accurate. But it does mean that the outlandish assertions on the subvention do need to be addressed.
In my own report (and previously on Slugger) I have offered Office for National Statistics data on the scope of the household subvention. To repeat, these are official ONS data not my own. These show that that the entire net effect of all direct and indirect taxes and benefits (including social security, pensions, education, health spending and so on) is an average transfer of £981 per household in NI. As there are 739,000 households this means that the total household subvention is approximately £700 million per annum. Again, in an effort to reduce the silliness about the provenance of the data, here is the entire ONS report.
£700 million is not nothing. But it doesn’t suggest NI is a basket-case either. Of course there are other elements of government spending, but it is this household net transfer (‘subvention’) which people have in mind when making assertions about the dis/benefits of the Union for the population of NI.
As well as other elements of government spending there are also other sources of government revenue, primarily the tax and National Insurance contributions from businesses. In order to gauge the net effect of these it would be necessary to compile them all.
Unfortunately, the Department for Finance and Personnel (DfP) efforts in this regard are woefully inadequate. The DfP claims that its own ‘Net Fiscal Balance Reports’ are comparable to the Government Expenditure and Revenue in Scotland (‘GERS’). This is simply untrue. Again, this is not personal verdict, but that of the main statistical body in the UK, the ONS. The ONS treats GERS as official data, a status it does not accord to the DfP’s efforts, with good reason.
To take one example of expenditure, much of the notional allocation of capital investment is simply done by DfP on a per capita proportion of the UK total. No data on public sector net investment is published for NI. But Crossrail in London costs £15 billion and HS2 is said to cost £40 billion, the new nuclear power stations at Hinckley Point will be more expensive still, and so on. On DfP methodology the ‘subvention’ will include an allocated share of these costs. The true picture is shown in the Coalition government’s £200 billion ‘National Infrastructure Plan’ in 2010 – there is nothing down for NI at all.
Further, the gaps in the revenue side render the DfP report valueless. In Table 3.7 of the latest report, of 28 revenue categories either the DfP or HMRC has no estimate for 12 of them. The ONS is right to withhold official status from the DfP reports. Yet the entire outlandish case on the ‘subvention’, and all the repetitions of it, are built on them.
The only hard data on the ‘subvention’ is provided by the ONS on the household component, which amounts to just £700 million. Perhaps, if all other items of government expenditure were also included (defence, civil service, state bodies, capital investment, interest, etc.), alongside the government revenues from the business sector (NICs, corporation tax, CGT, a small proportion of VAT, etc.) then the UK deficit was approximately £72 billion in 2013/14. A crude per capita allocation of that for NI would mean its share was £2.25 billion. This is an extremely crude method – but exactly the same as DfP’s.
Unfortunately, all the wild and foolish claims made on the subvention bring us no nearer to an understanding of the benefits and challenges of a unified Irish economy. This is because no serious economist would begin by asking what the fiscal implications of Irish unity would be without asking first about the growth implication. The fiscal position of any economy is determined primarily by its growth.
At the time of the founding of this state no country in Europe had a higher standard of living than Britain and NI. Now, half a dozen or more do. Britain is in a long-term relative economic decline and the economy in NI has fared even worse. It is the semi-detached carriage of a very slow-moving train.
A unified Irish economy provides the basis for an entirely new economy, marrying efficient public services with a dynamic multinational sector and requiring strategic public investment. In a growing economy the deficit takes care of itself.
GDP data for China, the U.S., and the other G7 countries for the year 2023 has now been published. This makes possible an accurate assessment of China’s, the U.S., and major economies performance—both in terms of China’s domestic goals and international comparisons. There are two key reasons this is important.
First for China’s domestic reasons: to achieve a balanced estimate of China’s socialist economic situation and therefore the tasks it faces.
Second, because the U.S. has launched a quite extraordinary propaganda campaign, including numerous straightforward factual falsifications, to attempt to conceal the real international economic facts.
The factual situation is that China’s economy, as it heads into 2024, has far outgrown all other major comparable economies. This reality is in total contradiction to claims in the U.S. media. This in turn, therefore, demonstrates the extraordinary distortions and falsifications in the U.S. media about this situation. It confirms that, with a few honourable exceptions, Western economic journalism is primarily dominated by, in some cases quite extraordinary, “fake news” rather than any objective analysis. Both for understanding the economic situation, and the degree of distortion in the U.S. media, it is therefore necessary to establish the facts of current international developments.
China’s growth targets
Starting with China’s strategic domestic criteria, it has set clear goals for its economic development over the next period which will complete its transition from a “developing” to a “high-income” economy by World Bank international standards. In precise numbers, in 2020’s discussion around the 14th Five Year plan, it was concluded that for China by 2035: “It is entirely possible to double the total or per capita income”. Such a result would mean China decisively overcoming the alleged “middle income trap” and, as the 20th Party Congress stated, China reaching the level of a “medium-developed country by 2035”.
In contrast, a recent series of Western reports, widely used in anti-China propaganda, claim that China’s economy will experience sharp slowdown and will fail to reach its targets.
Self-evidently which of these outcomes is achieved is of fundamental importance for China’s entire national rejuvenation and construction of socialism—as Xi Jinping stated, China’s: “path takes economic development as the central task, and brings along economic, political, cultural, social, ecological and other forms of progress.” But the outcome also affects the entire global economy—for example, a recent article by the chair of Rockefeller International, published in the Financial Times, made the claim that what was occurring was China’s “economy… losing share to its peers”. The Wall Street journal asserted: “China’s economy limps into 2024” whereas in contrast the U.S. was marked by a “resilient domestic economy.” The British Daily Telegraph proclaimed China has a “stagnant economy”. The Washington Post headlined that: “Falling inflation, rising growth give U.S. the world’s best recovery” with the article claiming: “in the United States… the surprisingly strong economy is outperforming all of its major trading partners.” This is allegedly because: “Through the end of September, it was more than 7 percent larger than before the pandemic. That was more than twice Japan’s gain and far better than Germany’s anaemic 0.3 percent increase.” Numerous similar claims could be quoted from the U.S. media.
U.S. use of “fake news”
Reading U.S. media claims on these issues, and comparing them to the facts it is impossible to avoid the conclusion that what is involved is deliberate “fake news” for propaganda purposes—as will be seen, the only alternative explanation is that it is disgracefully sloppy journalism that should not appear in supposedly “quality” media. For example, it is simply absurdly untrue, genuinely “fake news”, that the U.S. is “outperforming all of its major trading partners”, or that China has a “stagnant economy”. Anyone who bothers to consult the facts, an elementary requirement for a journalist, can easily find out that such claims are entirely false—as will be shown in detail below.
To first give an example regarding U.S. domestic reports, before dealing with international aspects, a distortion of U.S. economic growth in 2023 was so widely reported in the U.S. media that it is again hard to avoid the conclusion that this was a deliberate misrepresentation to present an exaggerated view of U.S. economic performance. Factually, the U.S. Bureau of Economic Analysis, the U.S. official statistics agency for economic growth, reported that U.S. GDP in 2023 rose by 2.5%—for comparison China’s GDP increased by 5.2%. But a series of U.S. media outlets, starting with the Wall Street Journal, instead proclaimed that the “U.S. economy grew 3.1% over the last year”.
This “fake news” on U.S. growth was created by statistical “cherry picking”. In this case comparing only the last quarter of 2023 with the last quarter of 2022, which was an increase of 3.1%, but not by taking GDP growth in the year as a whole “last year”. But U.S. growth in the earlier part of 2023 was far weaker than in the 4th quarter—year on year growth in the 1st quarter was only 1.7% and in the 2nd quarter only 2.4%. Taking into account this weak growth in the first part of the year, and stronger growth in the second, U.S. growth for the year as a whole was only 2.5%—not 3.1%. As it is perfectly easy to look up the actual annual figure, which was precisely published by the U.S. statistical authorities, it is hard to avoid the conclusion that this was a deliberate distortion in the U.S. media to falsely present a higher U.S. growth rate in 2023 than the reality.
It may be noted that even if U.S. GDP growth had been 3.1% then China’s was much higher at 5.2%. But the real data makes it transparently clear that China’s economy grew more than twice as fast as the U.S. in 2023—showing at a glance that claims that the U.S. is “outperforming all of its major trading partners”, or that China has a “stagnant economy” were entirely “fake news”.
Many more examples of U.S. media false claims could be given, but the best way to see the overall situation is to systematically present the overall facts of growth in the major economies.
What China has to do to achieve its 2035 goals
Turning first to assessing China’s economic performance, compared to its own strategic goals of doubling GDP and per capita GDP between 2020 and 2035, it should be noted that in 2022 China’s population declined by 0.1% and this fall is expected to continue—the UN projects China’s population will decline by an average 0.1% a year between 2020 and 2035. Therefore, in economic growth terms, the goal of doubling GDP growth to 2035 is slightly more challenging than the per capita target and will be concentrated on here—if China’s total GDP goal is achieved then the per capita GDP one will necessarily be exceeded.
To make an international comparison of China’s growth projections compared with the U.S., the U.S. Congressional Budget Office (CBO), responsible for the official growth projections for the U.S. economy on which its government’s policies rely, estimates there will be 1.8% annual average U.S. GDP growth between 2023 and 2033—with this falling to 1.6% from 2034 onwards. This figure is slightly below the current U.S. 12-year long term annual average GDP growth of 2.3%—12 being the number of years from 2023 to 2035. To avoid any suggestion of bias against the U.S., and in favour of China, in international comparisons here the higher U.S. number of 2.3% will be used.
The results of such figures are that if China hits its growth target for 2035, and the U.S. continues to grow at 2.3%, then between 2020 and 2035 China’s economy will grow by 100% and the U.S. by 41%—see Figure 1. Therefore, from 2020 to 2035, China’s economy would grow slightly more than two and a half times as fast as the U.S.
FIgure 1
The strategic consequences of China’s economic growth rate
The international implications of any such growth outcomes were succinctly summarised by Martin Wolf, chief economics commentator of the Financial Times. If China’s economy continues to grow substantially faster than Western ones, and it achieves the status of a “medium-developed country by 2035”, then, in addition to achieving high domestic living standards, China’s will become by far the world’s largest economy. As Wolf put it: “The implications can be seen in quite a simple way. According to the IMF, China’s gross domestic product per head (measured at purchasing power) was 28 per cent of U.S. levels in 2022. This is almost exactly half of Poland’s relative GDP per head… Now, suppose its [China’s] relative GDP per head doubled, to match Poland’s. Then its GDP would be more than double that of the U.S. and bigger than that of the U.S. and EU together.” By 2035 such a process would not be completed on the growth rates already given, and measuring by Wolf’s chosen measure of purchasing power parities (PPPs) China’s economy by 2035 would be 60% bigger than that of the U.S. But even that would make China by far the world’s largest economy.
Wolf equally accurately notes that the only way that such an outcome would be prevented from occurring is if China’s economy slows down to the growth rate of a Western economy such as the U.S. Clearly, if China’s economic growth slows to that of a Western economy, then, naturally, China will never catch up with the West—it will necessarily simply stay the same distance behind. Therefore. as Wolf accurately puts it the outcomes are:
What is the economic future of China? Will it become a high-income economy and so, inevitably, the largest in the world for an extended period, or will it be stuck in the ‘middle income’ trap, with growth comparable to that of the U.S.?
The progress in achieving China’s strategic economic goals
Turning to the precise figure required to achieve China’s 2035 target, China’s goal of doubling GDP required average annual growth of at least 4.7% a year between 2020 and 2035. So far China, as Figure 1 shows, is ahead of this goal—annual average growth in 2020-2022 was 5.7%, meaning that from 2023-2035 annual average 4.6% growth is now required.
China’ 5.2% GDP increase in 2023 therefore once again exceeded the required 4.6% growth rate to achieve its 2035 goal—as shown in Figure 1. From 2020 to 2023 the required total increase in China’s GDP to hit its 2035 target was 14.9%, whereas in fact its growth was 17.5%. This is in line with the 45-year record since 1978’s Reform and Opening Up, during which entire period the medium/long term targets set by China have always been exceeded.
Therefore, to summarise, there is no sign whatever in 2023, or indeed in the period since 2020, that China will fail to meet its target of doubling GDP between 2020 and 2035—China is ahead of this target. Such a 4.6% growth rate would easily ensure China becomes a high-income economy by World Bank criteria well before 2035—the present criteria for this being per capita income of $13,846.
It should be noted, as discussed in in detail below, that a clear international conclusion flows from this necessary 4.6% annual average growth rate for China to achieve its strategic goals. It means that China must continue to grow much faster than the Western economies throughout this period to 2035—that is in line with China’s current trend. However, if China were to slow down to the growth rate of a Western economy, then it will fail to achieve its strategic goals to 2035, may not succeed in becoming a high income economy, and will necessarily remain the same distance behind the West as now. The implications of this will be considered below.
Systematic comparisons not “cherry picking”
Having considered China’s performance in 2023 in terms of achieving its own domestic strategic goals we will now turn to actual results and a comparison of China with other international economies. This immediately shows the factual absurdity, the pure “fake news” of claims such as that the U.S. has “the world’s best recovery“ and “the United States… is outperforming all of its major trading partners.” On the contrary China has continued to far outgrow the U.S. economy not only in 2023 but in the entire last period. China’s outperformance of the other major Western economies, the G7, is even greater that of the U.S.
Entirely misleading claims regarding such international comparisons, used for propaganda as opposed to serious analysis, are sometimes made because data is taken from extremely short periods of time which are taken out of context—unrepresentative statistical “cherry picking” or, as Lenin put it, a statistical “dirty business”. Such a method is always erroneous, but it is particularly so during periods which were affected by the impact of the Covid pandemic as these caused extremely violent short-term economic fluctuations related to lock downs and similar measures. China’s assertion of superior growth is based on its overall performance, not an absurd claim that it outperforms every other economy, on every single measure, in every single period! Therefore, in making international comparisons, the most suitable period to take is that for since the beginning of the pandemic up to the latest available GDP data. As comparison of China with the U.S. is the most commonly made one, and particularly concentrated on by the U.S. media campaign, this will be considered first.
China’s and the U.S.’s growth in 2023
It was already noted that in 2023 China’s GDP grew by 5.2% and the U.S. by 2.5%—China’s economy growing more than twice as fast as the U.S. But it should also be observed that 2023 was an above trend growth year for the U.S.—U.S. annual average growth over a 12-year period is only 2.3% and over a 20-year period it is only 2.1%. Therefore, although in 2023 China’s economy grew more than twice as fast as the U.S., that figure is actually somewhat flattering for the U.S. Figure 2 shows that in the overall period since the beginning of the pandemic China’s economy has grown by 20.1% and the U.S. by 8.1%—that is China’s total GDP growth since the beginning of the pandemic was two and half times greater than the U.S. China’s annual average growth rate was 4.7% compared to the US’s 2.0%.
Figure 2
Economic performance of China and the three major global economic centres
Turning to wider international comparisons than the U.S. such data immediately shows the extremely negative situation in most “Global North” economies and China’s great outperformance of them. To start by analysing this in the broadest terms, Figure 3 shows the developments in the world’s three largest economic centres—China, the U.S., and the Eurozone. These three together account for 57% of world GDP at current exchange rates and 46% in purchasing power parities (PPPs). No other economic centre comes close to matching their weight in the world economy.
Regarding the relative performance of these three major economic centres, at the time of writing data has not been published for the Euro Area for the whole year of 2023 —which would be the ideal comparison. However, it has been published for the Euro area for the four quarters of 2023 individually and trends can be calculated on that basis. These show that in the four years to the 4th quarter of 2023, covering the period since the beginning of the pandemic, China’s economy has grown by 20.1%, the U.S. by 8.2%, and the Eurozone by 3.0%. China’s economy therefore grew by two and a half times as fast as the U.S. while the situation of the Eurozone could accurately be described as extremely negative with annual average GDP growth in the last four years of only 0.7%.
Such data again makes it immediately obvious that claims in the Western media that China faces economic crisis, and the Western economies are doing well is entirely absurd—pure fantasy propaganda disconnected from reality.
Figure 3
Relative performance of China and the G7
Turning to analysing individual countries, then comparing China to all G7 states, i.e. the major advanced economies, shows the situation equally clearly—see Figure 4. Data for China and all G7 economies has now been published for the whole of 2023. The huge outperformance by China of all the major advanced economies is again evident.
Over the four years since the beginning of the pandemic China’s economy grew by 20.1%, the U.S. by 8.1%, Canada by 5.4%, Italy by 3.1%, the UK by 1.8%, France by 1.7%, Japan by 1.1% and Germany by 0.7%.
In the same period China’s economy therefore grew two and a half times as fast as the U.S., almost four times as fast as Canada, almost seven times as fast as Italy, 11 times as fast as the UK, 12 times as fast as France, 18 times as fast as Japan and almost 29 times as fast as Germany.
In terms of annual average GDP growth during this period China’s was 4.7%, the U.S. 2.0%, Canada 1.3%, Italy 0.8%, the UK 0.4%, France 0.4%, Japan 0.3% and Germany 0.2%.
It may therefore be seen that China’s economy far outperformed the U.S., while the performance of all other major G7 economies may be quite reasonably described as extremely negative—all having annual average economic growth rates of around or even under 1%.
Figure 4
Comparison of China to developing economies
A comparison using the IMF’s January 2024 projections can also be made to the major developing economies—the BRICS. Figure 5 shows this, using the factual result for China and the IMF projections for the other countries. Over the period since the start of the pandemic, from 2019-2023, China’s GDP grew by 20.1%, India by 17.5%, Brazil by 7.7%, Russia by 3.7% and South Africa by 0.9%.
This data confirms that the major Global South economies are growing faster than most of the major Global North economies, which is part of the rise of the Global South and draws attention to the good performance of India. But China grew more than two and half times more than all the BRICS economies except India—China’s growth was 15% greater than India’s. It should be noted that India is at a far lower stage of development than the other BRICS economies—all the others fall in the World Bank classification of upper middle-income economies whereas India falls into the lower middle income group.
Figure 5
Comparison of China’s growth to Western economies
Finally, this outperformance by China casts light on what is necessary to achieve its own 2035 strategic targets. China’s 4.6% growth rate necessary to meet these goals means that it must continue to maintain a growth rate far higher than Western economies—Figure 6 shows this in overall terms in addition to individual comparisons given to major economies above. Whereas China must achieve an annual average 4.6% growth rate the median growth rate of high income “Western” economies is only 1.9%, the U.S. is 2.3%, and the median for developing economies is 3.0%. That is, to achieve its 2035 goals China must grow twice as fast as the long term trend of the U.S., almost two and a half times as fast as the median for high income economies, and more than 50% faster than the median for developing economies. As already seen, China is more than achieving this.
But such facts immediately show why it is an extremely misleading when proposals are made that China should move towards the macro-economic structure of a Western economy. If China adopts the structure of a Western economy then, of course, China will slow down to the same growth rate as Western economies—and therefore fail to achieve its 2035 economic goals. China will be precisely stuck in the negative outcome of the situation accurately diagnosed by Martin Wolf.
What is the economic future of China? Will it become a high-income economy and so, inevitably, the largest in the world for an extended period, or will it be stuck in the ‘middle income’ trap, with growth comparable to that of the U.S.?
Figure 6
Conclusion
In conclusion, in addition to objectively analysing 2023’s economic results, it is also necessary in the light of this factual situation to make a remark regarding Western, in particular U.S. “journalism”.
None of the data given above is secret, all is available from public readily accessible sources. In many cases it does not even require any calculations and simply published data can be used. But the U.S. media and journalists report information that is systematically misleading and in many cases simply untrue. While it lagged China in creating economic growth the U.S. was certainly the world leader in creating “fake economic news”! What was the reason, what attitude should be taken to it?
First, to avoid accusations of distortion, it should be stated that there were a small handful of Western journalists who refused to go along with this type of distortion and fake news. For example Chris Giles, the Financial Times economics commentator, in December, sharply attacked “an absurd way to compare economies… among people who should know better.” Giles did not do this because of support for China but because, quite rightly, he warned that spreading false or distorted information led to serious errors by countries doing so: “Coming from the UK, which lost its top economic dog status in the late 19th century but still has some delusions of grandeur, I can understand American denialism… But ultimately, bad comparisons foster bad decisions.” But the overwhelming majority of U.S. and Western journalists continued to spread fake news. Why?
First, the fact that identical distortions and false information appeared absolutely simultaneously across a very wide range of media makes it clear that undoubtedly U.S. intelligence services were involved in creating it—i.e. part of the misrepresentation and distortions were entirely deliberate and conscious, aimed at disguising the real situation.
Second, another part was merely sloppy journalism—that is journalists who could not be bothered to check facts.
Third, supporting both of these factors was “white Western arrogance”—an arrogant assumption, rooted in centuries of European and European descended countries dominating the world, that the West must be right. Therefore, such arrogance made it impossible to acknowledge or report the clear facts that China’s economy is far outperforming the West.
But whether it was conscious distortion, sloppy journalism, or conscious or unconscious arrogance, in all these cases no respect should be given to the Western “quality” media. It is not trying to find out the truth, which is the job of journalism, it is simply spreading false propaganda.
It remains a truth that if a theory and the real world don’t coincide there are only two courses that can be taken. The first, that of a sane person, is to abandon the theory. The second, that of a dangerous one, is to abandon the real world—precisely the danger that Chris Giles pointed to. What has been appearing in the Western media about international economic comparisons regarding China is precisely abandonment of the real world in favour of systematic fake news.
This is a shortened version of an article that originally appeared in Chinese at Guancha.cn.
About John Ross
John Ross is a senior fellow at Chongyang Institute for Financial Studies, Renmin University of China. He was formerly director of economic policy for the mayor of London.
The above article was originally published here by Monthly Review.
Einstein’s definition of insanity is repeating the same experiment and expecting a different outcome. Yet this is what is planned by the Labour front bench in terms of economic policy, a front bench who will be overseeing economic policy in the next parliament.
Labour has previously set out a minimal level of fiscal rules to be applied in office. They are extremely limited and can be read in full here (£). The rules consist of just 3 points:
Big changes in fiscal policy must be assessed for their impact by the Office for Budget Responsibility and there will be an Autumn Budget every year
There will be no borrowing for day-to-day (or current) spending and national debt will fall over time
Adopting an industrial strategy which offers subsidies to business.
There are some difficulties with each of these rules. But the first point to note is the Labour frontbench policy now goes way beyond the limits set by the fiscal rules, and in a way which is deeply damaging to the wider economy. Effectively, Labour is promising to extend and deepen austerity.
This can be shown in three ways. First, Labour has decimated its own plans for investment by scrapping the £28 billion a year green investment plan. It should be noted that the fiscal rules place no limits in advance on government Investment spending at all. Nothing in Labour’s fiscal rules, or indeed in any fiscal rules based on logic, prevents borrowing for Investment as Investment is the main determinant of the growth of the economy (and therefore a key factor in its fiscal position). There is now no meaningful plan to increase public Investment beyond its current miserably low level.
Secondly, Labour has recently declared that all types of new potential revenue-raising measures have been ruled out. Once again, this has nothing to do with the fiscal rules, which only state that there should be no deficit on day-to-day spending. It is therefore clearly a matter of choice whether a balance is achieved on current spending either through spending cuts (austerity) or by revenue-raising measures on big business and the rich (redistribution). A string of revenue-raising measures have been ruled out including; increases in Corporate (profits’) Tax, income taxes, including for the very high paid, wealth taxes and there are reports that even the small-scale policy on non-dom status is being watered down.
Thirdly, and this one of the most unremarked parts of the new austerity drive, is that Labour has no plans to reverse the huge imposition of austerity that took place over 2023 in the Budget and Autumn Statement. These delayed cuts are in effect ‘paying for’ the giveaways in the Budget and Autumn Statement. These cuts to services amount to a cumulative £78 billion over the 5-year period which mainly takes place in the next parliament. As the nominal amount of spending is fixed in the budgets which Labour accepts, the real terms cuts to departmental spending will be even deeper if inflation turns out to be higher than the official forecasts, as is already the case.
The depth of cuts is shown in the chart below from the Institute for Fiscal Studies (IFS). The totals in yellow are new tax cuts and spending on other areas. As SEB wrote at the time, this new spending was in four areas; subsidies to businesses, tax cuts for the higher paid, an ill-conceived scheme to increase demand for childcare without increasing supply, and military spending.
Chart 1. Middle and low-income earners are paying for the Tories’ priorities
Source: IFS
Clearly, these choices reflect Tory priorities in a pre-election period. They are a pointer to what might be expected from the coming Budget in March. Labour sticking to them suggests these priorities are shared with the Tories.
The big winners from these policies are inefficient businesses and the high paid. Owners of medium or large childcare facilities are also winners, along with military contractors. Everyone else is worse off once more.
The wrong framework and the wrong policies
To plan for more austerity is to plan for increasing misery, economic stagnation and further deterioration in public services. The arguments being made once more in favour of greater private sector involvement in the provision of public services and further deregulation are simply warmed-over Thatcherism. If privatisation and deregulation were an economic panacea, Britain would be close to an economic powerhouse now. As it is, under these policies the economy has shifted down a further gear, from very slow to an outright crawl.
Rather than attempt to alter the current economic trajectory, the Labour leadership has adapted to it. Its own fiscal rules are both flimsy and contradictory. There is no need, for example for debt to fall outright over time; it only needs to be manageable, which is guaranteed if the rate of return on Investment comfortably exceeds borrowing costs. It is also completely wasteful to subsidise companies who refuse to invest. 100% investment is guaranteed if the public sector undertakes the Investment itself.
But it should be clear that it is not these fiscal rules that are preventing logical and reasonable aims such as the £28 billion green investment programme. It is simply false to invoke the fiscal rules when they do not prevent Investment at all.
Instead, the Truss/Kwarteng debacle is repeatedly invoked by Labour frontbenchers as if a collapse in the financial markets is the inevitable consequence of doing anything other than the same as the Tory government. This is false and ignorant on two grounds.
Truss and Kwarteng’s mini-Budget was reckless and did lead to a collapse in financial markets, pushing both inflation and borrowing costs much higher. But borrowing for Consumption (unfunded tax cuts) is clearly reckless because there is no return on Consumption. Borrowing for Investment is completely different because there is an economic and financial return. No market slump is likely to follow.
Chart 2. UK 10-Year Government Bond (‘Gilt’) Yields
Source: FT
The Truss/Kwarteng Budget effectively of September 2022 doubled 10-year gilt yields from 2% to 4%, a large increase in borrowing costs, as shown in Chart 2 above. But there are two points to note. The first is that yields (the borrowing cost to the government) have since returned to that level. If lack of confidence was the key factor in pushing yields higher in the autumn of 2022, there is no greater confidence now under the current regime of permanent economic stagnation.
But the argument for doing nothing on borrowing or Investment made by the Labour frontbench neglects completely the real cost of borrowing. Adjusted for inflation, borrowing costs are close to zero. As the chief economics commentator for the Financial Times Martin Wolf once remarked in relation to the Osborne-Camron austerity, “if there are no potential investment projects with a return greater than zero, capitalism really is doomed.”
The paradox of the new Labour position on the economy is that, in the name of stability and prudence, a reckless new round of austerity is threatened, with all the misery and instability that will follow.
It is vital to have an accurate analysis of the international economic situation. This means an analysis without exaggeration in any direction – in serious matters neither “optimism” or “pessimism” is a virtue, only strict realism is.
Recently US President Bident said that China is “a ticking time bomb” because of its economic weakness. By contrast, the White House’s own verdict is that ‘Bidenomics is working’ (pdf).
This US type of misanalysis has been widely aired in the international media and relies on data taken from extremely short periods of time – statistical “cherry picking”.
This is always an error, but it is particularly so during periods affected by the impact of the Covid pandemic, as these caused extremely violent short-term economic fluctuations related to lock downs and similar measures. Therefore, to make international comparisons, the most meaningful period to take is the whole of the pandemic up to the latest GDP data – the third quarter of 2023.
The first feature which shows up from such data is the extraordinarily negative situation in most of the economies of the Global North – the advanced capitalist economies, more popularly known as “the West”. China’s economy continued to far outperform all major Global North economies.
To see this, the first chart below shows the developments in the world’s three largest economic centres – China, the U.S., and the Eurozone. These three together account for 57% of world GDP at current exchange rates and 46% in purchasing power parities (PPPs). Therefore, no other economic centre comes close to matching their weight in the world economy – indeed, at current exchange rates they account for the majority of the world economy, and in PPPs for almost half the world economy.
The relative performance of these major economic centres is clear. In the last four years, covering the pandemic, China’s economy has grown by 20.2%, the U.S. by 8.1%, and the Eurozone by 3.0%. China’s economy has therefore grown by two and a half times as fast as the U.S.. In turn, the situation of the Eurozone could accurately be described as extremely negative with annual average GDP growth in the last four years being under 1% – to be exact at 0.7%.
Turning to individual countries, and comparing China to all G7 states, the situation is equally clear – as shown in the second chart below. Over the four years to the 3rd quarter of 2023 China’s economy grew by 20.2%, the U.S. by 8.1%, Canada by 3.9%, Italy by 2.7%, the UK by 1.8%, France by 1.3%, Germany by 0.6%, while Japan’s economy shrunk by 0.4%.
In the period since the beginning of the pandemic China’s economy has therefore grown two and a half times as fast as the U.S., more than five times as fast as Canada, more than seven times as fast as Italy, 11 times as fast as the UK, more than 15 times as fast as France, more than 33 times as fast as Germany while Japan’s economy has shrunk.
In terms of annual average GDP growth during that period, China’s was 4.7%, the U.S. 2.0%, Canada marginally under 1.0%, Italy 0.7%, the UK 0.4%, France 0.3%, Germany 0.2%, and Japan -0.1%.
It may therefore be seen that China’s economy far outperformed the U.S., while the performance of all other major G7 economies was disastrous – with all of them having annual average economic growth rates of under 1%.
In Europe and the U.S. this rate of economic growth, much lower than China, has led to social and political instability – unpopularity of almost all European governments and intense political fighting between supporters of Biden and Trump in the U.S..
Two clear conclusions, therefore, follow from an analysis of the performance of the G7 economies and their comparison to China.
First, the performance of six out of the seven of the G7 economies is less than 1% a year annual average GDP growth in the last four years – a situation which may accurately be described as disastrous.
Second, China is far outperforming the U.S., but U.S. economic growth, an annual average 2.0% a year, is the only one out of the G7 which cannot be described as disastrous. Future posts in this series will, therefore, focus on the U.S. economy and its comparison to China.
China’s socialism has achieved the greatest improvement in the living conditions of any major country in world history.
As a result, the economic policy of China in the construction of socialism should be studied closely, not just by socialists but also by anyone interested in economic development, increasing well-being for the population as a whole and in poverty reduction.
It is worth briefly restating some of those key improvements in living conditions, which ought to be the prime consideration for all economic policy making.
In 1949 China was one of the poorest countries in the world in terms of per capita GDP (Maddison). It has since already achieved ‘moderate prosperity’ using IMF designations and is on course to become a high-income economy on the same basis. In 1950, China accounted for just 4.6% of world GDP (Maddison) and now accounts for 18% of world GDP (World Bank data for 2022).
China has also provided the greatest increase in life expectancy in the shortest period of time in human history. At the time of the Revolution in 1949, average life expectancy was just 35 years. Now it is just over 78 years.
Finally, China has achieved unparalleled success in reducing and then eliminating absolute poverty. China has lifted more than 850 million people out of World Bank-defined poverty in 40 years, which is by far the greatest poverty reduction achievement in human history. It has also now, after considerable focused effort, achieved the elimination of absolute poverty.
Unsurprisingly, these achievements have sparked a growing interest in China’s economy policies as a key to economic development. In addition, in most parts of the world China’s economic advances have fostered the growth in trade. So there are reasons of enlightened self-interest in understanding these developments even among those who would never describe themselves as socialists.
In the Global South there is widespread interest in the mechanics of China’s progress. On a very much smaller scale, there has also been the emergence of a committed band of supporters of China in the main Western economies. Most, but not all, are socialists or communists, who identify with the gains of the Chinese revolution and who oppose the new Cold War encirclement of it.
This article is addressed to these two groups, in the Global South and the smaller forces in the Western economies who are certainly not opposed to China’s rise and in many cases are strong and consistent defenders of it. Therefore, any differences or disagreements with them on economic policy in China should be understood as ‘contradictions among the people’; that is a debate about the shared goal of the best way to proceed.
Yet among those supporters of China and their many accounts of its progress there are repeated analytical gaps, particularly around ‘reform and opening up’, as well as a concerted effort to claim there has only been continuity, not discontinuity in the evolution of China’s economic policy. This is not supported by the Communist Party of China, and it does not correspond to the facts.
The point is not to generate heat where there should be greater light. Instead, given the enormity of China’s economic advances, it is extremely important that a rounded and accurate view of them is presented, so that anyone wishing to learn from the Chinese economic marvel can apply its lessons accurately.
The present author has relied on four important publications written by supporters of China’s economic achievements, as well as on economic data. As will be shown, even among strong sympathisers or supporters of China’s achievements there remains a degree of confusion about the mechanics of those achievements.
In this analysis there are four points that are paramount. They are necessary for an accurate understanding of the decisive factors which propelled China’s economic development. Taking the most important factors:
Was the de-collectivisation of agriculture after 1978, that is the introduction of the household responsibility system right or wrong?
Was the decision to remove medium and small companies from state ownership right or wrong?
But once these two fundamental and structural questions have been answered, they entail further huge consequences, which themselves pose further questions:
If agriculture is de-collectivised and small and medium enterprises are removed from state ownership, and as these are the largest in terms of employment, then large parts of the economy cannot be subject to planning, even if it was desirable. Is planning in the small and medium-sized enterprises more important than their economic development?
Was the opening up of the economy to international trade right or wrong? Of course, if the economy is open to trade it is not possible to fully plan the economy because the international economic situation cannot be controlled by the central planners.
If China is judged to be wrong on the de-collectivisation of agriculture and the removal of small and medium enterprises from state ownership, then the authors making those judgments do not agree with China’s economic reform. Yet, if China was correct to take these decisions then it does not have an economic structure that was the same as the USSR after 1929 right up to its collapse.
This is because, despite heroic efforts to claim otherwise there is not a continuity of China’s economic policy either to the USSR or to the pre-1978 China economy.
Each of the publications referred to below is valuable, even though there are many disagreements. These are: Reform and opening up: Chinese lessons to the world (pdf), De Freitas; China’s quest for a socialist future, Hammond, Becker, Puryear; The East is still red, Martinez;and China’s great road, Ross.
Worth studying and emulating
No country could possibly copy the Chinese model of growth in all its particulars, as each country has its own unique combination of general economic factors which must be considered. However, how China has handled its own unique combination of those economic factors may hold general lessons for the economic development of all.
Shortly after the Chinese Revolution took place in 1949 the average annual per capita GDP was equivalent to $448 (Maddison). Almost no other country was poorer than this. Since landlords, usurers and other parasites were still numerous, naturally the incomes for tens of millions was far below even this average. For comparison, the average annual per capita GDP in Western Europe in the year 1,000 (after the fall of Western Roman Empire) was equivalent to $425 (Maddison). Yet, by 2008 per capita GDP had reached $6,725 in China, the same level as the leading Western European economies in 1957.
That is, almost 1,000 years of Western economic development had been achieved in 60 years. That is the scale of the Chinese economic advance.
China is now poised to become a high-income country according to World Bank designations. This means that the majority of the world will have average incomes below China, some very substantially so. As a minimum, residents of those countries, who are the vast majority of humanity, have every interest in studying the dynamics of China’s economic growth.
For socialists and all those simply interested in poverty alleviation, China also offers the greatest example of poverty eradication in human history. Using World Bank criteria, it has lifted 800 million people out of poverty. Its rise has transformed the lives of the greatest proportion of the world’s population in history. It also did so more rapidly than other periods of fast growth historically, in the Industrial Revolution, or with American, ‘railroad-isation’, or the Russian Revolution. China’s rapid advance after the introduction of ‘reform and opening up’ directly impacted 22.3% of the world’s population.
Most importantly, As John Ross said, “this unmatched speed and scale of China’s economic development was achieved by a socialist and not by a capitalist country and economy.”
3 phases of development
There are three distinct phases of China’s economic development post-1949. The first was the enormous social and economic achievements of the period from 1949 until Mao’s death in 1976. The second was the period of ‘reform and opening up’ from 1978 onwards primarily under the leadership of Deng Xiaoping. The third phase effectively begins with the appointment of Xi Jinping as general secretary of the Communist Party of China (CPC) in 2013, and addresses the problems of development from a moderately prosperous to a high-income economy.
This third phase is beyond the scope of this article. Unfortunately, these problems are not ones that most of the world as yet deals with. This article concerns itself with the earlier phases of economic development.
First, it must be acknowledged that the period of Mao’s leadership was quite extraordinary in terms of human development.
In the publications referred to above, there is a general consensus about how extraordinary these are (only De Freitas could be described as somewhat lukewarm). This should not be surprising.
Contrary to the myth of Mao the monster (which Martinez debunks easily) the accurate picture is one where there were huge advances in infant mortality, in longevity, in literacy, the position of women, the position of national minorities and a host of other indicators under Mao’s leadership.
Of course, it can be objected that, having defeated the warlords, the foreign occupiers and their allies, reunified the country and establishing peace, some of these indicators at least were bound to improve. But since all of these were a product of the Chinese Revolution itself, led by Mao, this simply demonstrates the extraordinary scope of the impact on people’s lives under Mao’s leadership, political, military, social and economic.
Amongst supporters of Chinese socialism these matters are largely uncontested. These achievements are so enormous that anyone who failed to recognise them should not be expect to be taken seriously either in China or as an analyst of it.
Why was reform and opening up necessary?
The table below shows the real GDP growth of the Chinese economy and the world economy in the period 1950 to 1978 (two years after Mao’s death, when ‘reform and opening up’ was introduced).
Table 1. Changes in World and China GDP,
1950-1978, Real international $bns
1950
1978
Average annual % change
World
5,336
18,955
3.55
China
245
935
3.81
Source: Maddison, author’s calculations
Over the period after the Revolution and until the mid-1970’s the real GDP growth of the Chinese economy was steady but unspectacular. In effect, there was no qualitative difference between the growth rate in China and the average in the rest of the world. Crucially, Chinese growth was also substantially lower than some other countries in the region.
The implication is that the enormous social advances under Mao’s leadership (which were not at all generally taking place in the rest of the world) were primarily a product of policies of socialist redistribution. This reflected a conscious effort towards improving the lives of the poorest masses, with spectacular results.
But the fruits of redistribution begin to dwindle over time if there is not also a rise in production. For a poor socialist country such as China, this must also be through demonstrating the superiority of socialist production simply in order to catch up.
Both Martinez and Hammond et al obscure this truth by emphasising only the continuities of the socialist redistribution policies. What is largely ignored or downplayed is both the necessity of the reform and opening up process and its impact on growth and prosperity.
The astonishing successes of reform and opening up
In 1978 when the CPC, now under the primary leadership of Deng Xiaoping, introduced reform and opening up, China was still an agricultural society in which the peasantry numerically dominated.
Because of the predominance of agriculture, reform had to have as its foundation land reform and changes to the system of production. This was the corner-stone of the entire process and is frequently overlooked altogether.
Before outlining the process, the impact of it should be shown. This determines its objective importance, as well as its value as 1) the mechanism which has lifted hundreds of millions of people out of poverty, and 2) a process which can be learnt from and adapted to achieve similar results elsewhere.
The comparison in Table 1 is now reproduced, but this time it is the impact of the reform process that is shown by comparison from 1978 onwards.
Table 2. Changes in World and China GDP,
1950-2008, Real international $bns
1978
2008
Average annual % change
World
18,955
50,974
2.69
China
935
8,909
9.52
Source: Maddison, author’s calculations
The effects are clearly transformative. The growth rate of the Chinese economy is far greater than in the earlier and comparable period (which are roughly equal, 28 years versus 30 years). It also vastly outstrips the growth rate of the world economy, which had slowed over the period, while the Chinese economy sharply accelerated.
The post-Revolution economy moderately outperformed the world economy prior to reform and opening up. But after reform and opening up, it blew away the rest of the world’s growth rate.
Whereas in 1950 to 1978 the growth rate of the Chinese economy was barely above the world average (and therefore below many countries), now there is no major economy in the world which has matched China’s growth. From this basis, it is possible to vastly improve the lot not just of the average Chinese citizen, but particularly to vastly improve the position of the very poorest. This is exactly what the poverty eradication programme has achieved.
The mechanics of reform and opening up
Given the predominance of agriculture in employment, reform had to have as its foundation land reform and changes to the system of agricultural production. This was the cornerstone of the entire process. Yet it is frequently overlooked altogether even among supporters of China, such as Hammond et al and Martinez.
Yet if the key reforms are downplayed, there is no credible explanation offered either for the necessity of reform or its startling success. If China was going to accelerate beyond the average growth rate, major reform was required. As will be shown below, while these reforms have proved enduringly controversial, so much so that they are not endorsed by many China supporters, they are perfectly in line with the application of Marx and Engel’s thought (as well as Adam Smith’s).
Deng de-collectivised agriculture and stressed household responsibility, allowing peasants to exercise formal control (but not individual ownership) over land if they sold a contracted portion of their crops to the government.
The effect was to guarantee (crops permitting) the output from the agricultural sector which had previously passed into state hands for distribution among the population. At the same time the peasantry was provided with incentives to increase production beyond that portion which had already been contracted to an arm of the state. This led to a general, large and persistent increase in the output of the agricultural sector.
The growth in living standards arising from reform and opening up was decisively due to the success of these reforms.
Chart 1. Agricultural output in China, 1960 to 2022, (US$ 2015)
Source: World Bank
The sharp acceleration in China’s economic output through reform and opening up is evident from the chart above. It took 19 years, from 1960 to 1979 for China’s agricultural output to double. But it doubled again in the following 14 years, then doubled again in the subsequent 8 years.
In parallel industry was reformed. Private businesses were allowed, administered prices for goods were abolished, foreign capital and know-how was attracted in order to develop production.
It should also be noted what was not done (on which there is general consensus among China supporters). The main banks all remained state-owned, as did the majority of the state-owned enterprises in sectors such as major transport, energy production and distribution.
The state remained in control and ownership of the ‘commanding heights’ of the economy. The paramount peak in the banking sector, which allows some direction of private investment but crucially, the state-owned sector as a whole can regulate the level of investment in the economy.
As investment is decisive for growth in the means of production, the state’s ability to regulate the level of investment is decisive for economic development as a whole. In doing so, China has not abolished the capitalist business cycle. It has simply not allowed it to determine the economy as a whole.
The land reform itself required further reforms. If this was not to be a one-off trick to hoodwink the peasantry, then the additional output had to be sold to the market. This meant the growth of private markets in the agricultural produce. It also meant representative prices, market prices which are integral to those markets and determine how the peasantry was to be rewarded.
A similar approach was adopted with regarded to vast numbers of private small producers, who were allowed to establish businesses, charge for their services, use market prices and competition to win customers. What may have started as a sector dominated by blacksmiths and motor mechanics now includes accountants, lawyers, hairdressers, and so on.
It was the surge in output of all kinds, the increase in economic activity in general across all sectors and the consequent rise in tax revenues which also contributed to the state’s large resources to intervene in and develop the means of production.
On all of this, many of China’s supporters are completely silent. It seems probable that some have in mind an alternative economic model – the ending of the New Economic Policy in the Soviet Union, followed by the forced collectivisation of the land, the exclusion of foreign investors and nationalisation of the overwhelming majority of the economy, all of which largely took place under Stalin.
Now, many have argued that this was all necessary in the certain knowledge that war was coming. It is not obvious that this policy was a complete success when the Red Army was defeated by the far smaller Finnish army in 1940 (which so encouraged Hitler in his genocidal assault). But it would require vast research and analysis to establish whether the policy of centralising production was the necessary response to inevitable war.
There is, though a real-world verdict on whether this policy worked in the post-World War II period. In a parallel with the post-Revolution period under Mao in China, in the first twenty years after the 1945, the Soviet model clearly outstripped the growth of the world economy. The world economy doubled in size over that period, while the Soviet economy trebled.
Yet from the early 197Os that stronger performance went into reverse, even though the world’s main capitalist economies were themselves suffering a sharp crisis (especially after the US tore up the post-WWII Bretton Woods economic order because it could no longer pay for social peace at home and pursue the Viet Nam War). Essentially, the comparative growth rates were reversed in that period. The capitalist world grew more rapidly than the economy of the Soviet Union.
It is possible that the Soviet economic model was a necessary retreat from Marxism in preparation for war. That is unproven. But the peacetime verdict on the same model (discounting individual and secondary policy choices) was not even as robust as a global capitalism in crisis. We can be certain that this model is not optimal, because, unlike China’s, it could not survive the international capitalists’ peacetime onslaught.
That the Chinese policy of reform and opening up were perfectly aligned with Marxism will be outlined in the next and final section of this piece.
But there is one further point that should be addressed in relation to a widespread misinterpretation of the reform and opening up process. This is the incorrect claim that Foreign Direct Investment (FDI) was largely responsible for providing the resources for investment in the means of production that industrialised the economy and was the main spur to growth. This claim is made by De Freitas, Hammond et al and Martinez.
Naturally, if the transformational impact of reform and opening up is disregarded or downplayed, then logically there must be another factor at work which explains China’s extraordinary growth after 1978.
However, the explanation that it is FDI which played this role runs into two problems. The first is, it did not happen on anything like the scale required. The second is it assigns a magical role to the efficacy of private capital which it simply does not possess.
Chart 2. China Foreign Direct Investment as % of GDP, 1980-2022
Source: World Bank
Chart 2 shows the rate of FDI in China as a proportion of GDP. Contrary to widespread assertion, it is not a determining or even highly significant factor in China’s economic growth. It only exceeded 1% of GDP in 1992, long after China’s extraordinary economic acceleration had begun.
In addition, 1992 to 1999 was the only period in which China’s FDI was above the world average rate. Needless to say, the rest of the world did nothing to match China’s economic growth rate despite generally receiving higher levels of FDI.
More fundamentally, China has experienced double-digit GDP growth over large sections of that period. This is simply not feasible on the back of FDI rates that have mostly fluctuated between 1% and 3% of GDP. Even among strong supporters of investment in the means of production as decisive for growth, the textbooks would have to be torn up if such rates of return were possible.
Reform and opening up confirms Marxism
Finally, the reform process in China should not be treated as a deviation from Marxism, however successful. The truth is that Chinese economic policy and its success is precisely the application of longstanding Marxist economic theory on the development of socialism.
“The proletariat will use its political supremacy to wrest, by degree, all capital from the bourgeoisie, to centralise all instruments of production in the hands of the State, i.e., of the proletariat organised as the ruling class; and to increase the total productive forces as rapidly as possible.” – The Communist Manifesto, Marx and Engels
“Right can never be higher than the economic structure of society and its cultural development conditioned thereby.” – Critique of the Gotha Programme, Marx
Adam Smith first identified the decisive role of the division of labour in developing the productive capacity of the economy. Famously, he showed a single person working on their own could not even produce a pin without the inputs of a large number of other producers.
Marx adopted and revolutionised this finding with the concept of the socialisation of production, including both the living labour of others and accumulated or dead labour through the means of production.
Therefore, in theoretical terms, a decisive question for all producers, including the hundreds of millions of isolated and impoverished Chinese peasants after the Revolution was how to connect them to the wider economy and allow them far greater participation in the division of labour.
For the workers of the countryside and the smaller number of workers in the towns and cities, the question of the socialisation of production was paramount if they were to achieve higher living standards, and so too, in all probability was the question of the survival of the Revolution.
But, as Marx argued (in one of his most widely misquoted passages) in the Critique of the Gotha Programme, the transformation in the direction of ‘right’; meaning fairness and equality could only begin on the basis of the already existing economic and social conditions.
There was no basis for large-scale investment in mechanised agriculture to produce an abundance of food in post-Revolutionary China. The level of accumulation was too low.
The route to the socialisation of agriculture under these circumstances would come from connecting that great mass of peasants and other small producers to the market. With contractual safeguards in place for the continued output of foodstuffs to the state for redistribution, peasants would be allowed to produce for their own account, and sell that produce at market prices.
It was understood too that de-collectivisation and incentives to production for the market would lead to inequality. This too is perfectly in line with Marx’s arguments in the Critique of the Gotha Programme, where the goal of communism would be to transform society ‘from each according to their ability, to each according to their needs’.
But this would only take place after a period where the old society determines the scope of that progress, and where labour is rewarded for its output. That is, for a more or less prolonged period, rewards would not be on the basis of need.
“In the first phase of communist society, The right of the producers is proportional to the labour they supply; the equality consists in the fact that measurement is made with an equal standard, labour.
“But one man is superior to another physically, or mentally, and supplies more labour in the same time, or can labour for a longer time; and labour, to serve as a measure, must be defined by its duration or intensity, otherwise it ceases to be a standard of measurement. This equal right is an unequal right for unequal labour. …..But these defects are inevitable in the first phase of communist society as it is when it has just emerged after prolonged birth pangs from capitalist society. Right can never be higher than the economic structure of society and its cultural development conditioned thereby.”
In addition, because the new society is born out of the old, capitalist system, with all its terrible defects, shortages and anarchy, then the task for the workers must be first the seizure of power then set about the twin tasks of wresting, by degree, all capital from the bourgeoisie and develop the productive capacity of the economy as rapidly as possible. As noted, above, this was the verdict of the Communist Manifesto, written long before the Critique of the Gotha Programme.
Note too, the differing timescales over the era after the seizure of power. The productive forces must be developed as rapidly as possibly, while capital must be wrested from the bourgeoisie by degree (emphases added -author).
This is precisely what happened in the period of ‘reform and opening up’. The Deng policy was obliged to include a partial reversal of the previous strategy for full collectivisation of the land. It had not worked, as it did not allow the vastly underdeveloped agricultural sector to participate fully in the socialisation of production on the basis of its existing economic and social conditions.
Finally, in the practical implementation of these policies there is no greater experience and no higher authority than the CPC itself. It is well-known (at least in pro-China circles) that it has issued a stinging criticism of the Cultural Revolution. It says,
“The Cultural Revolution was “the most severe setback suffered by the Party, the State and the people since the founding of the People’s Republic”. –
But in its (significantly less stringent) criticism of the Great Leap Forward, it also makes this important argument, that as late as 1958, “While leading the work of correcting the errors in the Great Leap Forward and the movement to organize people’s communes, Comrade Mao Zedong pointed out that there must be no expropriation of the peasants; that a given stage of social development should not be skipped; that equalitarianism must be opposed; that we must stress commodity production, observe the law of value and strike an over-all balance in economic planning; and that economic plans must be arranged with the priority proceeding from agriculture to light industry and then to heavy industry.”
These are the essential tenets of the reform and opening up process under the main guidance of Deng Xiaoping 20 years later.
But, more than the authority of any quotation or document, is the verdict of historical experience. China’s astonishing economic success took place because of these reforms, which correspond to the Marxist programme. The Chinese economy continues to thrive because the CPC has successfully applied the lessons of Marxist economic theory and practice to its own historical and national conditions.
If others want to learn from China’s experience in order to apply those lessons to suit their own economic and social conditions, the factual account must take precedent.
The G20 summit was an historic one. It marked a decisive change in the relative weight of the imperialist countries versus the Global South, to the benefit of the latter.
The G7 countries led by the US approached the G20 summit in India hoping for a repeat denunciation of Russia and its invasion of the Ukraine as in the Bali summit last year. A comparison of the 2 statements coming out of those summits indicates how much the world has changed in just a year. Then, the statement added to its denunciation of Russia claims that the majority of countries opposed Russia. But in a 34-page statement (pdf) the sole mentions of Russia were in relation to the negotiations brokered by Turkey between Russia and Ukraine around grain and other shipments, with hopes for their success.
The British government in particular was caught out by the changing alignments. PM Sunak had told the world, via the front page of The Times, that he was going to be lecturing PM Modi to ‘get off the fence over Russia’. Instead, there was no such instruction, and it might be said that the G20 as a group climbed up on the fence over Russia.
Of course, the change from one year to the next cannot be ascribed to long-term economic shifts. Politics takes primacy. Yet there are fundamental economic reasons why British Prime Ministers can no longer dictate to the Indian authorities. India has long since surpassed the British economy. And this relative weight in the world underpins the real relationship of forces between the two countries. This change in relative weights is so important it should be examined in a little detail.
In real terms and adjusted for Purchasing Power Parities (PPPs) the Indian economy re-surpassed the British economy in 1995 and is now more than 3 times greater in size, as shown in the chart below.
Chart 1. Indian and British real GDP in PPP-adjusted international $, 1990-2022
Source: World Bank
But the relatively sharp diminished size of the British economy means that this example has only an illustrative purpose. Naturally, the US remains the most import of the G7 countries and was the one pressing hardest for condemnation of Russia.
It is widely, if not universally accepted that the Chinese economy has re-surpassed the economy of the United States. It is certainly true using the same real, PPP-adjusted measures as earlier. According to World Bank data this happened in 2017. Now the Chinese economy is estimated to be almost 20% larger than the US, as shown in Chart 2 below.
Chart 2. China real GDP and United States real GDP in PPP-adjusted international $, 1990-2022
Source: World Bank
This is the most import change in the relative weights in the world economy. The renewed surpassing by China of the US economy is the leading factor in the transformation of the relative weights of key groups of countries internationally.
So, it is now a remarkable fact that, using the same measures of real PPP-adjusted GDP, that the BRICS countries have now surpassed those of the G7 economies as a group. BRICS comprises Brazil, India, Russia, China and South Africa.
According to World Bank data, 2022 saw the BRICS GDP rise to 43.83 trillion international dollars. This compares to the total for the G7 of 42.03 trillion international dollars. The scale of this transformation, led by China, can be indicated by reference to the relative sizes of the two groups of economies in 1990.
Then the G7 economies’ real GDP was 23.87 trillion international dollars, while the BRICS countries’ GDP was just 7.38 trillion international dollars. Over the span of 32 years, the G7 economies have not quite doubled. Over the same period the BRICS economies have grown nearly sixfold.
Without some disastrous intervention such as war, we should not expect these trends to alter. Sustained stronger growth over a 32-year period strongly suggests that the BRICS economies will continue to grow more rapidly than the G7 over the medium-term.
But there is also an important historical precedent. For much of recorded history, China and India were the two largest economies in the world. This is a natural outcome of being the two most populous countries in the world. It required military intervention in the form of invasion and colonisation to halt and then reverse their weightings in the world economy.
According to Angus Maddison data, China and India together accounted for almost 60% of world GDP from AD 1 and were still responsible for half of world output in AD 1,000. This remained true until the beginning of the 19th century. It was only after India’s colonisation by Britain and China’s dismemberment by a series of colonial powers in the mid-19th century that this position of economic leadership was challenged and then reversed. Even so, it was not until the end of the 19th century that the British economy surpassed the Indian economy and the US surpassed China. As recently as the late 1930s, the Chinese economy, despite all its ravages and humiliations, was still larger than Britain’s.
Therefore, in addition to stronger medium-term momentum, it is possible to say that the relatively stronger growth of the BRICS is a restoration of the natural global economic order, a return to the world on its proper axis.
The BRICS economies have history on their side, as part of a restoration and regeneration that began with decolonisation at the end of the Second World War. This has far-reaching implications for humanity as a whole, and international relations within it.
It should also be said that every non-economic measure taken to prevent this return to the natural order is by its nature reactionary and should be vigorously opposed.


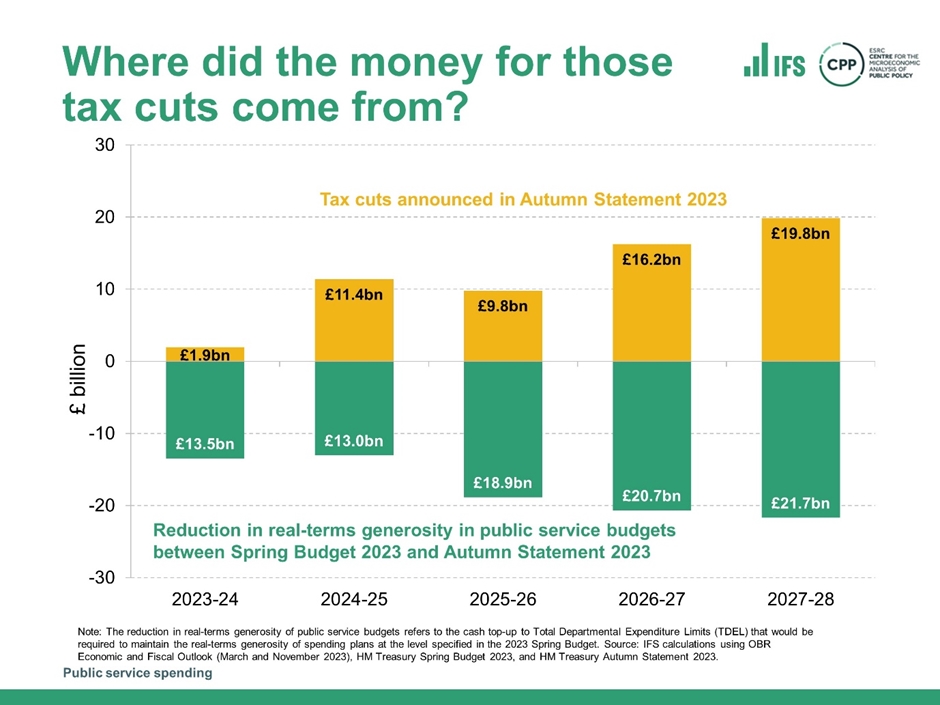
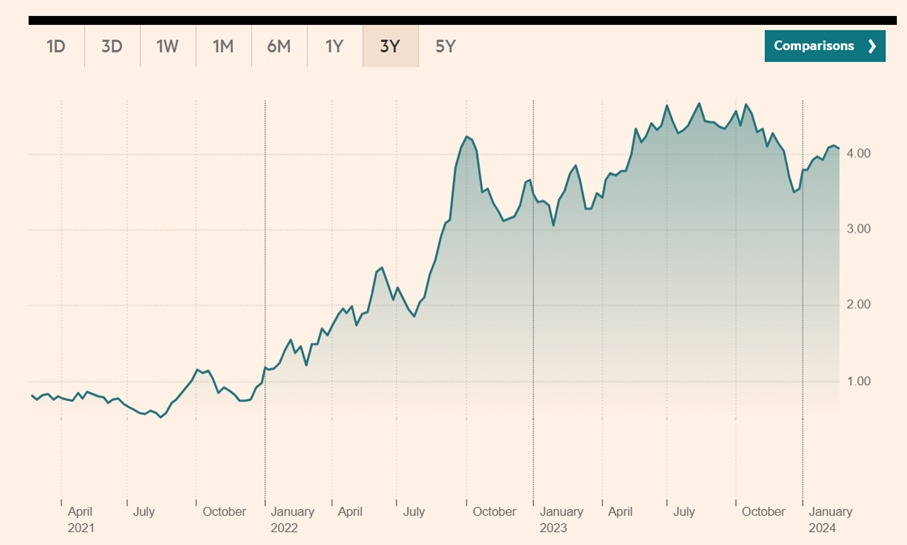
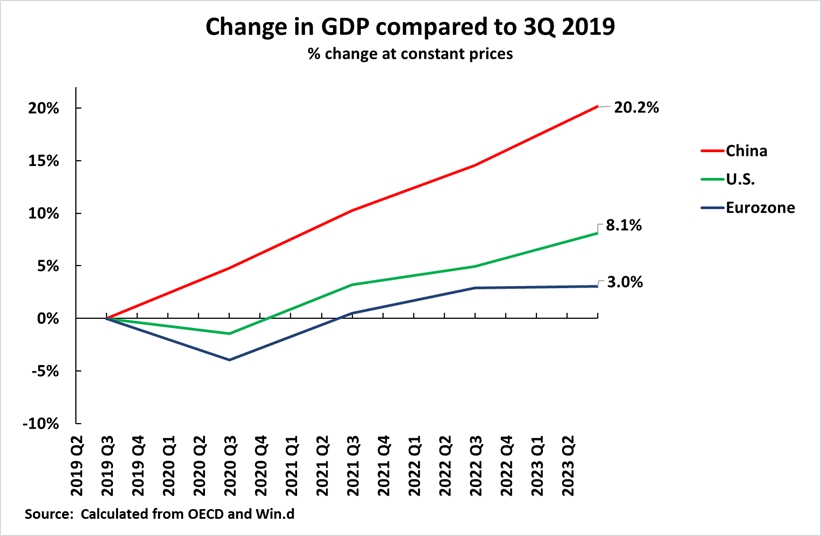
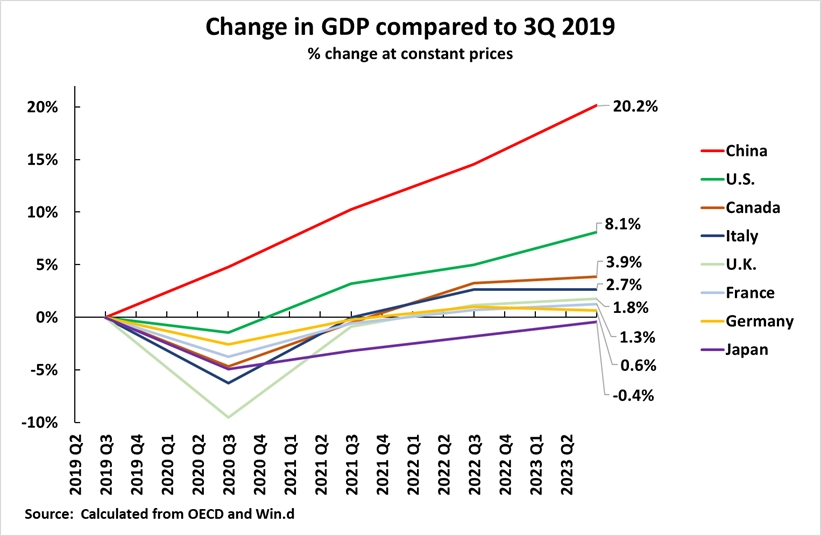
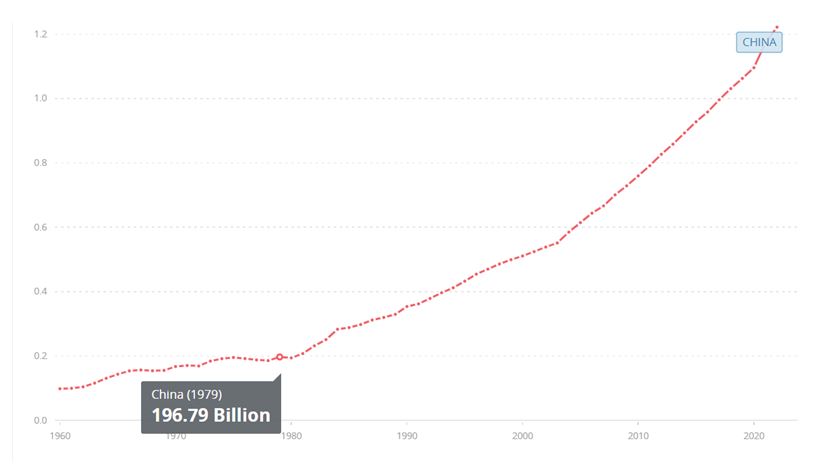
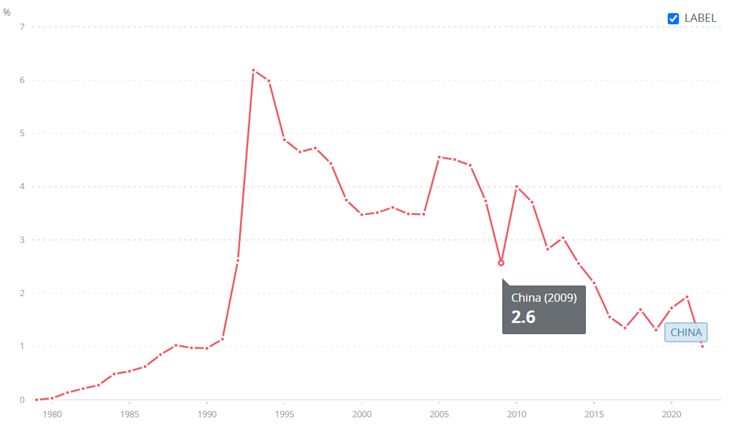
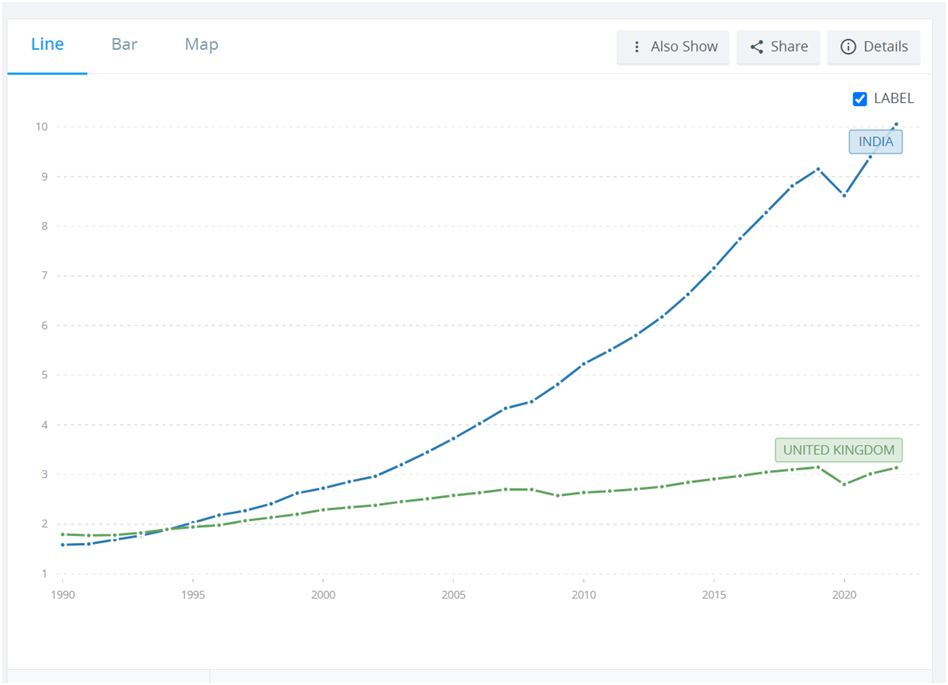
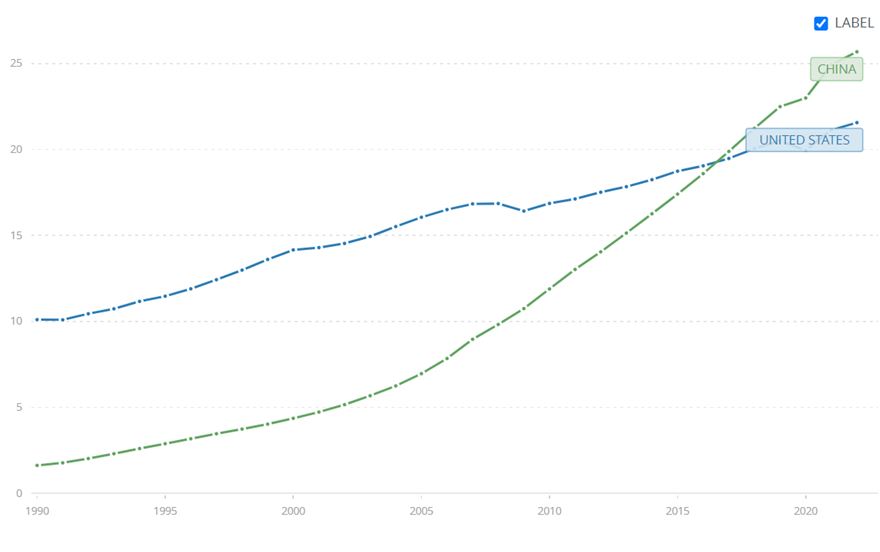
Recent Comments