January 2011

China’s growth, China’s cities, and the new global low-carbon industrial revolution

.226ZChina’s growth, China’s cities, and the new global low-carbon industrial revolution

A look at the by Nicholas Stern by Mark Watts

A thoughtful paper by Nick Stern,‘China’s growth, China’s cities, and the new global low-carbon industrial revolution’, published without great fanfare before Xmas, demonstrates that the widely promulgated view that China is rushing into exponential economic growth without regard to the growing environmental consequences is wide of the mark.

While most commentators fail to get past the frequently repeated statistics that China is now the biggest carbon emitter in the world and builds a new coal fired power station every week, Lord Stern, author of the eponymous ‘Stern Review’ on the economics of climate change, takes a closer look at the direction of Chinese environment and energy policy.

As Stern sets out “China is already at the forefront of the development of new low-carbon technologies and China has a great deal to gain by being in the vanguard of this new global growth story..China’s clear and strong action has been inadequately recognised and understood around the world."

Stern’s analysis is that China has no intention of simply aping the economic growth path of western countries:

“It is a profound and dangerous mistake to ignore these opportunities and to see the transition to low-carbon growth as a burden and a growth-reducing diversion. That mistake arises if you apply the crude growth models from the middle of the last century with their emphasis on fixed technologies, limited substitution possibilities, and simplistic accumulation. Modern growth models are about learning and technical change, and about substituting new inputs; and these models will also have to embrace interactions with the environment in terms of its influence on possibilities for both consumption and production…

“That is why I was so happy to learn, from a senior figure in the planning process, about the outline of the 12th plan, published in Chinese a few days ago. It does indeed embody a new model of growth, with its emphasis on domestic consumption and on efficiency. Together they will allow reduced saving rates without reducing growth rates. Further, and also of great importance, are the absolute cap on energy and the close attention to policies to reduce emissions. This plan is a landmark for China and for the world.”

While China’s future plans may be impressive, it is right that the country should be judged on its existing record. But as a report last year by the Climate Group, ‘China’s Clean Revolution: opportunities for a low carbon future’, demonstrated, China’s record on decarbonising its economy is far better than most popular perception would expect. For example:

· Since 1980 the energy intensity of the Chinese economy per unit of GDP produced has fallen by 60%

· 65% of all solar water heater installations in the world are in China

· 50% of all solar water heater manufacture takes place in China, along with 30% of global supplies of photo-voltaic panels (40% including Taiwan)

· While electric vehicles are still experimental in Europe and north America, there are already 50 million electric bikes on Chinese roads and China has the first mass produced hybrid plug-in car

· While the volume of car sales in China last year overtook those in the US, 60% of the Chinese market is for compact, more energy efficient vehicles

· Growth in installed wind turbines is faster in China than any country in the world, with wind power generating capacity topping 12mkWh in 2008, and doubling each year

China’s contribution to tackling climate change is, of course, crucial. As Nick Stern puts it:

“Starting at the current global level of 47 billion tonnes of CO2e p.a., the most plausible paths [to avoid irreversible catastrophic climate change] pass well below 35 billion tonnes of CO2e in 2030, and well below 20 billion tonnes of CO2e in 2050. These numbers, 35 billion tonnes in 2030 and 20 billion tonnes in 2050, are crucial. If we are serious about a reasonable chance of 2°C they are essentially global constraints. If we break them as a world it will be very difficult to catch up later. We cannot negotiate with the environment and the laws of physics and chemistry.

“For a 2°C path, the world’s average emissions per capita have to be around or below 4 tonnes of CO2e by 2030 (this is clear from dividing the constraints ‘well below 35 billion tonnes’ by a likely world population of 8 billion in 2030). Thus China’s emissions per capita would likely have to be in 2030 around or below its current level of 6-7 tonnes for the world to have some chance of a 2°C path. That would mean that China would have to return to something like a total of 8-9 billion tonnes of emissions by 2030. In other words, if China is to grow at 7% p.a. for the next two decades and we hope, because China is still a poor country, growth rates will be at least 7%, it would have to cut emissions per unit of output by a factor of 4 over 20 years: if output goes up by a multiple of 4 in two decades and emissions return to their 2010 level in 2030 then emissions per unit of output must be cut by a factor of 4 in that period. This would mean cutting emissions per unit of output by 50% each decade or 29% in each five-year plan.”

Thus, while China’s per capita emissions remain only around a quarter of that of the average US citizen, and Stern argues “we must recognise the deep historical injustice in that the rich countries became wealthy with high-carbon growth but the poorest countries will be hit earliest and hardest by climate change.”

“Nevertheless China’s size and its growth make it inescapably central to any future efforts to manage climate change.. There is no country more important than China in leading the way to a radically different, more dynamic, and much more desirable form of growth. There is no more important power than the power of the example. China and the world as a whole have so much to gain from its leadership.”

· Nick Stern’s policy paper ‘China’s growth, China’s cities, and the new global low-carbon industrial revolution’ is published by the Centre for Climate Change Economics and Policy, Grantham Research Institute on Climate Change and the Environment’.

Why the British economy shrank in the last quarter

.615ZWhy the British economy shrank in the last quarter

By Michael Burke

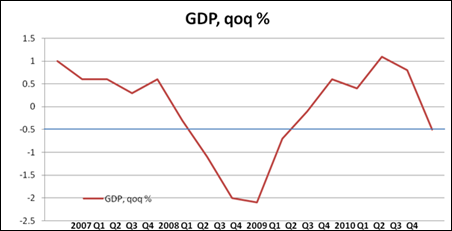
The fact that British GDP actually contracted by 0.5% in the 4th quarter of 2010 shocked many observers. It meant a decline after a year of moderate expansion. The fall means the British economy is now at a lower level than it was at the end of 2008, less than half way through the recession. The consensus among surveyed economists was that the economy would grow by 0.5% in Q4 – but even this would have represented a slowdown from the previous, modest pace of economic recovery. This is illustrated in Figure 1 below, which shows the slowing trend of the economy even before the latest awful data.

Figure 1

11 01 25 Figure 1

The government attempted to dismiss the data as simply reflecting the effects of severe weather at the end of last year. But Joe Grice, head of the Office for National Statistics (ONS) says that their best estimate is that the economy would have recorded zero growth in the quarter without the extreme weather conditions. Although this is not outright contraction, it is clear from the ONS statement that the underlying trend towards a marked slowdown in the economy continues.

Why Slowdown Now?

The question remains as to why the economy is on a slowing trend, especially as it is just 1 year into a modest recovery after the deepest recession since the 1930s? To analyse that it is important to examine the prior data. The first snapshot of the GDP data is simply an output measure, with limited detail and information on allocation of incomes or sources of expenditure. There is too no fine-grained data on the monetary value of GDP in the first release, so here only the data up to the third quarter of 2010 is examined, before the economy contracted once more.

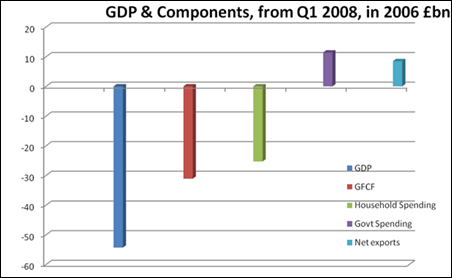
In Figure 2 the real monetary value of GDP and its components is shown, from the peak level at the beginning of 2008 to Q3 2010.

Figure 2

11 01 25 Figure 2

From the peak of the boom in Q1 2008 to Q3 2010 (the most recent data, which excludes the contraction in Q4) real GDP has fallen by £54.3bn. The major contributor to this slump remains the decline in investment, Gross Fixed Capital Formation (GFCF). It fell by £31.1bn, or 57% of the total fall. Household spending also fell by £25.3bn as falling real incomes, rising unemployment and expectations of worse to come all took their toll. But this is less than half the decline in investment. Offsetting those declines somewhat is the small rise in net exports, up £8.5bn. But the major upward contributor has been the increase in government spending, which rose by £11.4bn.

Clearly while investment has been the main source of the recession, government spending has been the main prop for the recovery. But in the national accounts data the level of GFCF from two sources, the private and the public sectors are brought under the same heading. This conforms to national accounting data in the EU and elsewhere. But in the US GFCF is separated into private and public components (as well as further subdivided into housing etc). If the same distinction is made between private and public investment in Britain, an even more striking picture emerges. This is because government investment was more than rising even while total GFCF was contracting.

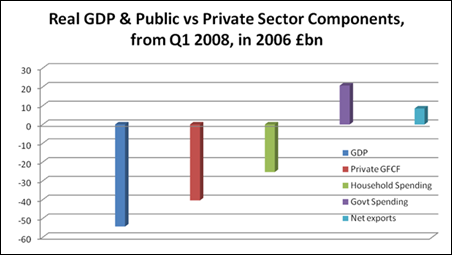
Over the course of the recession, as we have already noted, total GFCF fell by £31.1bn. But within that total, private sector investment fell by £40.4bn, while the government’s own investment rose by £9.3bn. This took the form of increased capital spending in areas such as the “Building Schools for the Future” programme, as well as hospital refurbishment and infrastructure investment and was part of the Labour government’s 2009 response to the crisis.

This distinction is shown in Figure 3. The category of GFCF has now become private sector GFCF, while government spending is comprised of government current spending as before plus the increase in government investment.

Figure 3

11 01 25 Figure 3

From Figure 3 it can be seen that the collapse in private sector investment is almost entirely responsible for the economic crisis- £40.4bn of a decline of £54.3bn, or three-quarters of the entire slump. If we take the total contribution to growth of government spending – both current spending and the public sector’s contribution to GFCF this rises GDP by £20.7bn.

This means that the economic contraction would have been far more severe without the rise in government spending.

It is known that government spending will decline under the Tory-led government. In fact current government current spending did contract in Q3 as the cuts policy began to be implemented. The fall was just £1.1bn, but it was the first such decline since the recovery began. The Q4 data will no doubt produce a larger cut in government spending, with further, steeper falls to come in 2011. Meanwhile the Labour government’s increased investment programme, which takes slightly longer to implement, will soon be crashed into reverse.

What Caused the Recovery?

Looking now at the earlier economic recovery, which ran for 4 quarters between Q4 2009 and Q3 2010, the total rise in output was £34.3bn from the low-point of the recession. The total rise in government spending during the recession and recovery amounted to £20.7bn. While much of that increase took place before the recovery began it will have been crucial in supporting the resumption in household consumption through welfare and other payments. In addition it will have fostered the rebound in GFCF as the private sector was encouraged to resume investment. In the one year long recovery, household consumption rose by £16.4bn, while GFCF rose by £12.0bn. Total government spending, including its contribution to investment was therefore directly responsible for 60% of the recovery – £20.7bn of a total increase of £34.3bn. Given the positive indirect effects on other categories of activity, it is no exaggeration whatever to say that government spending was responsible for the recovery.

It is clear now why the economy is slowing sharply. Osborne would like to blame it on the weather. But the reality is not a weather effect – as the ONS points out. There may well be a rebound in Q1, which would be unsurprising as some activity postponed in Q4 will take place now. But by removing the key prop to growth, in the form government spending, it is certain that the latest two quarters combined, Q4 2010 and Q1 2011, will see much slower growth on average than mid-2010. And 2011 will also see the effects of the VAT hike and widespread price increases which will all produce a sharp contraction in real incomes. Major cuts to capital spending are planned while benefits will be slashed in April.

It is easy to forget that the Tory-led government policy is dressed up in the name of deficit-reduction. But the deficit has been falling under the impact of stronger growth, itself induced by increased government spending. In the 2010 calendar year the borrowing requirement was £148bn, compared to a Treasury projection of £178bn for the Financial Year.

The policies of the Tory-led Coalition threatens to send both the economy and government finances into reverse.

Corporation Tax Cuts Don’t Lead To Prosperity

.170ZCorporation Tax Cuts Don’t Lead To ProsperityBy Michael Burke

In George Osborne’s Budget in June 2010 it was announced that the rate of corporation tax will be cut in a series of steps from 28% to 24%. This was part of a series of measures which, it is claimed, would boost growth. In fact they comprised part of a series of tax cuts for companies and the highly paid which amount to a giveaway of £12.4bn in 2014/15, almost exactly equal to the yield from the VAT hike of £13.45bn – which in contrast will come overwhelmingly from the pockets of the poor.

But, just as the package of tax measures are not about deficit-reduction at all, but a transfer of incomes from the poor to the rich, so the claim that lowering tax rates will lead to growth is also incorrect. The claim is that lower taxes increase the flow of Foreign Direct Investment (FDI). But the recent FDI Barometer produced by Think London, the agency that promotes FDI in London, shows that overseas investors are less likely to invest in London, not more likely because of recent developments in UK economic policy. In a survey of over 300 executives responsible for making FDI allocations, 60% said the lower tax rate would not change the attractiveness of London as an investment destination, 13% said it would make them more likely to investment, but 22% said it would make them less likely to invest. Therefore a net balance of 9% said lower corporate taxes would make London less attractive to investors!

In fact those surveyed were much more agitated about racist immigration policies – with 48% opposed to the Tory-led Coalition’s cap on non-EU immigration.

This is because FDI is not driven by corporate tax rates. At one end of the scale the highest corporate tax rates in the OECD are imposed by the US and Japan at 39%. Germany has a 30% rate. The lowest rates are in Iceland (15%) and Ireland (12.5%), which should be more a warning than a model!

FDI, in common with all investment, is driven by prospective rates of return. Some factors, such as geographical location are outside policymakers’ hands. But the quality of road, rail, air and port infrastructure are not. Likewise, the size of the market is outside policymakers’ hands, except over the very long run, but economic growth rates are not. In particular, studies repeatedly show that it is the quality and skills of the workforce that is the main policy-driven factor in attracting FDI.

Ireland, with the lowest corporation tax rate in the OECD, demonstrates this reality. It is an article of faith for the Dublin government and its supporters that the 12.5% rate is the key to attracting FDI. Both the Taoiseach Brian Cowen and the Finance Minister Brian Lenihan have taking to describing it as “our international brand”. In the 1998 Budget (introduced in December 1997) their predecessor as Finance Minister, Charlie McCreevey, introduced the legislation for a new regime of corporation tax that led to the phased introduction of the 12.5% rate of corporation tax from 1 January 2003 – down from 32%.

Figure 1 below shows what actually happened to FDI in Ireland before and after the cut to 12.5% corporation tax. In the period since the corporation tax was slashed there have been many quarters where there was a net outflow of FDI and the annual average total was an inflow of just €2.3bn. Before the rate was cut that annual average inflow was €17.7bn, and there was only one quarter of net outflow in FDI.

Figure 1


If FDI were measured relative to either the level of GDP or as a proportion of total investment, the before and after contrast would be even starker.

Clearly, low corporate tax rates did not leads to higher inflows of FDI, and are not responsible for it. But over a prolonged period the Irish economy has had a much greater share of world FDI inflows than would be suggested by the small size of the domestic economy.

Figure 2 below shows one of the main reasons why that is the case. It shows the percentage of the 20-24 year old population in EU countries who achieved at least an upper second level education. Ireland comes out top.

Figure 2


This also helps to explains why FDI investors don’t relish tax cuts. They aren’t fools. They know that low-tax economies do not have the resources to pay for investment in infrastructure, transport links and above all education- the factors that actually attract FDI. Low corporate taxes therefore do not attract, even deter FDI, as the London survey and the Irish experience demonstrate.

But George Osborne is a long-time fan of his fellow Thatcherites in Ireland. In fact the current Dublin government has far more fans in Downing Street than in Ireland, with its opinion poll rating dropping to 14% even before the latest resignations of nearly half the Cabinet. Determined to emulate the effects of Ireland’s Thatcherite economic policymaking, the Tory-led government has set out a course to lower corporate taxes. This will not attract FDI, but it does have the effect of allowing established companies to retain a greater proportion of their profits- and lowering wages and increasing capital’s ability to generate profits remains the essence of government policy. Reality shows there will be no increase in FDI to Britain due to lower corporate taxes.2

Corporation Tax Cuts Don’t Lead To Prosperity

.724ZyesCorporation Tax Cuts Don’t Lead To Prosperity

By Michael Burke

In George Osborne’s Budget in June 2010 it was announced that the rate of corporation tax will be cut in a series of steps from 28% to 24%. This was part of a series of measures which, it is claimed, would boost growth. In fact they comprised part of a series of tax cuts for companies and the highly paid which amount to a giveaway of £12.4bn in 2014/15, almost exactly equal to the yield from the VAT hike of £13.45bn – which in contrast will come overwhelmingly from the pockets of the poor.

But, just as the package of tax measures are not about deficit-reduction at all, but a transfer of incomes from the poor to the rich, so the claim that lowering tax rates will lead to growth is also incorrect. The claim is that lower taxes increase the flow of Foreign Direct Investment (FDI). But the recent FDI Barometer produced by Think London, the agency that promotes FDI in London, shows that overseas investors are less likely to invest in London, not more likely because of recent developments in UK economic policy. In a survey of over 300 executives responsible for making FDI allocations, 60% said the lower tax rate would not change the attractiveness of London as an investment destination, 13% said it would make them more likely to investment, but 22% said it would make them less likely to invest. Therefore a net balance of 9% said lower corporate taxes would make London less attractive to investors!

In fact those surveyed were much more agitated about racist immigration policies – with 48% opposed to the Tory-led Coalition’s cap on non-EU immigration.
This is because FDI is not driven by corporate tax rates. At one end of the scale the highest corporate tax rates in the OECD are imposed by the US and Japan at 39%. Germany has a 30% rate. The lowest rates are in Iceland (15%) and Ireland (12.5%), which should be more a warning than a model!
FDI, in common with all investment, is driven by prospective rates of return. Some factors, such as geographical location are outside policymakers’ hands. But the quality of road, rail, air and port infrastructure are not. Likewise, the size of the market is outside policymakers’ hands, except over the very long run, but economic growth rates are not. In particular, studies repeatedly show that it is the quality and skills of the workforce that is the main policy-driven factor in attracting FDI.
Ireland, with the lowest corporation tax rate in the OECD, demonstrates this reality. It is an article of faith for the Dublin government and its supporters that the 12.5% rate is the key to attracting FDI. Both the Taoiseach Brian Cowen and the Finance Minister Brian Lenihan have taking to describing it as “our international brand”. In the 1998 Budget (introduced in December 1997) their predecessor as Finance Minister, Charlie McCreevey, introduced the legislation for a new regime of corporation tax that led to the phased introduction of the 12.5% rate of corporation tax from 1 January 2003 – down from 32%.
Figure 1 below shows what actually happened to FDI in Ireland before and after the cut to 12.5% corporation tax. In the period since the corporation tax was slashed there have been many quarters where there was a net outflow of FDI and the annual average total was an inflow of just €2.3bn. Before the rate was cut that annual average inflow was €17.7bn, and there was only one quarter of net outflow in FDI.

Figure 1

clip_image001

If FDI were measured relative to either the level of GDP or as a proportion of total investment, the before and after contrast would be even starker.

Clearly, low corporate tax rates did not leads to higher inflows of FDI, and are not responsible for it. But over a prolonged period the Irish economy has had a much greater share of world FDI inflows than would be suggested by the small size of the domestic economy.

Figure 2 below shows one of the main reasons why that is the case. It shows the percentage of the 20-24 year old population in EU countries who achieved at least an upper second level education. Ireland comes out top.

Figure 2

11 01 23 Figure 2

This also helps to explains why FDI investors don’t relish tax cuts. They aren’t fools. They know that low-tax economies do not have the resources to pay for investment in infrastructure, transport links and above all education- the factors that actually attract FDI. Low corporate taxes therefore do not attract, even deter FDI, as the London survey and the Irish experience demonstrate.

But George Osborne is a long-time fan of his fellow Thatcherites in Ireland. In fact the current Dublin government has far more fans in Downing Street than in Ireland, with its opinion poll rating dropping to 14% even before the latest resignations of nearly half the Cabinet. Determined to emulate the effects of Ireland’s Thatcherite economic policymaking, the Tory-led government has set out a course to lower corporate taxes. This will not attract FDI, but it does have the effect of allowing established companies to retain a greater proportion of their profits- and lowering wages and increasing capital’s ability to generate profits remains the essence of government policy. Reality shows there will be no increase in FDI to Britain due to lower corporate taxes.

John Rosshttps://www.blogger.com/profile/08908982031768337864noreply@blogger.com0

Inflation Causes Slump In Living Standards

.269ZInflation Causes Slump In Living Standards

By Michael Burke

The level of consumer price inflation (CPI) accelerated to 3.7% in December from a year ago. Retail Price Inflation (RPI), which also includes housing costs and other items, is rising at the even faster pace of 4.8% year-on-year.

The current pace of inflation compared to income increases is disastrous for workers and the poor. Average weekly earnings are growing at a much more modest pace of 2.1% year-on-year. This earnings growth is set to subside further in 2011 under the impact of public sector pay freezes and local government pay reductions. In addition, growth in private sector pay is likely to slow further under the impact of rising unemployment and as companies look to rebuild profit margins.

Mainstream economists talk of a ‘demonstration effect’ whereby it is hoped that public sector pay cuts will drive down private sector pay levels. It is this effect that the government is clearly hoping for. There is too the insufficiently understood change to the calculation of most benefits away from RPI towards the CPI, which would currently leave benefits falling 1.7% in real terms, even before any actual cuts take effect.

Taken together, flat wage growth and sharp rises in the cost of living amount to a significant reduction in the real living standards of literally millions of people – the overwhelming majority of society. Put another way, the Tory-led Coalition’s cuts this year of £41bn are equivalent to a reduction in national income of 2.7%. But the gap between prices on the one hand and pay and benefits on the other is likely to be even greater.

The January data will record the effects of the VAT hike and well as increases in fares from the mainly privatised public transport system. A series of formerly public utilities such as gas, water and electricity companies have been allowed to increase their tarriffs way above the rate of inflation, while train companies are much better treated than benefit claimants- being allowed to increase fares by between 1% an 3% above the RPI, not the lower CPI .

This is highlighted in the most recent inflation data, where the single biggest rise in prices over the last 12 months is transport, up 6.5%, followed by food and drink at 6.1% and alcohol and tobacco at 5.8%. In addition, the government’s own changes to indirect taxation have pushed prices considerably higher.

This is shown in Figure 1 which, alongside the RPI at 4.8% also shows the official CPIY measure of inflation which is currently at 2%. CPIY is the Office of National Statistics’ measure of inflation excluding changes in indirect taxation such as VAT. The gap between two is a measure of the government’s role in raising the price level.

Figure 1

11 01 21 CPI-RPI

This is not to say that price rises are solely the responsibility of government policy. The UN’s Food and Agriculture Organisation says international food prices are at an all-time high having risen 30% in the last 6 months, and other commodities prices have also soared. Many of these price rises have yet to impact on the later stages of the production chain. An example is cotton, the price of which has more than doubled in the last 12 months, and will begin to impact on clothes’ prices only later this year.

But the inflation effects of indirect taxes mean that the government has room to soften the impact of the prices rises by reversing its own increase in indirect taxes. Cutting the VAT rate would reduce prices and increase disposable incomes for all, especially the poor. It could easily be paid for by reversing the tax cuts made in the June 2010 Budget- cuts to the corporate tax rate, small business profits’ rate, employers’ National Insurance and the freeze on the upper earnings limit on National Insurance for the highly paid. All these measures and more – to benefit the owners of capital and the highly paid – were a tax giveaway approximately equal to the VAT hike, which hit the poor hardest.

Those cuts represent a government policy that is not concerned with deficit-reduction but with a transfer of incomes for the poor to the rich. In addition, the campaign for higher Bank of England interest rates is well under way and supported by the Tory-led Coalition, as SEB has previously pointed out. Financial markets are now pricing in three interest rate hikes this year of 0.25% each, which will prove disastrous for mortgage-holders and many others.

The immediate effect of the strong Sterling campaign has been to increase the value of the pound. Versus the US Dollar, the pound has risen from 1.53 at year-end close to 1.60 in a matter of weeks. British-based banks are awash with cash as private sector surpluses have soared under the impact of growing profits and the financial assets of the rich. They have no intention of investing this productively in the British economy, and instead seek to buy overseas financial assets. A knock-down price can be achieved if the pound is much higher.

Yet even before rate rises the economy will struggle to maintain its modest momentum in 2011, as that was generated by the rise in government spending from Labour’s policies. This government’s hopes are pinned on rising exports but its support for higher rates and a stronger currency will hit the brakes on any export drive.

The Great Depression was characterised by the polices of high interest rates, overvalued currencies in key countries, and the drive towards balanced budgets- all aimed at pushing down wages and designed in this country to meet the specific needs of finance capital. Thankfully this time, strong growth in other areas of the world economy, led by China, India and Brazil will serve to prevent a repeat of that on a global scale this time. But no thanks to this government, which is determined to replay the crises of the past.

Widening Trade Gap Highlights Pernicious Role of the Banks

.362ZWidening Trade Gap Highlights Pernicious Role of the Banks

By Michael Burke

The UK trade gap widened in November to £4.1bn. The trade gap is clearly on a widening trend. The latest deficit compares to a deficit of £2.3bn in November 2009. Taking the latest 3 months data together to smooth the volatility of monthly data, the trade gap was £12.2bn, compared to £7.8bn for the same period in 2009. The total trade deficit in goods and services for 2009 was £29.7bn. But the deficit in the first 11 months of this year is £41.3bn, and may threaten the record annual deficit of £43bn at the height of the boom in 2007.

The chart below shows the monthly trade deficit from 2007.

Figure 1

11 01 13 Trade Chart 1

Government forecasts for sustained economic recovery are based on export-led growth. Exports are growing, and much more strongly than forecast by the Office of Budget Responsibility (OBR). At the time of the June Budget the OBR forecast a 4.3% rise in exports in 2010. But in the latest 3 months exports are 10.3% higher than a year ago as world trade has recovered. Exports have reached a new peak reflecting the upturn in demand in key export markets and are now 3.2% above the previous high seen in 2008.

However, imports are rising still more strongly. In June the OBR forecast a 5.6% rise in exports in 2010. But in the latest 3 months exports are 13.5% higher than a year ago as demand for imports has significantly outstripped export growth.

As SEB has previously warned, without any rise in investment the British economy would tend to become even more uncompetitive, and any new upturn in demand would lead to a widening of the deficit. Imports in any economy are either directly consumed or used as inputs for production. The deficit in finished manufactured goods – a key component of directly consumed imports – was £15.1bn in November, a large multiple of the total deficit. The deficit in this category is both chronic and acute.

The rational response to this situation would be a sharp increase in investment to improve competitiveness combined with a Sterling depreciation. But unlike other categories of economic activity private investment has barely recovered and now accounts for £40.4bn of the £54.3bn loss in output since the recession, three-quarters of the total.

Yet there is now a growing lobby to raise interest rates in order to increase the value of Sterling. Andrew Sentance, one of the members of the Bank of England’s Monetary Policy Committee has repeatedly voted and campaigned for higher rates and now leads a chorus of City-based economists calling for higher rates , even though unemployment is rising and the economic outlook is far from benign.

This campaign, which has received the support of David Cameron is cloaked in terms of combating inflation, but the VAT hike will contribute to rising prices. Other administered prices rises such as rail, bus tube fare increases and the inflation-plus hike in utility bills have the same effect, and could all be avoided by different policy choices. The campaign’s aim is to increase the value of Sterling, irrespective of the effect on the trade balance and the competitiveness of local production – and it is increasingly embraced by the financial sector and the Tory-led government.

This is because the private sector is running a very large surplus, as shown in the chart below, reproduced from this website.

Figure 2

11 01 13 Trade Figure 2

This surplus is not being invested in productive investment in the British economy. The cash balances are being held in British banks, and they in turn want to invest these in overseas financial assets. But much better to invest those with a strong pound than a weak one- the same funds will buy more assets if the currency is overvalued. Typically, a build-up in these corporate surpluses is followed by policies to increase the value of the pound, including higher interest rates.

Once again, the City and the Tory government are moving towards adopting a policy to meet the interests of the banks with no care for the outlook for jobs, investment and the economy as a whole.

Widening Trade Gap Highlights Pernicious Role of the Banks

.463ZyesWidening Trade Gap Highlights Pernicious Role of the Banks

The UK trade gap widened in November to £4.1bn. The trade gap is clearly on a widening trend. The latest deficit compares to a deficit of £2.3bn in November 2009. Taking the latest 3 months data together to smooth the volatility of monthly data, the trade gap was £12.2bn, compared to £7.8bn for the same period in 2009. The total trade deficit in goods and services for 2009 was £29.7bn. But the deficit in the first 11 months of this year is £41.3bn, and may threaten the record annual deficit of £43bn at the height of the boom in 2007.

The chart below shows the monthly trade deficit from 2007.

Figure 1

11 01 13 Trade Chart 1


Government forecasts for sustained economic recovery are based on export-led growth. Exports are growing, and much more strongly than forecast by the Office of Budget Responsibility (OBR). At the time of the June Budget the OBR forecast a 4.3% rise in exports in 2010. But in the latest 3 months exports are 10.3% higher than a year ago as world trade has recovered. Exports have reached a new peak reflecting the upturn in demand in key export markets and are now 3.2% above the previous high seen in 2008.

However, imports are rising more strongly. In June the OBR forecast a 5.6% rise in exports in 2010. But in the latest 3 months exports are 13.5% higher than a year ago as demand for imports has significantly outstripped export growth.

As SEB has previously warned, without any rise in investment the British economy would become even more uncompetitive, and any new upturn in demand would lead to a widening of the deficit. Imports in any economy are either directly consumed or used as inputs for production. The deficit in finished manufactured goods – a key component imports directly consumed imports – was £15.1bn in November, a large multiple of the total deficit. The deficit in this category is both chronic and acute.

The rational response to this situation would be a sharp increase in investment to improve competitiveness combined with a Sterling depreciation. But unlike other categories of economic activity private investment has barely recovered and now accounts for £40.4bn of the £54.3bn loss in output since the recession, three-quarters of the total.

Yet there is now a growing lobby to raise interest rates in order to increase the value of Sterling. Andrew Sentance, one of the members of the Bank of England’s Monetary Policy Committee has repeatedly voted and campaigned for higher rates and now leads a chorus of City-based economists calling for higher rates , even though unemployment is rising and the economic outlook is far from benign.

This campaign, which has received the support of David Cameron is cloaked in terms of combating inflation, but the VAT hike will contribute to rising prices. Other administered prices rises such as rail, bus tube fare increases and the inflation-plus hike in utility bills have the same effect, and could all be avoided by different policy choices. The campaign’s aim is to increase the value of Sterling, irrespective of the effect on the trade balance and the competitiveness of local production – and it is increasingly embraced by the financial sector and the Tory-led government.

This is because the private sector is running a very large surplus, as shown in the chart below, reproduced from this website.

Figure 2

11 01 13 Trade Figure 2

This surplus is not being invested in productive investment in the British economy. The cash balances are being held in British banks, and they in turn want to invest these in overseas financial assets. But much better to invest those with a strong pound than a weak one- the same funds will buy more assets if the currency is overvalued. Typically, a build-up in these corporate surpluses is followed by policies to increase the value of the pound, including higher interest rates.

Once again, the City and the Tory government will adopt a policy to meet the interests of the banks with no care for the outlook for jobs, investment and the economy as a whole.

John Rosshttps://www.blogger.com/profile/08908982031768337864noreply@blogger.com0

New deterioration in the US savings rate and its implications

.569ZNew deterioration in the US savings rate and its implications

By John Ross

The revised 3rd quarter 2010 US GDP figures show a downturn in the percentage of domestic savings in US GDP – see Figure 1. This shift is small, from 11.8% to 11.7% of GDP, but the trend is highly significant.

Figure 1

11 01 03 Gross Savings

Figure 1 confirms the continuation of the long term downward trend of US savings, with inevitable oscillations in business cycles, since 1981. Each cyclical savings peak was lower than previous one – 21.4% of GDP in 1981, 19.0% in 1998, and 16.4% in 2006. Each cyclical trough was also lower than the one before – 14.2% in 1992, 13.6% in 2003, 10.2% in 2009.

A small cyclical recovery in US saving took place, from the 10.2% of GDP trough in the 3rd quarter of 2009 until the second quarter of 2010 at 11.8%, and it is this which stalled in the 3rd quarter of 2010.

Even more striking is that the 3rd quarter of 2010 is the 10th consecutive three month period in which US net domestic savings, i.e. gross domestic savings minus capital consumption, has been negative – as shown in Figure 2. The last time US net savings were negative was during the Great Depression in 1931-34 – see Figure 3.

Figure 2

11 01 13 Net Savings Quarterly

Figure 3

11 01 03 Net Savings Annual

To put it in deliberately provocative, but accurate, language this means that the world’s number 1 capitalist economy has for the last 10 quarters not produced net capital – US capital creation is less than US capital consumption.

The implications of this new drop in the US savings rate, particular if maintained in coming quarters, are numerous. Two interlinked ones, with major implications for US economic performance, immediately stand out.

First, the core of the US Great Recession is a severe fall in fixed investment. Rapid US growth cannot take place without a sharp recovery in fixed investment – which in turn must be financed by savings. If US domestic savings remain depressed, then either US fixed investment will remain low, which implies a slow US upturn, or the US must finance a new higher level of investment from abroad – i.e. there must be a new widening of the US balance of payments deficit.

Second, one of the major theories of the international financial crisis, outlined most influentially by Martin Wolf, chief economics commentator of the Financial Times, was that it would lead to an overcoming of “global imbalances”, that is the balance of payments deficit of the US and the surplus of China and other states, through an increase in US saving.

As the US balance of payments deficit, by accounting identity, is equal to the US shortfall of domestic savings compared to domestic investment, the US balance of payments deficit could decrease through either, or both, an increase in savings or a decline in investment. But, as shown above, US savings have stalled, and partially reversed, as a percentage of GDP at a historically low level. The improvement in the US balance of payments since the beginning of the international financial crisis is primarily due to a fall in fixed investment, not to a rise in savings. An analysis that international financial imbalances would be corrected via a rise in US savings has not been been factually confirmed.

These two issues are evidently interrelated. A major rise in US savings, which would permit an increase in US fixed investment simultaneously with a narrowing of the US balance of payments deficit, would provide the basis for relatively rapid US economic growth. The current factual trend, that of a continuing low level of US savings, does not permit rapid US growth except in conditions of worsening of the US balance of payments deficit.

The current trend of US savings therefore continues to point to relatively slow US growth unless the US is prepared to permit a significant deterioration of its balance of payments position – i.e. a new, and in the long term, unsustainable worsening of global imbalances. Short term fluctuations in US growth must therefore be judged against this strategic background.

* * *

This article originally appeared on the blog Key Trends in Globalisation.

John Rosshttps://www.blogger.com/profile/08908982031768337864noreply@blogger.com0