US productivity declines
By Michael Burke
US productivity is set to decline for the first time in three decades, according to forecasts from the influential business research organisation the Conference Board. The level of productivity, which is the amount produced per hour of labour, is decisive for living standards. It is extremely difficult to increase the living standards of the mass of the population without increasing productivity, and impossible to do so on a sustained basis. The Conference Board is forecasting US productivity will decline in 2016.
The Financial Times quotes Bart van Ark, the Conference Board’s chief economist saying, “Last year it looked like we were entering into a productivity crisis: now we are right in it”. Fig.1 is the Conference Board chart reproduced from the FT. Rising productivity has been a feature of the US economy since the crisis of the early 1980s.
But the chart also shows US productivity growth has been exceptionally weak in the recovery phase since the 2008 crisis. This weakness or outright falls in productivity is a generalised feature of the advanced industrialised economies since the crisis.
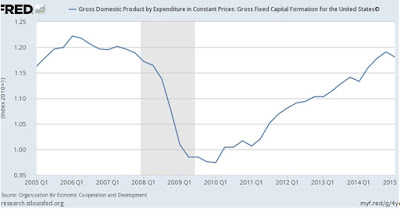
The cause is easily identified. Weak productivity growth is associated with weak investment growth. Outright falls in productivity have followed declines in investment. This is the pattern evident in the US economy. Fig.2 below shows Federal Reserve Board of St Louis data on the level of real investment (Gross Fixed Capital Formation) in the US economy, which is falling.
Two further points are worth noting. First, the level of investment in the US economy never recovered its pre-recession peak and is now turning lower. The economic outlook is deteriorating as a result, not improving as the policy makers of the Federal Reserve Board seem to believe.
Secondly, the chart clearly demonstrates that this was an investment-led downturn in the US economy. As the US led the whole world into crisis, therefore it is reasonable to state that the Great Recession was caused by the US investment decline. In the chart above the shaded area represents the period of the recession itself. Evidently investment declined long before the recession began. In fact, it was two years later that recession began, as investment peaked in the 1st quarter of 2006. As the financial crisis of 2007-2008 also followed the investment decline, the millions of words written in support of the idea that it was the financial crisis which caused the recession are factually wrong. It was the fall in investment which caused both the financial crisis and the recession.
Turning to the UK economy, a cottage industry has grown up attempting to obscure the fundamental forces driving the decline in productivity here. SEB has shown that it is the decline in investment, leading to a decline in the net capital stock which has caused the crisis of productivity here, and that all other explanations are spurious. In the words of the FT report, the UK may simply be the ‘canary in the coalmine’, its productivity decline a harbinger of what may happen to the Western economies generally.


Recent Comments