.482ZThe general significance of China’s discussion on the economy’s ‘supply side’By John Ross
A major discussion is taking place in China on the issue of its economy’s ‘supply side’. Naturally there are aspects of this which relate to specifically Chinese issues. Discussion in China also differs fundamentally from that in the West in that it takes place simultaneously in both ‘Western’ and ‘Marxist’ economic terms. Nevertheless the overall framework of this discussion equally relates to the key issues of economic policy in Western countries.
The article below, which originally appeared in Chinese at Guancha.cn, therefore is simultaneously a contribution to discussion on China’s growth rate targets, and forthcoming 2016-2020 13th Five Year Plan, as well as overall issues of economic growth. It thereby deals not only with specifically Chinese issues but with ‘growth accounting’ as developed in Western economics, the real positions of Keynes as opposed to the confusions of what is generally referred to as ‘Keynesianism’ and the most powerful factors in economic developed. While its specific focus is China this makes clear why the current discussion in China is crucially related to overall questions of economic analysis and theory applying in other countries.
* * *
Economic laws are objective – China is no more capable of breaking them than any other country. Consequently, policies which do not correspond to these laws and the forces they analyse simply will not succeed. This is the context for discussion of China achieving ‘at least 6.5%’ growth which is necessary to make the transition to a ‘moderately prosperous society’ by 2020. It particularly applies to some recent discussion which took place in China’s media on ‘supply side economics’.
At one level, for reasons analysed below, this focus on the supply side is a positive break with the confused ideas of so-called ‘Keynesian’ economics imported into China from Western economic textbooks – although in fairness it will be seen that such views are not actually those of Keynes. But unfortunately some of this new discussion entirely fails to accurately understand the very different strength of different factors on the economy’s ‘supply side’ – erroneously proposing policies relying on very weak supply side forces which would therefore make it more difficult to achieve ‘at least 6.5%’ growth. This article’s aim is therefore to simultaneously show why concentration on the economy’s supply side is correct, to analyse accurately the most powerful forces on the supply side using up to date official statistical methods, and examine the conclusions which flow from the relative strength of different factors on the economy’s supply side.
Marxist analysis
Demonstration of why concentration primarily on the economy’s supply is correct can be made in either Marxist or ‘Western’ economic terms. The Marxist one is more succinct, and will therefore be dealt with first, but it will be demonstrated that analysis in either economic framework leads to the same conclusion.
Marx was unequivocal that production, the economy’s ‘supply side’, was dominant: ‘The result at which we arrive is, not that production, distribution, exchange and consumption are identical, but that they are all elements of a totality, differences within a unity. Production is the dominant moment, both with regard to itself in the contradictory determination of production and with regard to the other moments. The process always starts afresh with production… exchange and consumption cannot be the dominant moments… A definite [mode of] production thus determines a definite [mode of] consumption, distribution, exchange.‘
Marx consequently states that other elements of the economy – demand, consumption, exchange etc. – have some influence but that production, the supply side, is the most powerful economic factor. Analysis shows why this is clear. Consumption, for example, can only be undertaken either of one’s own production or with an income to purchase products, and that income necessarily comes, directly (wages, profits) or indirectly (welfare benefits, pensions, support from another family member etc.), from participation in production.
Furthermore, Marx’s analysis does not deny the interaction of supply and demand, which is the focus of ‘Western’ economics, but simply asks a different question: if supply and demand balance, that is there is ‘equilibrium’, what happens, what is the economy’s dynamic and how does it develop?
Marx, in summary, was a thoroughly ‘supply side’ economist.
Confusions of Western ‘Keynesianism’
The economic school which focuses on the economy’s ‘demand side’, as opposed to supply side, is generally referred to as ‘Keynesianism’. The argument associated with this is that if economic difficulties exist this is due to lack of demand, which should therefore be increased – frequently by running a budget deficit and/or monetary easing. This increase in demand, it is argued, will lead to production increases.
This argument is evidently false. In a market economy production is not undertaken simply because something is ‘demanded’, it is only undertaken for profit. If an increase in demand leads to no increase, or even a decline, in profit then it will not result in an increase in production – indeed it can lead to the reverse.
There are numerous conditions in which increasing demand will not lead to a profits increase. One is where the economy has no spare capacity and therefore production cannot be expanded on the basis of existing resources. In this situation increasing demand, with no ability to increase supply, merely leads to inflation and not a production increase.
But an increase in demand can lead to a fall in profitability even where spare capacity exists. For example, if increased demand strengthens the bargaining position of labour, thereby increasing the wages share in the economy, the profits share in the economy must necessarily fall and profits may even decline in absolute terms. In those circumstances increasing demand, through its negative effect on profitability, will have a negative effect on production. Some policies to ‘increase demand’ even directly reduce profitability – for example if the increase in demand is achieved by directly increasing wages then the profits share of the economy will fall.
It is therefore simply false that increasing demand necessarily leads to an increase in production – it may even lead to a fall. In practice methods of stimulating demand may lead simultaneously to the combination of inflation and economic stagnation or decline – the notorious ‘stagflation’. Naturally these facts do not mean there are no circumstances in which increasing demand will lead to an increase in production, but whether this occurs or not depends not on increased demand itself but on its effect on profitability – i.e. the division of incomes between wages and profits resulting from production. Profitability, not ‘demand,’ is therefore the key part of the economic process.
It summary, whether analysed in a Marxist or ‘Western’ economic framework, the most powerful element is the supply side of the economy not the demand side. This does not mean demand has zero effect, but it means that the effect of demand is less powerful than that of supply. Consequently, what is often referred to as ‘Keynesianism’ is false – the point that should be added is that such ‘Keynesianism’ is a distortion of the views of Keynes himself as Keynes perfectly well understood that profits were the element determining production in a market economy.
It follows that whether considered in a Marxist or a ‘Western’ economic framework the most powerful key to analysis and economic policy lies on the economy’s ‘supply side.’
Production
Turning to which processes are most powerful, and which are weak, on the economy’s supply side it is a testament to genius that modern econometrics has confirmed on this issue the analysis over 200 years ago by the founder of modern economics Adam Smith. Smith set out immediately and unequivocally in the first sentence of the first chapter of The Wealth of Nations that: ‘The greatest improvement in the productive powers of labour, and the greater part of the skill, dexterity, and judgment with which it is directed, or applied, seem to have been the effect of the division of labour.’ With his customary clarity the other conclusions of Smith’s magnum opus followed logically from this analysis of the decisive role of division of labour.
Smith’s conclusion has necessary consequences which impact on the all aspects of the economy. This increasing division of labour means that as Spengler notes in his study of The Wealth of Nations: ‘in Bohm-Bawerkian terms… production became more roundabout.’ By ‘roundabout production’ is meant that rising division of labour creates an increasingly interconnected web of production, and therefore that economically ‘indirect’ inputs rise relative to ‘direct’ ones.
To illustrate this with a simple example, 100 years ago an accountant merely used a pen, paper and a simple calculating tool which were the product of, in comparative terms, relatively few people. Today an accountant uses a computer, software, and the internet – collectively the product of hundreds of thousands of people. To take a quantified example, a modern car assembly factory may appear a huge productive unit, but only 15% of the value of the car production process takes place in it: 85% of the value of auto production is in components and other intermediate inputs into car production.
Furthermore, even the 85% of the car’s value due to inputs of components does not exhaust this process of division of labour and of ‘indirect’ inputs. These components were themselves improved by the work of tens of thousands of R&D workers and scientists, who were trained by hundreds of thousands of teachers, university lecturers etc. This process of increasing division of labour perfectly demonstrates the process analysed by Smith.
At this point Marx enters the picture. Marx summarised the numerous different processes of division of labour described by Smith in a single fundamental concept ‘socialised labour’. Marx drew out the conclusions which followed from the fundamental processes analysed by Smith. But for present purposes it is not necessary to deal with these further conclusions or even to distinguish between the terms ‘division of labour’ used by Adam Smith or ‘socialised labour’ used by Marx – they both described the same process. It is merely crucial to note that modern economic statistics has thoroughly vindicated in quantitative terms these conclusions of Smith/Marx and thereby established what are the most powerful forces on the economy’s supply side.
The most powerful forces on the supply side
If the economy’s ‘supply side’ is examined in quantitative terms the conclusions Smith drew from his analysis were that the most fundamental forces of economic development were, in the descending order of quantitative importance established by modern econometrics:
(i) The most fundamental force of economic and productivity growth is increasing division of labour – reflected in the growth of ‘intermediate products’.
(ii) Increasing division of labour requires an increasing scale of production and an increasing scale of market – resulting in globalisation.
(iii) Increasing division of labour, and increasing scale of production, leads to an increasing percentage of the economy being devoted to fixed investment.
(iv) Growing skill of the labour force, i.e. increasing ‘labour quality,’ is economically determined by the resources put into training that labour force.
(v) Technological progress is itself also a product of increasing division of labour via establishment of specialised R&D and other facilities.
As with all proper scientific propositions Smith’s conclusions are empirically testable. It is a remarkable tribute to Smith’s genius, and that of Marx who understood their power and built on them, that modern economic statistics has confirmed all these points. They will, therefore, be analysed, using modern official statistical methods, proceeding from the most powerful forces on the economy’s supply side to the weaker ones.
Domestic division of labour and Intermediate products
The most direct measure of division of labour is growth of ‘intermediate products’ – i.e. production of one economic sector, either goods or services, used as an input into another (e.g. a hard drive is an output of one industry used as an input into a computer, a steering wheel is the output of the car components industry used as an input into the car industry etc.). Modern econometrics is unequivocal in finding that such intermediate products, directly reflecting division of labour, are the most important source of economic growth.
Taking first the most developed economy, the US, Jorgenson, Gollop and Fraumeni found, using the statistical methods now officially adopted by the US, UN and OECD: ‘the contribution of intermediate input is by far the most significant source of growth in output. The contribution of intermediate input alone exceeds the rate of productivity growth for thirty-six of the forty-five industries for which we have a measure of intermediate input… the predominant contributions to output growth are those of intermediate, capital and labour inputs. By far the most important contribution is that of intermediate input.’
The same result as for the US is found for other economies – specifically including China. Regarding rapidly growing Asian economies:
- For South Korea, Hak K. Pyo, Keun-Hee Rhee and Bongchan Ha found regarding material intermediate inputs: ‘The relative magnitude of contribution to output growth is in the order of: material, capital, labour, TFP then energy.’
- For Taiwan Province of China, analysing 26 sectors in 1981-99, Chi-Yuan Liang found regarding intermediate material inputs: ‘Material input is the biggest contributor to output growth in all sectors during 1981-99, except… seven’.
- For mainland China, Ren and Sun found that in the period 1981-2000, subdivided into 1984-88, 1988-94 and 1994-2000: ‘Intermediate input growth is the primary source of output growth in most industries.’
This analysis that growth of intermediate products is the most important factor in overall economic growth therefore fully confirms Smith’s analysis that rise of division of labour is the single most powerful force on the domestic field for economic growth. This process fully operates in China as in the other economies studied.
Division of labour at an international level
So far analysis of data on division of labour at a domestic level has been given. This clearly shows that use of intermediate products is the most powerful factor on the economy’s ‘supply side’. However, division of labour in a modern economy extends not only domestically but internationally – the phenomenon of ‘globalisation’. Quite sufficient evidence exists to leave no doubt that division of labour increases internationally. This drives both modern industrial structure and China’s ability to insert itself in globalised competition. Taking the chief features of this:
- Intermediate products themselves constitute the largest part of international trade – accounting for approximately 40% of all goods trade.
- Trade in intermediate products is concentrated in advanced economies and East Asia – economies which have intermediate products as the most rapidly growing part of national production.
- International trade has expanded rapidly as a percentage of world GDP.
That international trade is the expression of division of labour of course explains the well-established finding that international economic ‘openness’ is positively correlated with economy growth.
Factors of production
Turning from intermediate products to factors studied in the classic framework of Solow ‘growth accounting’ the trends for both advanced and developing economies analysed by the latest of statistical method of the US, OECD and UN statistical agencies for the period 1992-2014 are shown in Figure 1. This data is for 103 advanced and developing economies together accounting for 94% of world GDP – i.e. the data is comprehensive. The results are clear:
(i) In both advanced and developing economies Total Factor Productivity (TFP) is only a small source of growth. TFP in advanced economies on average accounts for 0.5% annual GDP growth and in developing economies 0.6%.
(ii) Labour inputs account on average for 0.8% annual GDP growth in advanced economies and 1.2% in developing ones.
(iii) Capital inputs are the single most important of the ‘Solow’ factors of growth accounting on average for 1.6% GDP growth a year in advanced economies and 2.5% in developing economies.
The net result of these inputs is that annual average growth in developing economies in the period 1992-2014 was 4.3% compared to 2.9% in advanced economies. This annual growth lead of 1.4% by developing economies allows them to catch up with advanced economies. But only 0.1% of the ‘catch up’ in GDP growth is due to higher TFP growth compared to 0.4% for higher increases in labour inputs and 0.9% due to higher capital inputs. Therefore, 64% of the ‘catch up’ of developing economies is due to a higher rate of capital accumulation, 29% due to higher inputs of labour, and only 7% due to higher TFP growth.
Figure 1

Similarities and differences in the growth pattern of advanced and developing economies
To show more clearly the similarities and differences in the growth pattern of advanced and developing economies Figure 2 and Figure 3 show the percentage contributions to growth in advanced and developing economies. To highlight the most significant difference more clearly labour inputs have been divided into their two sources of increase in labour quantity (i.e. total hours worked by the labour force) and increase in labour quality (improvements in education and training). The charts show that the most powerful sources of growth in the two types of the economy are the same with one significant difference regarding the growth of labour inputs.
(i) The role played by Total Factor Productivity is small in both advanced and developing economies, accounting for only 10% of growth in both. TFP is substantially determined by indirect inputs into production – technology advance due to R&D etc.
(ii) The percentage of growth accounted for by labour inputs in both types of economy is not radically dissimilar – 26% in advanced economies, 30% in developing economies. However, the composition of the increase in labour inputs is substantially different in the two types of economy. In developing economies 27% of GDP growth is due to increase in total hours worked by the labour force and only 3% by increases in labour quality, whereas in advanced economies only 15% of growth is accounted for by increases in hours worked and 11% by improvements in labour quality.
Therefore, as an economy becomes more advanced the role played by increases in total hours worked falls while the role played by improvements in education and training moves from being small to being a significant growth factor. Put in simple terms the role played by education, training etc. becomes significantly more important as the economy become more developed – a classic example of roundabout/indirect production as the increase in labour quality is due to the work of teachers, training schemes etc.
(iii) Increase in capital investment is by far the most important of the ‘Solow factors’ in economic growth in both developing and advanced economies – accounting for 60% of growth in developing economies and 63% of growth in developed economies. It may be noted that the role of capital investment in an advanced economy is even greater than in a developing one. Capital investment is a pure ‘indirect’ input into production – both intermediate products and fixed investment are capital in accounting terms but intermediate products are used in a single production cycle while fixed investment is used up (depreciated) over numerous production cycles.
Figure 2

Figure 3

Sources of growth on the ‘supply side’
The importance of different factors on the supply side of the economy may therefore be summarised:
i. The most powerful factor in economic growth is the development of intermediate products – a direct reflection of increasing domestic and international division of labour.
ii. The second most powerful factor of production is capital investment – accounting for approximately 60% of the growth which is due to ’Solow factors’ of production.
iii. Labour inputs account for approximately 30% of GDP growth due to ‘Solow factors’ of production – but with increases in labour quality rising significantly compared to labour quantity as an economy becomes more developed
iv. TFP plays only a relatively small role in economic growth – accounting for about 10% of growth due to ‘Solow factors’ of production.
Myth of individual entrepreneurship
The above data immediately shows why the views of some of those in China claiming to stand for ‘supply side’ economics are wrong. For example, Liu Shenjun claims that the key factor in economic growth is individual ‘entrepreneurship.’ The data on economic growth clearly shows this is entirely false.
The impact of individual ‘entrepreneurship’ would be part of the growth that is not created by quantitative increases in intermediate products, capital or labour i.e. it would be measured as part of TFP growth. But as already seen TFP increase even taken as a whole is a small part of economic growth – in both advanced and developing economies total TFP increase accounts for only 10% of economic growth. Furthermore, TFP growth is no higher in advanced economies, where individual entrepreneurship is supposedly concentrated, than in developing economies. Consequently, even if the role of ‘individual entrepreneurship’ accounted for the whole of TFP growth in advanced economies, which is a wholly unreasonable assumption given the key role of technology, scale of production, R&D and other factors, it would be only one third as important as growth in labour inputs and only one sixth as important as growth in capital investment.
Therefore, attempting to create economic growth based on TFP increases, let alone ‘individual entrepreneurship,’ is like attempting to drive forward a machine using only a tiny gear wheel, while not attempting to shift it using the far larger gear wheel of capital investment or even labour inputs. For simple quantitative reasons such a strategy evidently cannot succeed.
Conclusions
To summarise again the sources of growth on the supply side of the economy are, in descending order of importance, intermediate products, capital investment, labour inputs, and TFP (with the contribution of individual entrepreneurship being even less than that of TFP). This has evident implications for what constitutes a ‘supply side strategy’ – which includes but is not confined to the following points.
1. Regarding the most powerful source of economic growth, intermediate products, domestically the maximum conditions have to be created for China to use the advantages of division of labour. The increasing size of China’s economy, by expanding the size of its domestic market, facilitates development of such efficient division of labour. Nevertheless, efficient functioning of the domestic national market, and domestic division of labour, requires large scale material underpinnings. China’s transport system for example, a crucial factor permitting division of labour, remains highly underdeveloped compared with the US. Length of road per capita in China is only 16% of that in the US, and length of railway only 7%. Compared to the US China’s logistics system is therefore extremely underdeveloped. Similarly regarding communications, again indispensable for efficient division of labour, the percentage of China’s population on the internet is only slightly over half that of the US. Programmes such as ‘internet plus vital’ are therefore vital not only for systematic upgrading of production but for permitting efficient functioning of domestic division of labour.
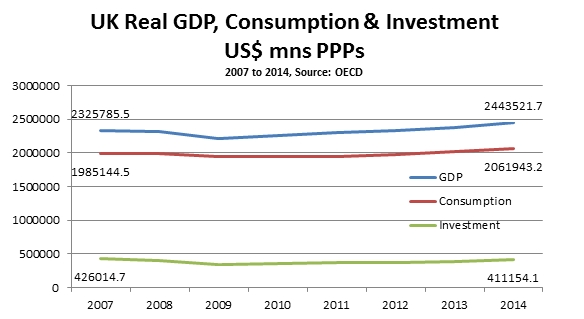
2. In terms of international division of labour. the effect of the international financial crisis has sharply reduced the share of trade in China’s economy. The percentage of exports of goods and services in China’s GDP fell from 35% in 2007 to 23% in 2014 and the share of imports from 27% to 19%. Trade data shows this decline has continued in 2015 – in summary China is making less use of international division of labour than previously. Purely on the basis of exploiting the growth advantages of division of labour the most powerful way to stimulate exports would be via RMB devaluation while simultaneously more rapid GDP growth would be the most effective way to stimulate imports. However, in setting the exchange rate other considerations than trade stimulation also have to be taken into account and therefore these have to be balanced with trade considerations.
3. As fixed investment is the most important ‘Solow factor’ in economic growth it is necessary for China to sustain a high fixed investment level. However, investment requires equivalent savings. The decline in China’s savings as a percentage of the economy since 2009, i.e. a decline in the percentage of the economy developed to supply of capital, has led to China’s interest rates rising significantly above those in the US, with negative economic consequences. Reviving China’s saving rate, above all by increasing corporate profitability, is therefore an economic priority if a high level of fixed investment is to be maintained.
4. The growing importance of labour quality, as opposed to labour quantity, as an economy becomes more developed underlines the importance of China continuing to increase the percentage of the economy devoted to education and training.
5. R&D is a crucial example of an ‘indirect’ input into production and is crucial for innovation. Continuing to increase the percentage of China’s GDP devoted to R&D is therefore important on the supply side.
6. Measures to assist individual entrepreneurship are useful but for the quantitative reasons already cited cannot play a determining or large role in economic growth.
Given the clear facts on economic growth in both advanced and developing economies economists who claim that what is required on the ‘supply side’ is ‘”small government, big market”, free competition and firm believe in entrepreneurship’ are both entirely wrong as regards the power of different factors on the economy’s supply side and are merely ‘neo-liberals’ hiding under another name – ‘neo-liberalism’ itself being so discredited that few people now dare to openly advocate it.
The correct starting point for framework for analysing the supply side of the economy flows from the analysis recently set out by Xi Jinping as reported: ‘As the fundamental standpoint of Marxist political economy, the theory of putting people at the center should be upheld while deploying work, setting down policies and promoting economic development.’
Putting people at the centre applies to the productive process as in the other fields of the economy. The most powerful forces on the economy’s supply side is ‘socialised labour’, to use Marx’s terminology, or ‘division of labour’ to used Adam Smith’s – which terminology is used is not critical for present purposes as both describe the same process. The most powerful forces on the economy’s supply side as it becomes more developed – intermediate products, globalisation, rising fixed investment, increased labour quality – are themselves expressions of division of labour/socialised labour.
The recent turn to emphasis on the economy’s supply side, as opposed to the confused ideas of ‘Keynesianism’ imported into some circles in China by Western textbooks, is therefore welcome. But it would be truly absurd if one Western textbook confusion were now replaced by another which constitutes merely a form of ‘neo-liberalism’ in other disguise. This would be particularly ridiculous when China’s Marxist economics and contemporary Western economic statistics come to exactly the same conclusion on what are the most powerful forces on the economy’s supply side.John Rosshttps://www.blogger.com/profile/08908982031768337864noreply@blogger.com1


Recent Comments