
.176ZAlternative Autumn Statements: Continued Tory Failure Versus Corbynomics
Having spectacularly failed in his stated goal of eliminating the deficit in the last parliament, George Osborne is repeating his experiment in this one. Both the June 2010 and 2015 Budgets proposed ‘fiscal tightening’ of £37 billion. In the first of these Budgets the main method was cuts in public spending. In the second it is the sole method.
In the latest Autumn Statement this now falls to £36 billion and takes place more slowly after the U-turn on implementing cuts to working tax credits. These are now effectively scheduled to take place more slowly under the guise of ‘reform’ to the Universal Credit system.
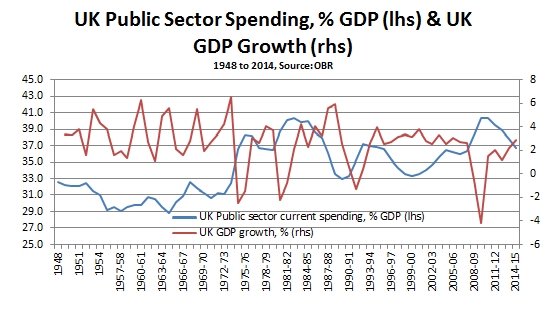
The effect of renewed austerity is reasonably predictable. The economy has not grown significantly in the last 5 years. As nominal GDP is approximately 16% higher, so the impact of almost exactly the same nominal cuts will be very similar as from 2010 onwards. Likewise, the starting-point for growth is about the same. In the 3rd quarter of 2010, ahead of that Comprehensive Spending Review the GDP growth rate was 2% and on an upward trajectory from the depth of the recession. In the recent preliminary estimate the growth rate in the 3rd quarter of this year was 2.3% and slowing from 3% following the election boost to the economy, as shown in Fig.1.

Policy Options
In fact, it is the content of government current spending which matters far more than its proportion of GDP. Government spending on education, on health, on childcare and other public goods improves the living standards of the population. An increase in social security payments because of rising joblessness or in-work poverty is necessary but can only partially alleviate falling living standards. There is a world of a difference between current spending that falls because well-paid jobs are being created on a large scale, or falls because the NHS is being cut.
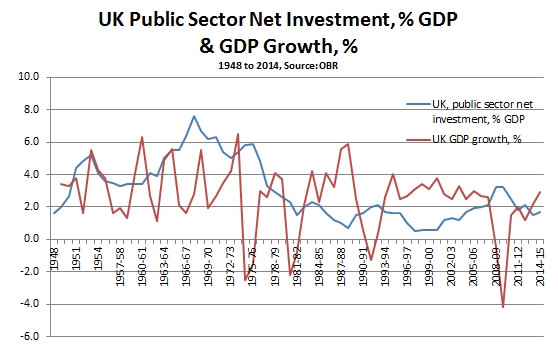
The medium-term history of the British economy is stable or rising Government current spending as a proportion of GDP, as shown in Fig.2. It is the composition of this spending which has adversely altered. To take just one well-known example, the public sector has almost given up on house-building but incurs £25 billion annually in housing benefit payments, which are paid to landlords – enough to build over 160,000 affordable homes. This reflects both slower growth and rising inequality.

SEB has previously shown that the private sector followed suit in both cases; increasing or decreasing its own investment rate in response to the rise or fall in public sector investment, with a time lag of 6 months. This is a practical demonstration of what is meant by the phrase state-led investment.
These very different trends in the components of government spending reveal the truth behind the Tory rhetoric of ‘deficit-reduction’, ‘living within our means’ and ‘shrinking the state’. Successive governments, of which this is just the most brutal, have not reduced total current spending as a proportion of GDP and have been content to borrow to fund that spending. They have simply changed its content. Landlords and others, after all, are part of the class of capitalists in whose interests economic policy is formulated.
State spending has not shrunk, but state investment has been savaged. The trend is towards minimal or even zero net public investment. This is because investment creates the means of production. If the public sector invests it owns those means of production. They are not owned by business. To the extent that the state owns the means of production it can direct the level of investment in the economy and its overall trajectory. Private business cannot directly make profits from the means of production it does not own, which explains the contrary drive towards privatisation.
Corbyn & McDonnell are right
The response of the Labour leadership is therefore correct. Prior to Comprehensive Spending Review Shadow Chancellor John McDonnell said his approach could be summed up as “investment, investment, investment”. Firm opposition from the Labour leadership to cuts in working tax credits produced Osborne’s U-turn.
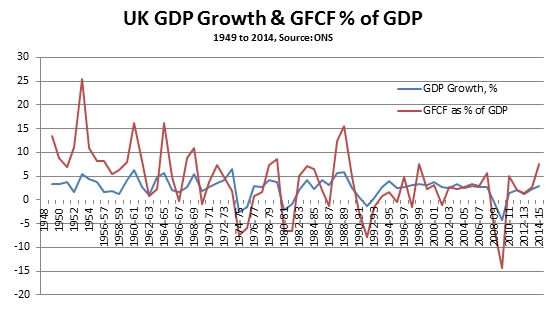
Investment (Gross Fixed Capital Formation) has been in a long-term downtrend in the British economy. It was also specifically responsible for both the recession and for the weakness of the recovery. The long-term investment downtrend is shown in Fig. 3 below, which shows both total investment and Government investment as a proportion of GDP.

As the chart also shows, the decline in investment in the current cycle began in 2006, long before either the financial crisis or the recession itself- and was led by a private sector decline. The rate of investment is decisive for the trajectory of the economy as a whole.
The policy focus must not be on investment in general, with exhortations or bribes to the private sector to invest. This has been tried by Osborne and failed. It must be direct investment by the public sector itself, in housing, transport, infrastructure, renewable energy and education. The private sector will follow.
This is why the proposed Public Investment Bank is so important, supported by measures such as PQE and changes to the tax system to penalise unearnt income such as shareholder dividends while promoting investment. The Public Investment Bank can mop up the idle cash of the large corporations, and direct it for productive investment. Crucially, it also allows the public sector to reap the benefits of that investment, so that it acquires a larger and enduring weight in the economy able to sustainably increase investment over the long-term.


Recent Comments