The Tories have no real plan to get out of the current
economic crisis, but they are determined that the working class will foot the
bill. In that way, their hope is that
the end result of this economic slump will be much lower wages across the board
and that profits for the remaining companies will significantly increase as a
result.
The UK has one of the worst per capita death tolls in the
world. With an OBR forecast of a
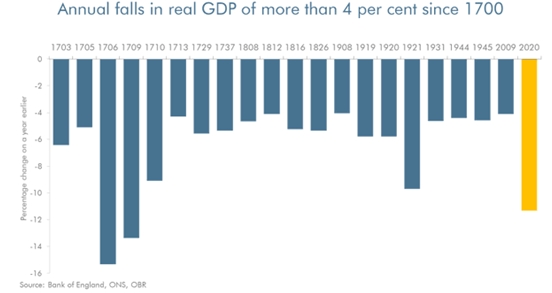
contraction in GDP of 11.3% it also has an economic slump of the same
magnitude. The OBR reckons it is the worst for over 300 years.
Chart 1. OBR: The Worst Slump since the Great Frost of 1709
This slump is treated by ministers and commentators alike as
if it is an act of God, rather than a consequence of government failure. However, its alleged effects fall into a
different ‘something must be done’ category.
In particular, the propaganda campaign on the deficit in government
finances has begun, in a farcical re-run of the drive to austerity from 2009
onwards that led to austerity, the BBC’s chief political correspondent Laura
Kuenssberg plays an especially prominent, pernicious role with bulletins filled
with talk of “we
can’t afford” to support jobs and families during and after the pandemic,
that there is “no money left”, that we’ve “maxed out the
nation’s credit card”, that we’re “loading debt onto our
children”. Even mainstream economists such as Jonathan Portes describe
this all as ‘economically illiterate nonsense’.
As
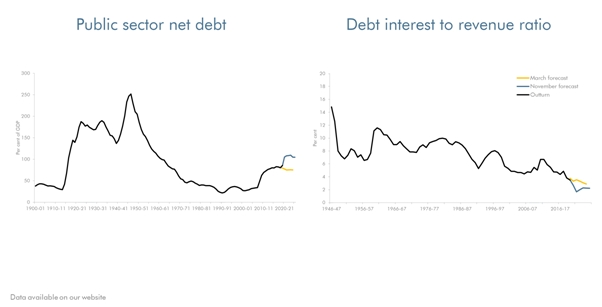
Chart 2 shows, public debt is rising but it is far from unprecedentedly
high. Crucially debt interest as a
proportion of GDP is close to its all-time lows because global interest rates
remain so low. The debt is currently
easily affordable, because interest payments are so low.
Chart
2: OBR: Debt and debt interest payments as a proportion of GDP
The scaremongering about the debt and deficit levels serve
another purpose altogether. This is the attempt to justify the freeze in public
sector wages, which is a cut in real terms (after inflation). This is the one big ‘saving’ announced in the
Spending Review, along with further big cuts in spending on public services in
later years.
Yet it is not a big saving at all. Unusually, the Chancellor did not provide a
specific estimate of the ‘saving’ in his review of Policy Costings. But an approximate estimate (current author’s
calculation) is an annual saving of £3billion to £4billion.
This is a pitifully small amount relative to government
finances in aggregate. The total forecast deficit for this year is £394
billion, so the entire cut to public sector wages falls with the scope of
accounting errors. The Chancellor
boasted that £280 billion had already been spent, largely on supporting
businesses. And it should not be
forgotten that the public sector workers’ wages have already been earmarked as
a contribution towards a £26.4 billion increase in military spending.
As SEB has argued previously the purpose of the
public sector pay freeze (a real terms cut) is not to reduce the deficit. With these magnitudes it would take over 100
years, even assuming there were no indirect negative economic consequences
arising from it. The real purpose of the
public sector pay freeze to attempt to set a ceiling on all pay after the
crisis is over, and thereby lower all wages in real terms.
This was its purpose in the austerity offensive from 2010
onwards. This had the desired effect of
lowering real wages for a period, but the electoral timetable combined with
very low unemployment meant that holding down wages could not be
maintained. The current plan is to solve
that problem of wages creeping higher while there is low or zero productivity
growth, and which prevents the growth of profits. This is the return to mass unemployment.
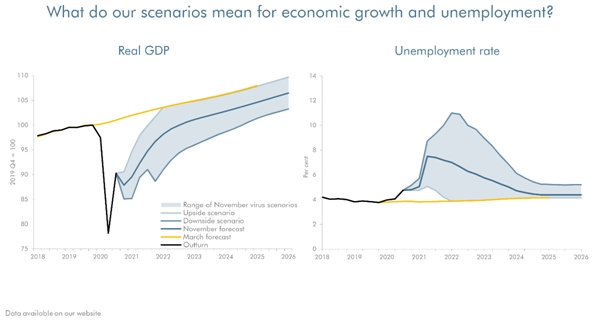
The OBR’s central forecast is that 2.6 million people will
be made unemployed and that the unemployment rate will rise to 7.5%. Its worst-case scenario is that the
unemployment rate rises to 11%, or almost 4 million people. This is getting into Thatcher territory.
Chart 3. OBR: Forecasts for fall in GDP, rise in
unemployment
In this way, this government will hope to combine the
Thatcherite effort to lift profits by deindustrialisation, with the cuts to
real pay under the Tory-led Coalition. Of
course, neither of these strategies worked even in their own terms, as profits
did not rise sufficiently to restore UK competitiveness or spark an investment
boom.
Yet the current Tory strategists will be hoping that by combining
this worst of both worlds, cutting real pay and mass unemployment, they can
achieve something their predecessors could not. They aim to get wages down and keep them
there. We shall see if this toxic mixture has the desired effect. But millions of people will face misery,
increased poverty and unemployment if their plan is put into action.
The experience of this country (both positive and negative)
and many others shows that there should be a compete lockdown to combat the
pandemic. This means all non-essential work stopped, all leisure and other
services halted, schools closed and all possible higher education moved
online. There should also be proper
compensation for workers, who should receive 100% of their pay, not the 80%
currently (or none at all for some freelance and other workers). That
compensation should be for the duration of the furlough itself, at first approximately
8 weeks and until new cases reach levels where they can be suppressed, and then
extended for the necessary period while the gradual back to work process is
completed.
A combined crisis
The public health crisis caused by the Covid-19 pandemic has
led in turn to an economic crisis. There
is no possibility of ‘saving the economy’ while a pandemic is raging. Services account for approximately 70% of the
economy and the demand for many of these is discretionary. You cannot force people to go to pubs,
cinemas or restaurants in a pandemic. On
the experience of this country and many others, the majority of people will
simply refuse to take up their normal leisure and cultural activities. It is not the restrictions that are killing
these businesses and workers’ jobs. It
is the pandemic itself.
Similarly, there is no ‘trade-off’ between combatting the
virus and protecting the economy, as ministers and others frequently
claim. The UK’s own disastrous record on
both demonstrates that. The UK has one
of the worst death tolls per capita of any large country in the world, and the
worst total in Europe despite both waves of the virus hitting this country
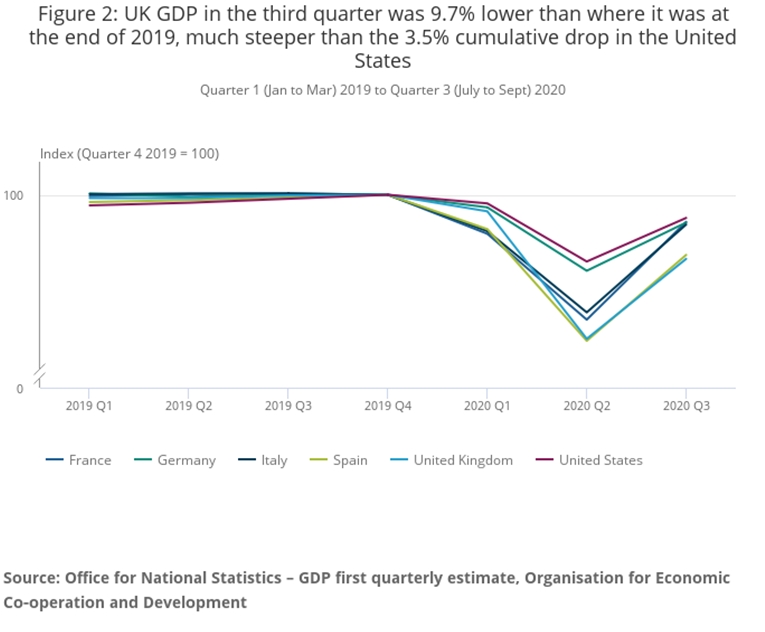
later than continental Europe. It has also the worst economic performance any
major Western economy (see Chart 1 below).
Chart 1. UK GDP, Largest Contraction Among the Major Western
Economies
By contrast, it is clear that all the countries that have
effectively eliminated the virus are also the economies that will grow the
strongest this year, as shown in Table 1 below.
Table 1. IMF Real GDP
Growth Forecasts for 2020
Country/Region
Real GDP Forecast, %
China
+1.9
Viet Nam
+1.6
USA
-4.3
EU
-7.6
UK
-9.8
Source: IMF World Economic Outlook
At the same time there is a public health imperative to
combining full lockdown with full pay for all furloughed workers. Many workers are already in poverty even at
100% of their usual pay. Excluding
pensions, most
benefit claimants are people in work and 56% of those in poverty before the
pandemic were in work. Put simply,
millions of a were already poor when being paid at 100% of their wages. Reducing it to 80% increases the probability
of outright destitution for millions.
The pay cut also compels many to ignore lockdown
restrictions, even when they know they are putting themselves and their loved
ones at risk. 80% of breadline wages is
insupportable. People are then forced to seek additional work, in breach of the
requirement to close all non-essential workplaces. It is morally unjustifiable to cut those wages,
including those on the National Minimum Wage, as this government is doing. It is in the interests of the whole of
society that people are able and do adhere to strict lockdown measures.
‘There is no money
left’
The main objection to 100% pay for all furloughed workers is
cost. But the additional outlay for full
pay is tiny in comparison to other levels of expenditure, including a £300
billion bank loan guarantee scheme and the
initial £110 billion support for businesses (via the Job Retention Scheme,
the bounce back loan scheme, the business rates holiday and other measures).
The estimated cost of the initial furlough scheme which ran
from March
to the beginning of October was £40 billion. Using simple maths, the total cost of a scheme
offering 100% of wages is only marginally more at £50 billion. Of course, the government cap can continue to
apply at £2,500 pay per month.
The National Institute for Economic and Social Research
(NIESR) estimates
that the scheme is self-funding.
This is because over the long-term it helps to preserve jobs and all the
tax revenues that they generate. Furlough payments are like an insurance
policy, helping to ensure the continuation of that future tax revenue stream
dependent on jobs.
But the furlough scheme, and increasing it to 100% of pay,
is also largely self-financing even in the short-term. Over the period of the first half of the
Financial Year (FY), which approximately coincides with the bulk of the initial
furlough scheme from April to the end of September, government revenues
declined by £42.6 billion. As the
biggest contributors to tax revenues are from personal income taxes and
indirect taxes on personal consumption, it is clear that government revenues
are lowered by reduced employment and reduced pay. So, in the first 6 months of this FY, taking
just VAT, income tax and social security together, government revenues fell by
£23 billion compared to the first half of the last FY. The shortfall would be even greater adjusted
for inflation.
The increase to 100% furlough pay is easily affordable.
It would also be an important part of a genuine lockdown,
which could break the back of the virus as has been done elsewhere (and which
was almost done here until lockdown was ended too early in June).
There may be a more valid objection about fairness,
especially for essential workers who would continue at work even during a
properly effective lockdown. But that should
be dealt with in other ways, such as large bonuses and substantial
above-inflation pay rises when the pandemic is finally ended.
The labour movement should argue for 100% of pay in a
complete lockdown. Full lockdown and
full pay now!
Recently the Chancellor Rishi Sunak won widespread plaudits for
altering the terms of his financial support for workers whose jobs are under
threat because of the restrictions introduced in response to the pandemic. The furlough scheme is back, leaving the
workers affected with just 80% of their wages, rather than 67%.
This was simply a tactical retreat. The government has clearly signalled it is
conducting a ferocious attack on living standards but has had to recalibrate
what it can impose right now.
It should be clear that the scale of this attack on the living
standards of the working class and poor, is much more ruthless than the
austerity of 2010 or in some respects even than Thatcher in the 1980s. As a result, it should be equally clear that
success for the government would be a decisive shift in favour of big business
and the rich, at the expense of workers and the poor.
Since class warfare is being waged, anyone who preaches social
peace now is simply making it harder for the working class and its allies to defend
themselves against a major defeat.
Ratcheting
down, not levelling up
The claims that the Boris Johnson government is engaged in ‘levelling
up’ poorer areas of the country belong with the falsehoods that he is
‘implementing Corbyn’s policies’, is ‘spending like a socialist’, has
‘abandoned austerity’. They are all pure
hokum. They are proposed by those wishing to blunt any opposition to the
government, and repeated by those who clearly do not understand what is going
on around them.
All these claims fall apart as soon as the government meets any
resistance, as the excellent campaign for free school meals by Marcus Rashford
and others shows. Donating £12 billion
to SERCO, Deloitte’s and other private sector companies, most of whom are
intimately connected to the Tory Party, while they for long refused £120
million for free school meals is not levelling up, implementing Corbyn’s
policies or socialist spending or any other of the spurious claims.
Austerity is properly understood as a transfer of incomes and
wealth from poor to rich, from labour to capital. So, in the very first
austerity Budget by Osborne and Cameron there were £12 billion in cuts to
social security while business taxes were cut by almost exactly the same
amount. Clearly, even in simple
accounting terms (leaving aside any economic effects) this had nothing to do
with reducing the deficit, as was claimed.
But it did transfer government spending from the poor to the rich.
Austerity has continued in the same vein, with varying intensity ever since. Previously,
Thatcherism used the cloak of monetarism in order to effect exactly the same
type of transfer, largely through an assault on the unions and tax breaks for
the rich.
In the same fashion, the overwhelming bulk of every package
announced in the current crisis is to benefit big business. So, of the initial £330 billion emergency
package that was finally announced after the March Budget, £300 billion was in
the form of loan guarantees to the banks to avoid losses on their business
lending. In contrast, just £1.6 billion is for local
authorities who are under enormous pressure both from reduced revenues and much
higher outlays to meet the mounting effects of the crisis caused by the
pandemic.
The attack
on the working class
The centrepiece of the class warfare being waged by big business
and their government is on wages, hours and employment. Here, the ratchet down effect is the most
wide-ranging in its effects.
This is easy to demonstrate.
Before the crisis began, however low wages were for workers across many sectors,
they did at least receive 100% of those wages.
Under furlough conditions, where work was supposed to be suspended, this
has been reduced to 80%. At the same
time, and completely against the rules, many companies committed fraud by
forcing staff into work for no additional pay. Up to a third of all employees
were asked or forced to come in, according
to one estimate.
In addition, a large number of firms are in the process of making
that reduction permanent. Three high
profile employers, British Gas, British Airways and the BBC have all launched
fire and rehire schemes to reduce wages and conditions. Many others are following suit but are less
well known. As the end of the previous furlough
scheme approached, the government tried to enforce a reduction to 67% of wages
for some topped up by 5% from employers, and no support at all for those caught
in the spurious ‘Tier 2’ restrictions.
The fear over the probable immediate collapse in jobs forced a tactical
retreat.
Now that furlough is back, there has been a return to 80%, at
least for the time being. But even if this is the full extent of the reduction,
it still represents an enormous and dramatic shift from labour to capital. Nothing on this scale was achieved under
austerity.
The intention of the ruling class and the Tory government is as
far as possible to make this reduction permanent.
Mainstream economists have long studied the issue of the
determinants of wages for obvious reasons.
There is a whole literature devoted to what they describe as the problem
of rigidities that lead to ‘sticky’ wages, that is the difficulty in driving
down nominal wages (here is just one example pdf, there
are innumerable others).
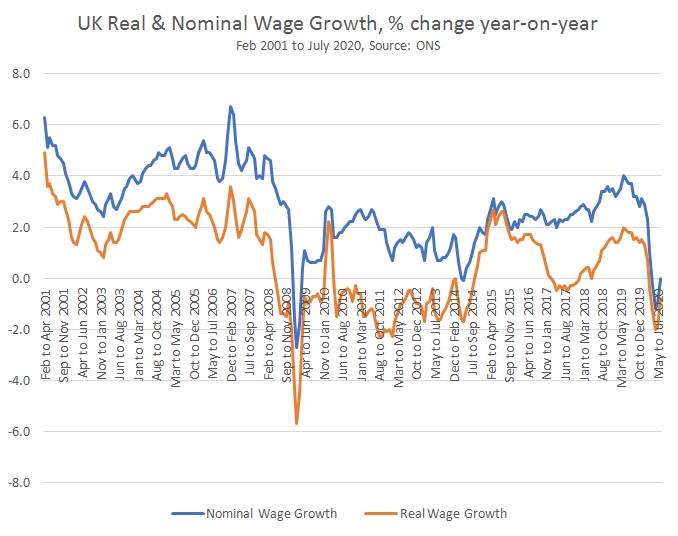
This ‘stickiness’ of wage growth is shown in Chart 1 below. The annual growth in wages in nominal terms
is shown in orange, the growth in wage in real terms (after adjusting for
inflation) is shown in blue. Nominal
wage growth hardly fell at all in the last recession. The brief dip in wages occurred in the first
few months of 2009 and began to recover very slowly in later months. It was only the simultaneous fall in the
value of the pound, which drove up prices in an economic slump, which caused
real wages to fall over a more prolonged period, from mid-2008 to the end of
2009. But even wages in these terms
began to recover in early 2010.
Real wages for public and private sector workers fell after the
June 2010 ‘emergency Budget’ all the way through to October 2014. This was a result of government policy. Only as the Coalition government geared up
for an election the following year by loosening government spending did real
wages start to crawl higher. The
austerity policy was highly successful in cutting real wages, as it was
designed to do.
Chart 1. UK Nominal and Real Wage Growth, % change
If everything else is unaltered, the combination of economic
weakness, rising import prices and rising real wages from 2010 onwards was
bound to damage profits severely. The centrepiece of the austerity policy was
to combat this profits-damaging combination of factors.
The chosen method was a public sector pay freeze. Not only did this have the direct impact of
cutting real wages (as well as cuts to pensions) for approximately 1 in 6 UK
workers (over 5 million of them) in the public sector where union densities are
highest, but it also had a ‘demonstration effect’ (pdf), of
setting a nominal wage freeze or similar in the private sector as well. With
prices still rising because of the effects of the weakness of the currency,
real wages for workers started to fall once more.
However, as appealing as it may be to employers to cut wages if
they can, this does not by itself resolve the issue of profitability especially
if the overall business conditions are characterised by sluggish growth and
rising import prices. The austerity policy of driving down wages was only
successful in raising the level of misery. It was not successful in its overall
aim of raising profits.
Worse, from the perspective of the architects and supporters of
austerity, nominal wage growth continued to rise at a very modest pace after
2014 and continued to rise until the current pandemic began. Real wage growth was more erratic, undercut
by rising inflation once more in 2017.
But even so, no blow had been struck which cut wages sufficiently to
raise profits on an enduring basis.
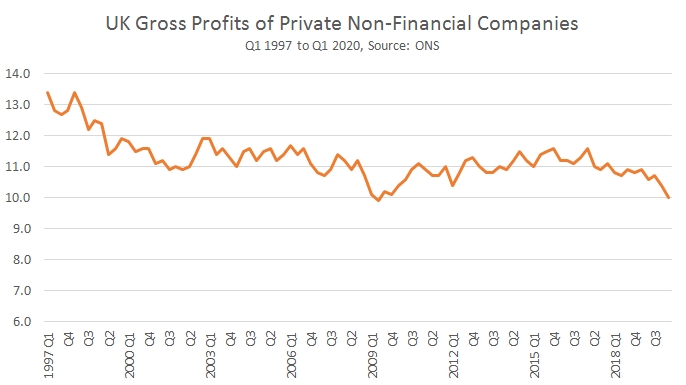
This trend in profits is shown in chart 2 below. Initially, profits fell as they tend to
during a recession. Sales were falling
and as noted above wages remain ‘sticky’.
(The ONS data shown is actually a measure of the rate of return on
capital, not strictly profits, but it is a useful guide to profitability). Subsequently profitability did recover but
only moderately.
Yet profitability continues to remain below 2008 levels. And, as
regular readers of SEB will know, profitability never rose sufficiently
to spark an upturn in private sector investment. From the perspective of the
capitalist class as a whole, there is no incentive to raise investment, which
means adding to the productive capacity of the economy, if the rate of return
on existing investments is depressed below usual levels.
Chart 2.
The
reserve army of labour
In the last recession and under the austerity policy real wages
fell initially by 6% and only recovered over a very prolonged period. Under
Thatcher, real earnings for those in work did not fall at all. Instead, her policy addressed the problem of
low profitability by massive deindustrialisation that created 3 million
unemployed.
The current policy is a combination of these two. Through government policy wages are being
slashed by 20% for very large parts of the workforce, even including those on
the National Minimum Wage. At the same
time there is a sharp rise in the level of unemployment, and some businesses
will fold. The combination of these two factors,
the sharp reduction of wages and the surge in unemployment is government
policy. It is a new development and its
architects will be hoping that one reinforces the other, that much higher
unemployment will be a decisive factor in keeping wages low long after the
public health crisis is over.
This mechanism was first analysed by Marx as the creation of the
‘industrial reserve army’ of labour. Marx says the reserve army of the
unemployed exists in no previous form of society except in capitalism, and is
integral to it.
“The industrial reserve
army, during the periods of stagnation and average prosperity, weighs down the
active labour-army; during the periods of over-production and paroxysm, it
holds its pretensions in check. Relative surplus population is therefore the
pivot upon which the law of demand and supply of labour works. It confines the
field of action of this law within the limits absolutely convenient to the
activity of exploitation and to the domination of capital.” – Karl Marx, Capital, Volume One, Chapter 25
In general, high or sharply rising
unemployment holds the risk that it may produce social unrest and political
discontent. The government of an
advanced industrialised country may choose to engineer a sharp rise in
unemployment in an attempt to restore profitability, or it may choose to try to
cut wages. But both stratagems entail
high risk. Combining the two is
exceptionally high risk. Only in a
period of desperation and generalised crisis would they be attempted or could
they be potentially successful.
Under the cloak of the public health
crisis which their own policies have helped to create, the current government
is attempting such a strategy. Naturally it is in the interests of all workers,
all the oppressed and vast majority of society that they are not successful.
In the West the population is at present sheltering to
protect itself from Covid, entering the greatest economic downturn since the
Great Depression, and facing the threat of unemployment and reduced living
standards. On the other side of the world in China, something going in exactly
the opposite direction is occurring. China unveiled its new Five-Year Plan.
This will take a country which in 1949 was almost the poorest in the world, and
its almost 1.4 billion population, into the ranks of high-income economies by
international classification – with all the steps forward in life expectancy, living
standards, health, education and social conditions this brings with it.
There has never been such a large scale economic and social ‘miracle’
in the entire history of humanity – the population of China is larger than the combined
population of all other high-income economies in the world.
This transformation therefore poses the most profound possible
questions for socialists, socialist theory, and the international left. If, as
some on the left claim, China is a capitalist country then the only conclusion
that can be drawn from these facts is that capitalism remains a progressive
system. If capitalism can raise almost one fifth of humanity from nearly the world’s
most grinding poverty to high income status in 70 years, that is within a
single lifetime, it is nonsense to claim that capitalism has exhausted its
possibilities. If capitalism had delivered 850 million people from
internationally defined poverty, as China has, then capitalism would have
delivered gigantic progress for humanity. Capitalism would have delivered an
immense improvement, a qualitative step forward in life, for a higher
proportion of humanity than the European Union and the US combined.
Furthermore this capitalist system would also have been demonstrated
to be able to deliver similar results not only to China but to be a path that
could be followed by other major countries – for example Vietnam, a country of
almost 100 million people, is delivering economic growth and reduction of
poverty at a rate, if at an earlier stage of development, essentially the same
as China’s. If capitalism can deliver such benefits it is utopian not to
support capitalism.
But in that case, there is an impossible mystery. Why has
such unparalleled economic development and improvement in living conditions not
been delivered by the other countries following the capitalist system?
In summary, the ‘leftist’ claim China is a capitalist
country paradoxically, and doubtless against the subjective intentions of those
on the left who put it forward, leads to the conclusion that capitalism can
deliver historically unparalleled improvements in living standards!
There is in fact no such mystery because China, and Vietnam,
are not capitalist but socialist countries. That is why such progress has been
made. And this is why the left has a real model for economic development across
the world – something it is vital for the left to understand, most immediately
in developing countries. Socialism is not a utopia, it is not a dream, it is
not something which was achieved in 1917 in Russia and has never been achieved
since. It is something real, totally practical, and which delivers immediate
benefits to truly gigantic numbers of people.
The following article by John Ross, which appeared in
China.org.cn, on China’s new Five Year Plan analyses the historical facts which
have to explained by any analysis of China, the nature of its new plan, and the
step forward that this represents as the country enters the stage of
development of a high income economy.
* * *
The press conference which followed the Plenary Session of
the CPC’s Central Committee put forward guidelines not only for China’s next
Five-Year Plan, for 2021-2025, but also for more medium-term development of
China up to 2035. The two are interrelated because the next Five-Year Plan will
inaugurate a qualitatively new period in China’s economic development which is of
global significance. This goes beyond the fact that China’s short-term economic
prospects are better than for any other major country – the IMF estimates in
2020-2021 it will account for 60% of global growth. The new Five-Year Plan inaugurates
a fundamental transition.
China in 2020 became a ‘moderately prosperous’ economy by
its own national classification – also achieving its goal of the elimination of
absolute poverty. But most countries use World Bank classification in making international
comparisons – dividing economies into low, medium and high-income groups. By
this criterion in approximately 2022-23, the middle of the next Five-Year Plan,
China will enter the ranks of global ‘high income economies.’
Achieving this new level of development determines the
Five-Year Plan’s nature. Previously China planned for escaping underdevelopment,
whereas this plan centres on the different tasks of building a high-income
economy. Furthermore, due to US actions, it will do so in a different
international context and where serious challenges face humanity – particularly
the threat of climate change and of economic recovery from a pandemic which Western
failure to control has created the deepest global economic downturn since the
Great Depression.
To understand this Five-Year Plan’s place in China’s national
development, the almost incredible character of what has been achieved must be understood.
In 1949 China was almost the world’s poorest country – only 10 counties had
lower per capita GDPs. Only 73 years later, the span of a single lifetime,
China will count among the world’s high-income economies.
When the Communist Party of China took power in 1949 in
essence it put forward a promise to China’s people: ‘if China adopts our
methods the Chinese people will be taken from a century of humiliation, regain
control of their own destiny and rejuvenate their country.’ The achievement by
China of high-income international status during the next Five-Year plan is a key
symbol on the economic field that this promise was delivered – following
similar achievements in national unification, elimination of foreign military forces,
gigantic improvements in health, life expectancy, education, culture and
numerous other fields.
Internationally the scale of what is represented by the new
Five-Year Plan is clearly understood by historical comparison. Today, by World
Bank classification, only 16% of the world’s population lives in high income
economies. But China is 18% of the world’s population. China becoming a high-income
economy will therefore more than double the proportion of the world’s
population living in such states. It is a fact that no such comparable single improvement
in the position of such a large proportion of humanity has ever taken place in the
whole of history.
This staggering achievement brings new challenges. Some are
internal – a high income economy is far more complex than a low or medium one.
But some are external. The US has embarked on an attempt to block China’s development. This
path was launched by Trump with tariffs and technology bans. But there is no
indication that US policy will fundamentally change no matter who wins the US
presidential election.
This is what makes the much-discussed concept of a ‘dual
circulation’ economy so crucial in the new plan. Many US analysts consider
Trump made tactical errors in his attack on China. That the tariffs were a
mistake as they were paid by the US population and attacked China on terrain
where it was strong, and the US could not compete – good quality medium
technology manufacturing. Instead, it was argued, the US attack should be concentrated
on its strong point – high technology. The US should concentrate on weakening China’s
most high technology companies as with Huawei and Tiktok. Trump and Biden are therefore
urged to create a ‘technology blockade’ of China.
There are certainly doubts whether the US can achieve this goal
– it is against the interests of other countries and its own high technology
companies which previously had strong markets in China. But it would be a naïve,
unrealistic, strategy for China to base its policy on an assumption that US
policy will collapse due to its own contradictions. Therefore, to progress as a
high-income economy, China will have to increasingly rely on its own
technology. Every part of the production chain must be potential achievable in
China – best described as ‘domestic circulation’. This is different to the 1978-2016
period in which China could rely to a great extent on importing technology.
China remains committed to globalisation, which would be the
best path of development for the world, and uses every opportunity for
internationalisation, but in the new situation its domestic economy will
dominate.
Obviously, this requires great national effort – money has
to be poured into R&D and scientific research. Large investments are required
to embody and produce new technology. Fortunately, China has the financial
resources for this.
This issue overlaps with international problems which are
not just due to US policy but also to common problems of humanity and particularly
climate change. Regarding this it is China’s prowess in the field of renewable
energy manufacturing technology that makes possible the meeting, and potential
exceeding, of the goals of the Paris Climate Change accords.
China had outlined its goal of ‘ecological civilization’ conceptually
previously but global attention was paid to Xi Jinping’s statement at the UN on
22 September that: ‘We aim to have [carbon dioxide] emissions peak before 2030
and achieve carbon neutrality before 2060.’ For example, Adam Tooze, one of the
West’s most eminent economic analysts and historians, noted in the US Foreign
Policy magazine: ‘with those two short sentences China’s leader may have
redefined the future prospects for humanity.’
To achieve these goals, they will have to begin to be
embodied in the new Five-Year Plan and globally these will be among the most
eagerly noted of its targets.
All economies will be adversely affected by the coronavirus
crisis. But within the group of advanced
industrialised countries, the UK economy is set to be one of the most badly hit
by the crisis. This relatively worse
performance is entirely due to entirely policy choices.
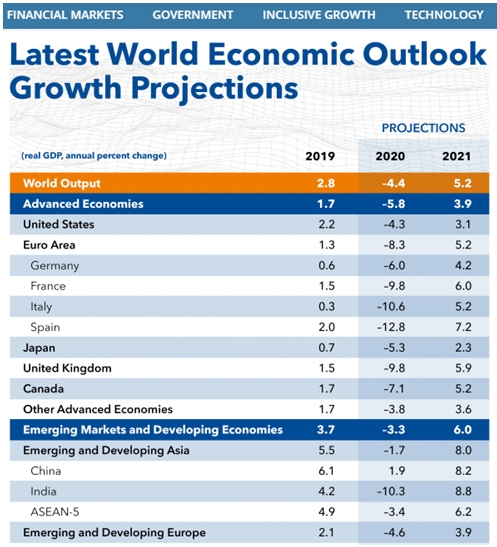
One indicator of how much worse the British economy will perform is shown in the International Monetary Fund’s (IMF) latest World Economic Outlook. The key table on real GDP growth projections is shown below.
Table 1. IMF WEO Real
GDP Projections, October 2020
Source: IMF
As the table shows, the UK economy is projected to contract
by 9.8% in 2020. This is far worse than
the performance of either the world economy as a whole, where output is
expected to decline by 4.4%, or for the advanced economies which are projected
to decline by 5.8%.
According to the IMF, none of the advanced economies is
projected in 2021 to fully recover the output lost in 2020. If the entire 3-year period of 2019 to 2021
is taken together, the world economy is expected to grow by just 3.4% over that
time period and the advanced economies are expected to lose just under 0.5% of
GDP. But the UK economy is expected to
have contracted by 3%.
The IMF’s projection are unlikely to be pinpoint accurate in
all cases. But the general trend is
similar to that of other major international forecasters, such as the
OECD. The UK economy is expected to be
much weaker over the medium-term than even the very weak advanced economies.
Reasons for economic
weakness
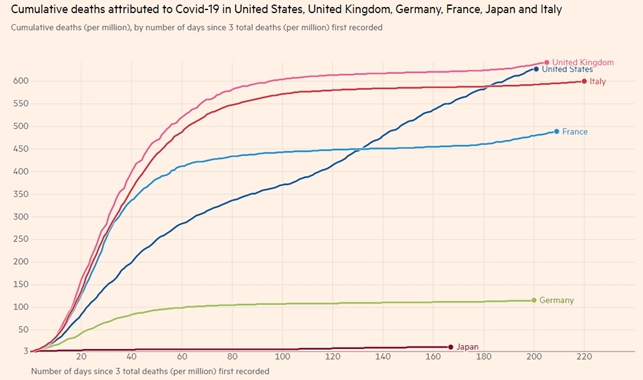
The primary reason for the relative weakness of the UK
economy is the scale of the pandemic itself.
This is shown in Chart 1 below.
Chart 1. Advanced
Economies Covid-19 Death Toll per Million
Source: FT
The UK’s death toll is currently 642 per million, the worst
among this group of advanced economies. There is no ‘trade-off’ between
economic activity and suppressing the virus.
A failure to drive down the number of cases and deaths inevitably means
that the economy cannot recover as all types of consumer industries are
hit. The weakness of these sectors also
depresses the production and distribution industries connected to them,
everything from food processing to transportation.
But other factors are also at work. The UK has a uniquely poor government support
scheme for jobs, which has already been kicked away. And the economy was also slowing at the turn
of the year, prior to the pandemic and in anticipation of Brexit.
All of these, the failure to suppress the virus, the removal of the furlough scheme and the threat of Brexit, are the product of government decisions. It is the government that is causing this extreme economic weakness.
The cumulative consequences are disastrous. In addition to a huge and mounting death
toll, the government’s efforts to ‘protect the economy’ have proved to be
completely counter-productive. This is
shown in the chart below.
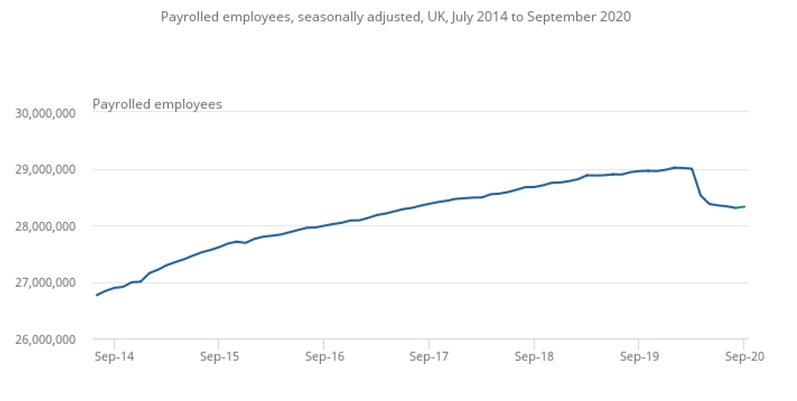
Chart 2 shows the number of UK payroll jobs as reported to
HMRC. As such they are a very valuable
and timely indicator of what is happening to regular paid employment.
Chart 2. UK Payroll
employees
Source: HMRC – PAYE Real Time
The data shows that a net 690,000 jobs have been lost
between January and September this year.
Crucially, there was barely any pick-up in jobs in September despite the
fact that lockdown was ended well before then.
As the full furlough scheme, with 80% of wages paid ends in October,
another slump in payroll jobs seems likely.
This too is the responsibility of the government, who are
well aware ending the furlough scheme will crush jobs. But the government clearly does not see its
role as preserving lives or jobs. The
focus is on preserving profits, and this will be dealt with in a follow-up
post.
The decision of Jay Powell the chair of the US Federal
Reserve Bank (central bank) to adopt a policy of higher inflation is another
hammer blow to workers and the poor.
Already reeling from job losses and pay cuts under the cloak of dealing
with the economic fallout from the pandemic, workers and those on fixed incomes
such as benefits will see their living standards fall even further, if the
central bankers are successful.
The central bank which most closely follows the Federal
Reserve policy changes is the Bank of England. But others may also feel they
are obliged to follow suit, especially as the US Dollar is falling sharply,
which places upward pressure on other currencies and damages their competitiveness.
The new policy
The Fed chair justified his new policy on the grounds that
at some point in the future interest rates would have to be cut again to
support the economy, but as they are already near-zero inflation would be
necessary to allow interest rates to rise first.
This is hokum, which only highlights the complete failure of
official policy in the Western economies over a prolonged period. The G7 has
never properly recovered from the 2008 recession and its economies are now
facing the worst crisis since the 1930s.
The time for decisive action is now, not at some unspecified point in
the future.
The central bankers and many other policymakers share the
widespread misconception that the growth in Consumption is key to economic
revival, because it is the larger component of the Western economies. In reality, as only Investment can add to the
means of production, it is Investment which creates the basis for the
sustainable growth in prosperity.
The false view on the role of Consumption (unfortunately
widely shared on the left and among progressive economists) has led to a series
of absurdities. Money is provided for an
‘eat out to help out scheme’ but money is refused to advanced manufacturing
companies that are going bust. Taxes are
cut for the rich, the central bank inflates money supply, buys bonds, gets
interest rates (both short-term interest rates and bond yields) to record lows
in an effort to boost ‘demand’ – and none of it works.
This is because the crisis which began before 2008 is a
crisis of profits, which is then expressed as a slump in private sector Investment.
The is shown in Chart 1 below.
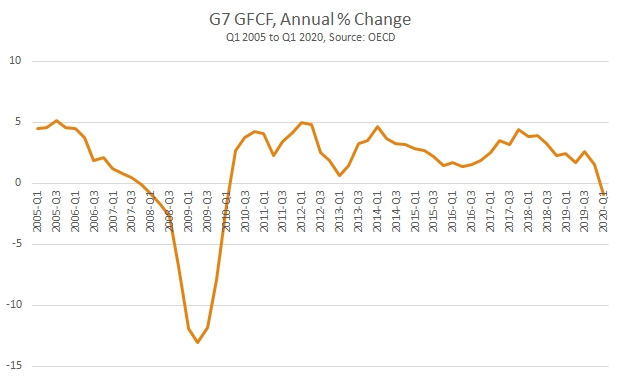
Investment (Gross Fixed Capital Formation, GFCF) in the G7
slumped in the 2008 recession. It had
already begun to slow sharply from 2006 onwards, long before the recession
itself reflecting the slowdown in profits’ growth. Investment was also the component of growth
which registered the largest fall in percentage terms and for a prolonged
period accounted for the entire fall in GDP in the G7. In short, the recession
was driven by the slump in Investment.
Chart1. GFCF Growth
in the G7
As the chart shows, Investment in the G7 remained weak after
recession. There was never a sharp rise in Investment equivalent to the depth
of the fall in 2008 and 2009. Even
worse, Investment was contracting in the leading capitalist economies at the
turn of 2020, that is before the pandemic had any impact.
The G7 economies entered this economic crisis after a
prolonged period of Investment weakness and with renewed declines. And
Investment contracted sharply in the 2nd quarter of this year as the
pandemic spread rapidly. In the US GFCF
fell 7.5% from a year ago and in Germany the decline was 8.3%. Elsewhere it was even worse, with a fall of 24.5%
in France and the UK the worst of all with a decline of 29.8% from a year ago.
The effect of the
policy
It is not possible to address a crisis of investment by
adjusting the policy on inflation. But
that does not mean that the Fed’s new policy will have no effect at all.
The real impact of the policy is that it aims to lift
prices. It has already been widely noted
that jobs are being cut and wages falling across a number of countries,
including all of the G7 in response to the economic impact of the pandemic. By raising the sales prices of producers and
retailers, while wages are being cut across the private sector, the hope is to
raise profits.
Since the decline in profits is itself the cause of the
private sector refusal to Invest, it may even be possible for big business to
lay the basis for a profit-led recovery in Investment. In strictly scientific, that is Marxist
terminology the capitalists will have increased the rate of exploitation either
by getting the retained workforce to work harder without an increase in pay and/or
forcing workers to do the same hours for less pay.
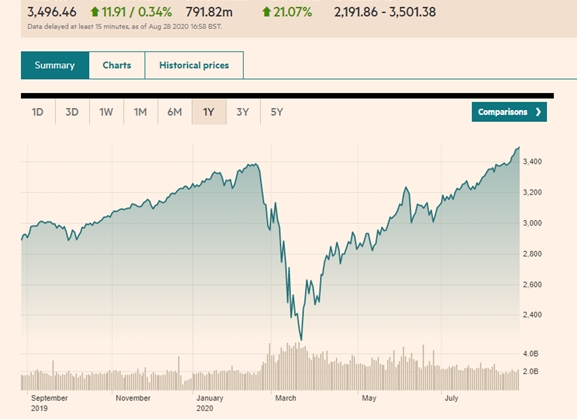
This is certainly what stock market speculators are
expecting. The US stock market is
reaching new all-time highs even during a global pandemic and deep economic
crisis. This is because speculators expect
the actions of firms in cutting payroll and pay to boost profits. The actions of the Fed, and any other central
banks that follow suit, will have the effect of adding to those pressures, for
higher prices and profits, and lower pay and living standards.
Chart 2. S&P
500 Index Above Pre-Covid19 Peak, New All-Time Highs
Source: FT
There is currently an
all-sided attack taking place on the living standards of workers and the
poor. The aim of the new central bank
policy is to reinforce that attack.
The enormous loss of jobs in recent weeks will not be halted
by the miserable ‘summer statement’ announced by the government. In fact, the flow of job losses is a direct
result of government policy itself, in particular how it is ending the furlough
scheme. Despite intense public (and
presumably private lobbying) from both employer organisations and trade unions,
the Chancellor Rishi Sunak made no changes to the furlough scheme, which is
widely described as a ‘cliff edge’ for jobs.
The cliff edge
The jobs furlough scheme is being phased out with employers
having to meet 20% of pay for retained workers from August. The scheme will end entirely in October. The government claims that the scheme is
uniquely comprehensive and generous.
These claims are false.
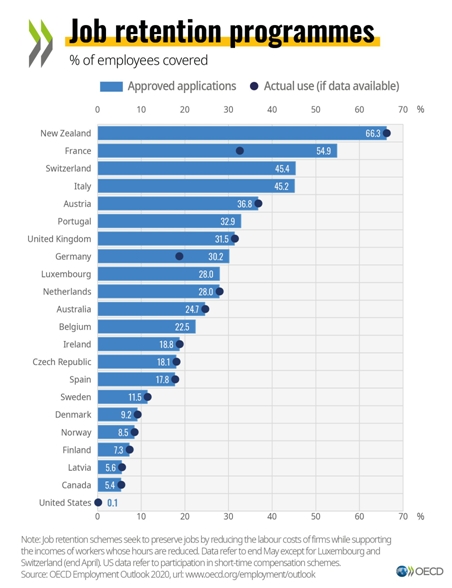
Fig. 1 from the OECD shows the number of employees covered
by the job retention scheme in the UK is less than a third of the total. This is very far from the best in the OECD
and does not include at all the large numbers of self-employed, many of who
have been forced into fake self-employment over several years. It should be
noted too that actual job retention for employees in the US is virtually
non-existent.
Fig1. Job Retention Schemes in the OECD
But soon even these supports will be kicked away. From August 1st, employers will need to pay
20% of wages of retained workers and from October 1st they will have
to pay 100%. The businesses that are
currently generating little or no income will lay off workers rather than have
to pay even 20% of wages. Come October,
the vast majority of businesses who are failing to generate profits will lay
off workers or severely cut pay both, or both.
The reason for the wave off announced job losses now is
because of statutory requirements to consult with the workforce about job
losses. The consultation period varies
according to the size of job losses – 30 days for
layoffs for up to 100 workers, 45 days for 100 or more.
Critics are right to call it a cliff edge. It is because of this sudden and brutal
withdrawal of even the inadequate support for furlough that companies are
announcing the job losses now. And the
wave of announced job losses is enormous, and with a far greater proportion
likely to be done without any fanfare.
The job
losses announced in July alone include Jaguar Land Rover, Poundstretcher,
Bella Italia, Harrods, Arcadia, John Lewis, Accenture, Upper Crust, Café
Ritazza, Harveys, TM Lewin and Royal Mail.
Other companies have threatened job losses to achieve pay cuts, Ryanair,
Mirror Group Newspapers and BA among them.
Against this backdrop, both the scale and composition of the
government’s ‘Plan for Jobs’ (pdf
) is wholly inadequate. A combined package of £30 billion is equivalent to just
1.4% of GDP, the type of small stimulus that would be appropriate coming out of
a mild recession.
Worse, the package is best characterised as a series of
small subsidies to businesses. Yet many
of these consumer businesses will continue to fail because the government has
failed to get the virus under control.
School attendance, footfall in shops and even pub going remain massively
below where they would normally be because the majority of the population is
right to remain extremely wary of a return to normal. Paradoxically, in putting profits first at
every stage rather than public health, the government has deepened and
prolonged the economic crisis.
The private sector in general will only retain workers or
maintain investment levels if there is a prospect of profits. These small-scale subsidies are largely
irrelevant to profitability. At best
they are one-off windfalls to businesses who will not change their plans as a
result. The ‘Plan for Jobs’ will fail.
Remembering 2008 to
2010
There is a remarkable propensity to forget what happened in
the crisis of 2008 onwards. This is
especially dangerous in the current period, because lessons from that period
are vital in understanding the current threat to jobs, pay and living
standards.
The fall in profits in the UK began in 2007, leading to
full-blown recession in 2008. The initial
policy response was to bail out banks and big businesses in 2008 to 2009. Only as the economy stopped contracting was a
vicious austerity programme introduced in 2010.
When the Chancellor announced £330 billion in bail-out
measures in March this year he was simply repeating that sequence. The austerity is in the pipeline.
But history will not simply repeat itself, for two reasons.
It was extremely difficult for businesses to impose big real terms cuts in pay
from 2008 onwards because unemployment did not rise sharply and inflation
remained low. Achieving cuts in nominal
pay (before inflation) under those circumstances is extremely difficult for
businesses. Instead, they relied on the
government cutting real wages in the public sector from 2010 onwards in order
to lower them across the economy, but with only limited success.
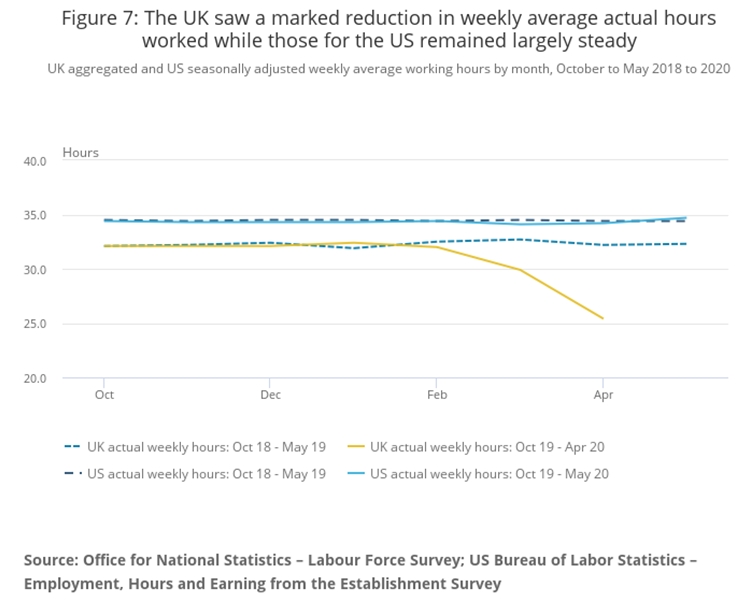
Now, the downturn is much more severe and the government is
attempting to ensure that businesses can take full advantage of the
crisis. The depth of this crisis is
shown in the chart below, in latest data from the Office for National
Statistics (ONS) on average hours worked, which compares US and UK average
hours worked versus the same periods in the previous 12 months.
Chart 1. UK and US Average Weekly Hours Worked to May
2020, per Employee
In the UK, average hours worked in April were 25.4. This compares to 32.2 hours in April 2019, a
fall of almost 27% per cent. As labour
is the most important factor in production, it is impossible for a fall of this
size not to produce an extremely large fall in output.
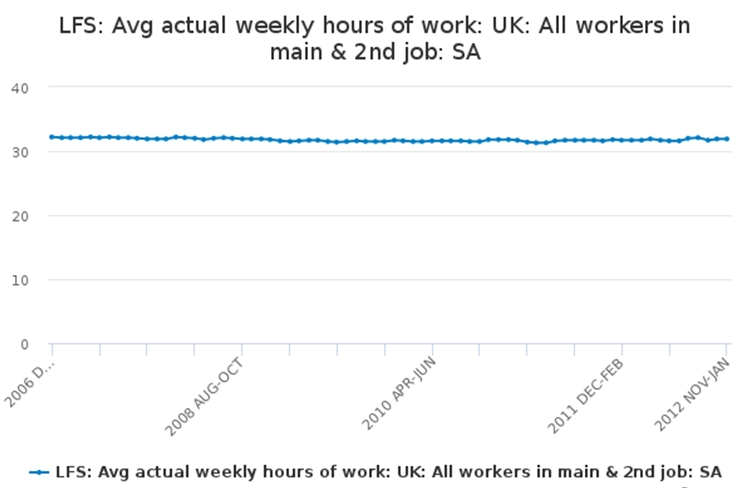
This is in sharp contrast to the crisis of 2008 onwards,
shown in Chart 2 below. Average weekly
hours also peaked at 32.2 hours in February 2008. The low-point was 31.3 hours in April-May
2011, a much more modest decline of 2.9%.
Chart 2. UK Average Weekly Hours Worked in 2008 to 2012
On this measure, of average weekly hours lost per employee,
the current crisis is qualitatively worse than in the recession of 2008
onwards.
The alternative
The ‘Plan for Jobs’ approach will fail because, as in 2008
to 2010 the policy relies on subsidies to the private sector to revive the
economy even though it is unwilling or unable to rehire and invest. On both occasions, pro-business governments
refused to do what was necessary to revive the economy because this would
interfere with the workings of the private sector.
So, (necessary) schools rebuilding programmes are permissible because they do not involve state ownership of the means of production. The state taking control of failing railways, or investing in new renewable energy production are both ruled out. This is because the state then would then become a bigger economic agent, preventing the direct accumulation of profits in some sectors. This would be to overturn the entire policy of the last 40 years, which has been to allow the private sector ever greater ownership of the means of production through privatisation and outsourcing.
One obvious response to the jobs crisis is to share the work
available and demand a 4-day week. This
has already been raised by MPs,
led by the Labour left, and could be taken up by trade unions. But it is imperative that this demand is
raised in conjunction with the simultaneous demand for no loss of pay. Otherwise, there is simply the danger of
facilitating the threats from BA and Ryanair, who have imposed huge pay cuts
under the guise of job-sharing.
But it should be clear that huge attacks on the working
class are coming. In fact they have already begun. The labour movement needs to resist these
otherwise it will suffer very heavy blows.
The depth of the economic crisis that has already begun to
grip the British economy will inevitably lead to a full-scale assault on the
working class. This is because capital
requires the restoration of profits, which will have fallen sharply in the
crisis.
The struggle to increase the rate of exploitation in order
to restore the profitability of UK firms will necessarily be a ferocious one. It
is completely mistaken to suggest that austerity is over as it is imperative
that profits are restored. If there is to be any successful resistance it is
necessary to face facts and not engage in wishful thinking.
The next crisis,
before the last one is over
By widespread consensus, the current crisis will be sharper
than the recession of 2008 to 2009. The
UK recession in 2008/09 lasted 5 quarters from the 2nd quarter of
2008 to the 2nd quarter of 2009 inclusive. From the pre-recession peak in the economy
the total decline in output was 6%, the largest fall in the UK in the
post-World War II era. Because of very
weak growth, the economy did not recover to its pre-recession peak until the 2nd
quarter of 2013, four years after the crisis began.
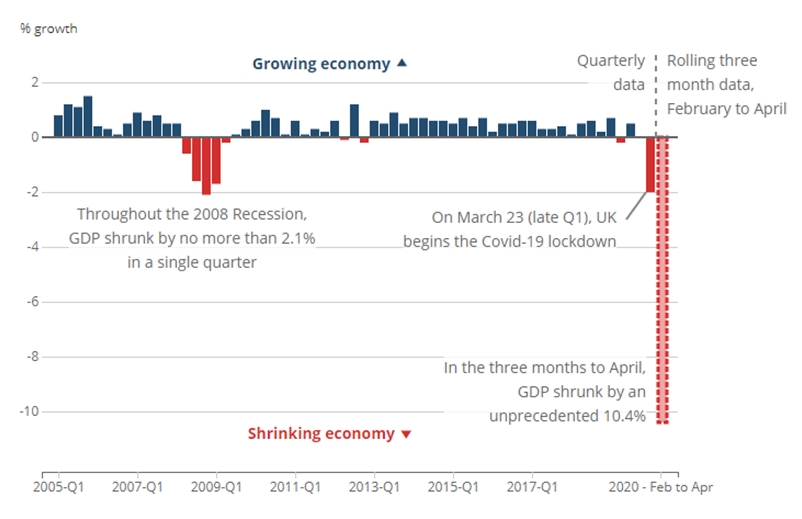
In one important sense, there never has been a full recovery
from that recession in terms of returning to previous trends. There were also clear signs that the economy
was slowing from a very weak pace, even before the impact of the coronavirus
was felt. This can be seen in Chart 1
below, although naturally the most striking feature is the unprecedented pace
of the contraction in March and April this year.
Chart 1. UK Real GDP, Quarterly Q1 2005 to Q1 2020
Source: ONS
The Office for National Statistics (ONS) has highlighted all
periods of economic contraction in red.
Helpfully it has also provided an estimate of GDP in the 3 months to
April. In that period the economy shrank
by 10.4% (and fell by 20.4% in April alone). As the chart shows the pace of the
contraction is already much more rapid than in 2008-09.
It is also likely to be a more severe recession than a
decade earlier. This is based on the
evidence to date. In addition, the most
recent noted forecasts for UK GDP in 2020 range from a 7.2% contraction from
the National Institute for Economic and Social Research, to the ITEM Club’s 8%
fall, to the European Commission’s decline of 8.3%.
But the forecasts are deteriorating as the extent of the
coronavirus becomes clear, along with the UK government’s catastrophically bad
response to it. The OECD is the only
major institution to have published a UK GDP forecast in June and it now expects
a decline of 11.5% in 2020, the worst outcome of any advanced
industrialised economy. This would be
almost double the total contraction in output of 2008-09.
Profits first, last
and always
The motor of the capitalist economy is profits. Firms do not exist under capitalism to make
specific goods, or to employ a given number of people or to provide a basis for
philanthropy. Firms can and frequently
close entire sectors of their business and switch to others, or fire large
parts of their workforce, or spend large resources in avoiding paying
taxes. The purpose of the capitalist is
to realise profits.
In a recession, profits get crushed. Very frequently, profits fall first, firms
stop investing and that itself causes recession. This is precisely what happened in the US
from 2006 onwards, concentrated in the housing sector. In this country there was a very sharp fall
in the rate of return on capital employed by UK firms directly linked the
recession, as shown in Chart 2 below.
Chart 2. Rate of
Return on Capital of UK Firms, 2003 to 2019
British firms suffered a fall in the rate of return of from
11.6% in 2006 to 9.4% in 2009. The
response was ‘austerity’ in 2010, which Alistair Darling’s 2010 Budget
threatened (widely said to
have been written by Peter Mandelson) and which Cameron and
Osborne implemented.
Austerity is aimed at restoring profits. The rhetoric about government debt being out
of control is merely a device to cloak the real content of economic policy, as
was monetarism before it. And one of the
reasons SEB has repeatedly warned that austerity would not be ended now
is because British capital had not resolved its crisis of profitability. In fact, Chart 2 also shows that
profitability was declining once more even before the coronavirus hit.
There are a number of different ways that profitability can
be restored. But, in the unlikely event
that British firms will conquer new markets (at the same time as erecting
barriers to their biggest market in the EU), then the various forms of
increasing the rate of exploitation of workers are required.
These are to demand that workers produce more for the same
pay (either fewer workers and/or shorter hours) or pay is cut outright while
the work is unchanged. In this regard,
the growth of large numbers of unemployed or marginalised workers with few
rights is extremely important. This had
already begun with the growing casualisation of the workforce, the ‘gig
economy’, zero hours and fake ‘self-employment’.
This will be increased through the Covid-19 crisis. In
addition, the government’s new immigration policies will not make good on their
reactionary promise to reduce migration (non-EU migration had already risen
under the Tories to replace the decline in EU migration because of Brexit).
Instead, the real purpose of the policy is to create a large cohort of workers
without either citizens’ or workers’ rights, who can be used to lower pay and
conditions more generally. A general assault on workers’ rights, and the
environmental protections and product standards that are an impediment to
profitability will be facilitated by Brexit.
As the furlough scheme comes to an end, the government has
consciously created a pressure for firms either to cut pay, or to cut
jobs. This gives firms the opportunity
to co-ordinate their efforts, so that the widest possible number can benefit
from increasing the rate of exploitation this way.
Therefore, it is completely muddle-headed to suggest that
Boris Johnson will not return to austerity.
As SEB explained
about the March Budget, he already has. Denying free school meals in the summer to
poorer children while guaranteeing banks’ lending for £300 billion also shows
that transferring resources for poor to rich and from workers to banks ad big
business is back with a vengeance.
A child’s lullaby that everything will be fine, that there
will be an outbreak of fairness from Johnson and Keir Starmer was really a
Cobynista all along is not merely foolish but downright dangerous in the
current circumstances. The British
ruling class is gearing up for an enormous offensive, compelled by the logic of
capitalism itself. The working class and
its allies need to be prepared for the coming onslaught.
In all the catastrophic information generated by the
coronavirus crisis it is easy to overlook an crucial piece of good news. The virus can be defeated and has been
defeated in many countries.
Unfortunately, in many western countries one of the self-serving and
reactionary myths peddled is that the coronavirus cannot be defeated and that
we have to go back to work and ‘live with it’.
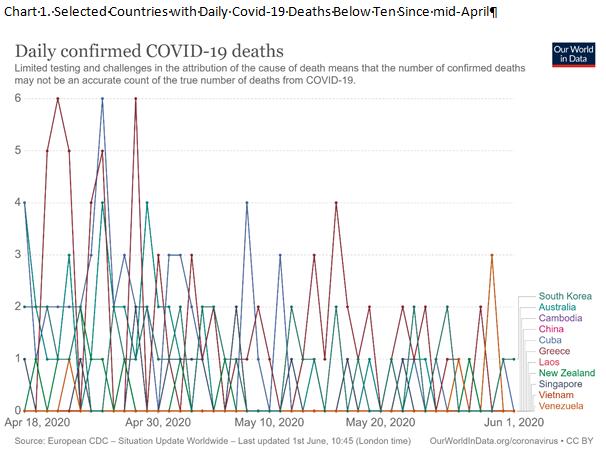
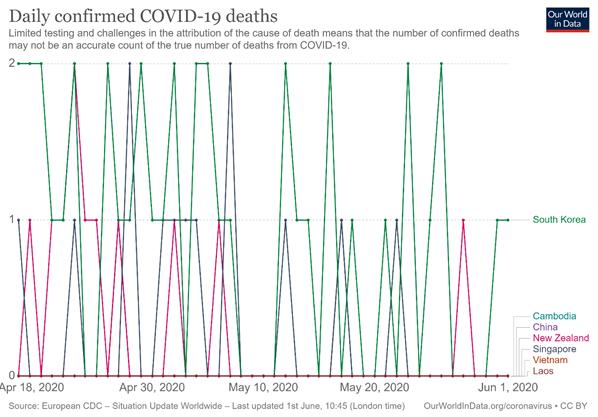
It is easy to demonstrate that many countries have defeated
the virus, or decisively contained its lethal spread. Chart 1 below shows the daily death toll in a
series of selected countries. From April
18 onwards, there is a group of eleven countries whose maximum daily death toll
is now below ten. In many of these
countries, there have been no new deaths at all over a prolonged period.
Chart 1. Selected Countries with Daily Covid-19 Deaths Below
Ten Since mid-April
There are four criteria for selection. Each country has had a significant outbreak
of the disease – meaning they are already below their peak. They have
experienced no sustained new rise in the death toll They are also countries
with a population of approximately 5 million people. Finally, their death toll
has not been in double figures on a daily basis in that period. As the chart shows this group includes
Australia, Cambodia, China, Cuba, Greece, Laos, New Zealand, Singapore, South
Korea, Venezuela and Viet Nam.
Chart 2. Selected Countries with Daily Covid-19 Deaths at
Two or Below Since mid-April
There is a further select group of 7 countries where the
daily death toll has not exceeded two since April 18, shown in Chart 2 below.
This group includes Cambodia, China, New Zealand, Singapore, Laos and Viet
Nam. These countries have effectively
eliminated the deadly spread of the virus. In per capita terms, China has the
lowest death toll of all, which has had no deaths at all.
Taking either group of countries, they are far from
homogeneous in terms of geography, population or political system. What they all did, to one extent or another
is learn from the Chinese experience when it locked down the province of
Hubei. Above all, they put public health
first, not a vain attempt to avoid disruption to the economy.
Taking the second group of countries, their combined death
toll has been minimal over a period of 6 weeks, a total of under 300 over that
period. This is in a combined population
of over 1.5 billion people. They did not
live with the virus. They defeated it.
By contrast, other countries mishandling of the crisis has
been catastrophic, including the US, UK and Brazil. When their leaders demand the population
lives with the virus, of course they mean that many of them will die with
it. This is a political choice, not an
inevitability.
While
most countries in East Asia and the Pacific (China, South Korea, Thailand,
Australia, New Zealand etc) have reduced the number of daily coronavirus and
deaths to essentially close to zero a number of countries, particularly the US
and in Western Europe, have begun to ease lockdown measures even though the
spread of the coronavirus has not been decisively halted. Both logic and
experience are clear that this latter path is the wrong way around to defeat
the spread of the virus. In addition, the World Health Organisation has already warned of a second peak in
cases.
Instead
lockdowns should continue until some time after it is clear that the virus is
at a manageable level – defined as at most less than a few dozen cases and that
full tracking, tracing, testing and isolation regimes are in place.
Of
course, the trajectory of the virus’ spread matters to each individual country.
It matters for every other country too, given the global spread of the
pandemic. It is also important to learn lessons from each other, to avoid the
worst effects of the pandemic and to mitigate them as far as possible.
Unfortunately,
European countries in general have been extremely reluctant to learn from the
countries of the Asian Pacific who have successfully combated the virus. So,
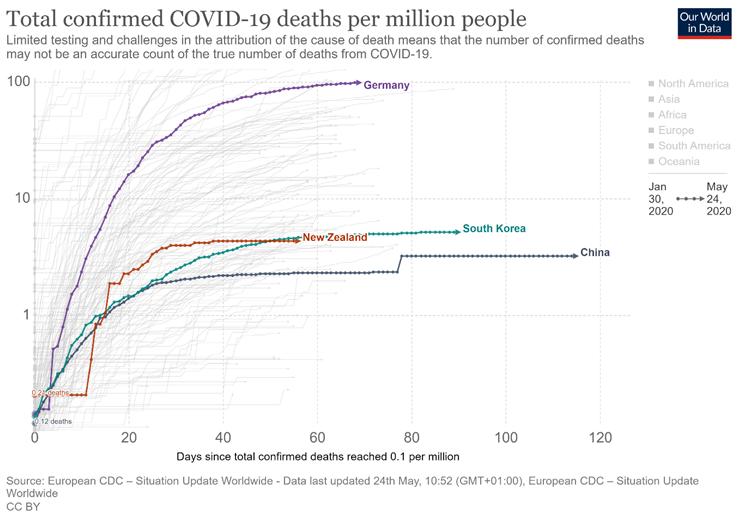
Germany is held up as an exemplar of how to respond to the crisis, when in a
global perspective it is nothing of the kind. This is illustrated in Chart 1
below, which shows the per capita death toll in Germany versus key Asian
Pacific countries. It clearly shows the death toll is catastrophically worse in
Germany (all data throughout from Our
World In Data throughout, unless specified).
Chart
1. Deaths Per Million in China, Germany, New Zealand and South Korea
The
data makes this disparity even more stark. Table 1 below shows the death total
of each of the 4 selected countries in Chart 1.
Table
1. Cumulative Total Covid-19 Deaths for Selected Countries, per million
Total
China
3.3
New Zealand
4.3
S Korea
5.2
Germany
99.5
Source: Our World in Data, based on FT analysis of data from
the European Centre for Disease Prevention and Control and the Covid Tracking
Project.
The
unwillingness to learn from other countries with far greater success in
combating the virus is combined with highly distorted coverage of those
countries in Western media. So, the reports of flare-ups of the virus in both
China and South Korea were treated with a mixture of derision and
misinformation. The implication has been that the Asian Pacific governments
have been extreme in their response and unsuccessful. As the comparative date
above shows, both of these points are untrue. The Asian Pacific countries have
put public health first, unlike the Western governments, and despite a few
missteps they have been remarkably successful.
By
contrast, in their back-to-work propaganda campaign, Western governments
increasingly rely on the completely false assertion that ‘it is impossible to
defeat the virus and we have to live with it.’ Yet many of the Pacific Asian
countries have demonstrated the opposite, including those cited above. Many
have recorded no new deaths for weeks.
Learning from Europe
However,
it is also possible to learn from the missteps of others. In this respect it is
unfortunately the case that Europe provides plentiful examples, especially now
on the premature easing or ending the lockdowns. This is true even in countries
which are relatively successful in combating the spread of the virus, at least
on a European scale.
Countries where new cases are rising
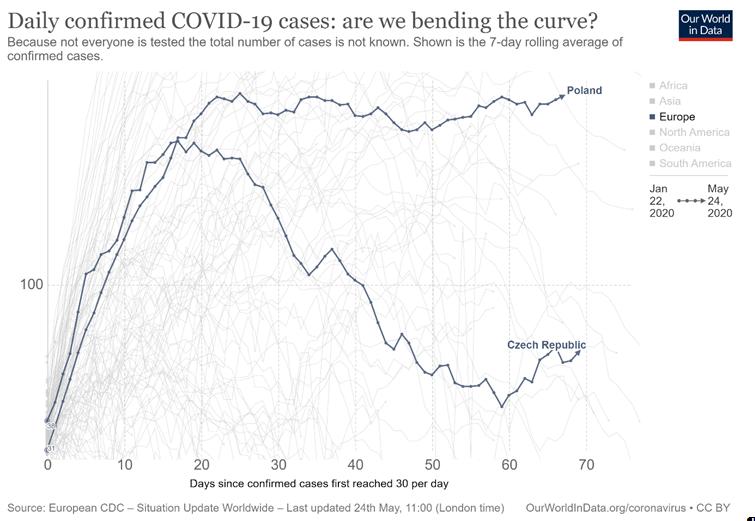
This
is illustrated in Chart 2 below. This shows two European countries where it is
clear that the death toll has started to rise once more, Poland and the Czech
Republic.
Chart
2. Daily New Coronavirus Cases in Poland and the Czech Republic, 7-day moving
average
The
Czech Republic hit a low-point in new cases of 42 on April 27 and these have
since risen to 62. Poland reached a low of 296 new cases on a 7-day moving
average basis on May 5 and they have since risen to 382.
At
this point, the analytical tools provided by Our World in Data are very
valuable. Among many other categories, there is also data on policy changes in relation to the lockdown.
In relation to Poland, the data shows that stay-at-home restrictions on were
introduced on March 31st, but eased again on April 9th.
At the same time Poland has no systematic regime for contact tracing at all. In
the Czech Republic the lockdown on schools was eased on May 11 and the lockdown
for all but essential workers was eased on April 20. Stay-at-home restrictions
were eased one day later, while internal restrictions on movement had been
eased on April 2nd.
Countries where new cases are no longer
declining
There
are also a number of European countries where the fall in new cases has halted.
Hopefully this is temporary, but the previous downward trends in new cases has
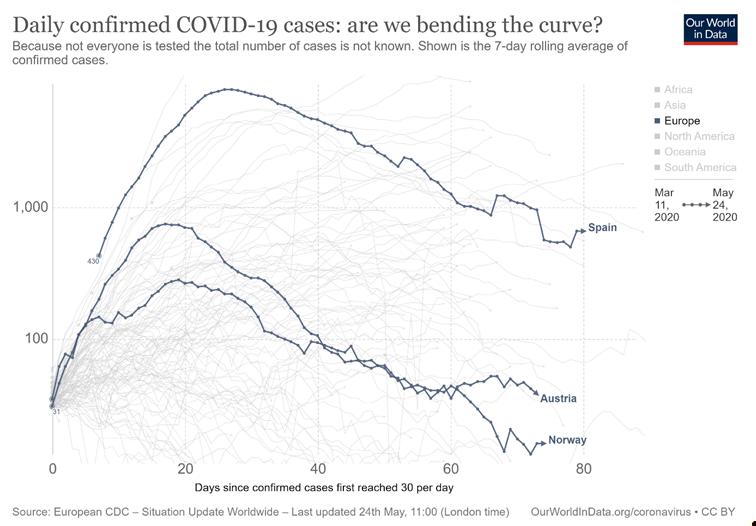
come to a stop for now. Chart 3 below shows the 7-day moving average for new
cases in Spain, Austria and Norway. Hungary could also have been included, but
has been omitted for clarity in the chart.
Chart
3. Daily New Coronavirus Cases in Spain, Austria and Norway, 7-day moving
average
From
the chart above it is clear that new cases in all 3 countries are no longer
falling. The latest level of Spanish new cases is higher than they were six
days ago. The downtrend in Norwegian cases has stalled. There has effectively
been no decline in Austrian cases since May 7.
Austria
and Norway removed restrictions on all but essential work on April 18 and April
20 respectively. The following day Norway also eased restrictions on public
gatherings, but partly reversed course on May 11, while Austria eased these
type of restrictions on May 2. Norway partially lifted restrictions on schools
on April 20 and again on May 11. Austria reopened schools on May 18, having
lifted the stay-at-home order on May 1st.
It
should be noted that, despite much publicity, Spain is not categorised as
having lifted any restrictions within these data. This is because, having been
very late into lockdown after the virus had spread, the eventual easing of
restrictions by the Spanish authorities was extremely limited. Allowing
children out very briefly, plus limited opportunities to exercise and the
partial reopening of bars and restaurants for takeaway and delivery services
which took place at the end of April and beginning of May had always been
allowed in Britain’s rather lax lockdown, for example.
Countries where the downtrend in cases has
slowed
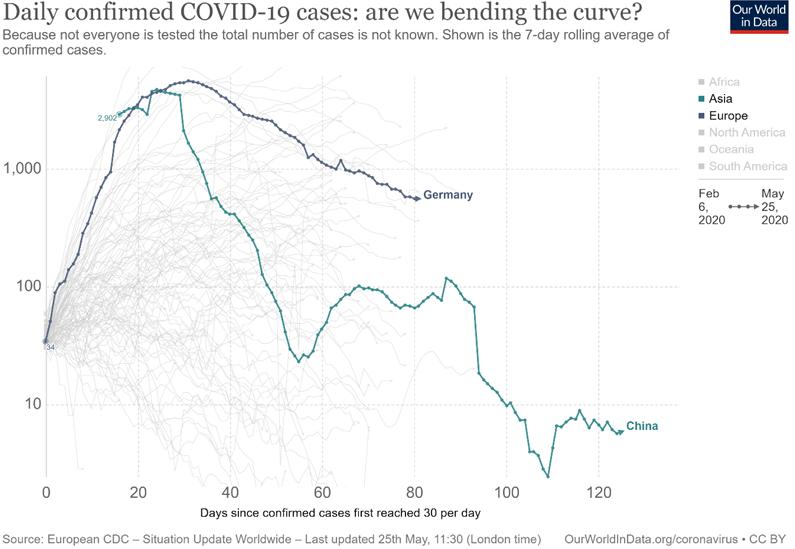
Germany
is not an exemplary country in fighting the virus, as previously noted. Even
so, Germany still has one of the better trajectories in combatting Covid-19 among
the large European countries.
Yet
Germany risks falling into a category of countries where lockdown measures have
been eased but the fall in cases has slowed. This is illustrated in Chart 4
below.
Chart
4. Germany and China New Coronavirus Cases, 7-day moving average
On
May 23rd Germany was in its 83rd day of coronavirus cases, with a
total of 561 new cases per day. At the same period in the spread of the virus
in China cases had fallen to 102 cases. As the chart clearly shows, Germany is
not crushing the spread of the virus in the way that China and other
Asian-Pacific countries have.
But
it has also eased lockdown measures, unlike China and other countries. The
effect has not been to produce a rise in new cases, or even a halt to that
decline. However, the rate of decline has slowed quite soon after the lockdown
was eased. Germany eased the lockdown on schools on May 4, but otherwise most
measures have stayed in place.
Following
this measure, the fall in German cases has slowed. On May 6 German new cases
had slowed to 1,000 per day. They have since fallen by 44% to 561 per day. However,
in the preceding 17-day period they had fallen by 62.5%. This slowdown may only
appear incremental, but the effect is to create hundreds of additional cases
per day. Worse, the real negative effect of easing should only become apparent
up to 14 days later given the incubation period and lags in testing and
results. Using a 7-day moving average to smooth daily volatility will add a
further delay before substantial changes become apparent.
So,
the concern is that a definite slowdown in the new case rate in Germany after
easing the schools’ lockdown may only be registered in the data from now
onwards, in the last week of May. Many other countries where lockdown has been
eased are in a similar position. In both France and Finland it is reported that some schools
were closed once more because of new outbreaks.
The case of Britain
It
is widely understood that in the UK new cases are falling. But it has already
been shown that a simple fall in new cases is insufficient to prevent a
reversal once lockdown is eased.
Two
conditions need to apply. The first is that the number of new cases has fallen
to such a level that each new case can be identified, and the second is that
the contacts of each new case can be rapidly tracked, traced, tested, and where
necessary placed in isolation. Neither of those conditions currently applies in
this country.
Table
2 below shows the number of cases in each of the European countries cited in
this piece at the time lockdown was eased. It also shows, using the Our World
In Data categories, what the type of testing and tracing regimes were in place
at the time of that easing. UK is also shown for comparison.
Table
2. Selected European Countries, Cases Per million and Testing & Tracking
Regimes When the Lockdown Eased
Cases per
million
Testing
Tracking
Poland
9.9
Targeted
None
Czech Republic
11.5
All persons
with symptoms
Comprehensive
Austria
13.8
All persons
with symptoms
Comprehensive
Norway
16.8
Targeted
Limited
Spain*
24.4
Targeted
Limited
Germany
13.0
Targeted
Limited
UK
37.6
Targeted
None
Source:
Our World In Data
*Spain’s
actual ease of lockdown begins on May 26 with a partial school reopening
It
should be clear that the UK is in no position to begin easing lockdown at all. This
comparative group comprises countries where the fall in in cases has either
slowed, or stalled altogether, or where cases are rising once more. Yet in all
cases, the UK number of new cases per million is still far in excess of any of
these when they eased their respective lockdowns.
In
addition, the required system of tracking, tracing, testing (and where
necessary isolation) is simply absent. It is already the case that the UK
system of testing is wholly inadequate, and not just because the government
repeatedly misses its own target of 100,000 people tested each day.
The
UK mortality rate (deaths per case) is currently 14.3%. This compares to a
European average of 8.7% and a global average of 6.5%. There is no suggestion
that the UK is faced with a particularly virulent strain of virus. Instead, the
clear implication is that the testing regime is extremely poor, capturing only
half of the proportion of cases that are recorded elsewhere.
Currently
the UK is still recording an additional 3,000 or so cases per day. It has been
shown elsewhere that each new case presents between 50 and 60 contacts
that need to be tracked and tested. This implies a further 150,000 to 180,000
additional test per day, when even the current requirement cannot be met.
Finally,
there is no contact tracing mechanism in place at all. Instead, we have the
Isle of Wight app, which has disappeared into the same rabbit-hole as the Dyson
ventilators.
The
UK has an extraordinarily high new case rate, despite a limited level of
testing which artificially depresses those numbers. For example, the Office for
National Statistics estimates that the new case rate is 9,000 per day. Any
easing of lockdown would require a massive increase in the current rate of
testing in order to cope with just the currently identified cases. And there is
no system in place at all for tracing those contacts of new cases. None.
The
government says it will make a decision on easing lockdown on May 28 and the Prime
Minister now insists once more that schools will re-open on
June 1. Now is the time to apply maximum pressure to resist this
reckless decision with predictably dire consequences.


Recent Comments