
By John Ross
Socialism’s aim is to improve the well-being of humanity. And nothing in history has remotely improved the condition of such a large part of humanity in such a small period of time as the development of the People’s Republic of China since 1949 – the 70th anniversary of the founding of which occurs on 1 October 2019.
China’s was one of the two greatest socialist revolutions of the 20th century – the other was the October 1917 Russian revolution. The international impact of the Russian revolution, overthrowing the weakest link in the imperialist system, among its other enormous achievements, played a decisive role in smashing to pieces the colonial empires which had oppressed the great majority of humanity for centuries. China’s was the greatest revolution within the developing countries, those oppressed by imperialism, within which the great majority of humanity still live.
In 1949 China, oppressed by a century of foreign invasion in which around 100 million Chinese people were killed, was almost the world’s poorest country – the details are in the article below. Angus Maddison, former head of statistics of the OECD, and the world’s most renowned analyst of long term growth, calculates that at the time of the creation of the People’s Republic of China (PRC) its per capita GDP was not only lower than 130 years previously but far lower than Western Europe or England in 1500 – that is lower than in the late European Middle Ages and far lower than at the time of Shakespeare. Reflecting this fact average life expectancy in China was only 35. But by 2019 China’s people, almost 1.4 billion or nearly a fifth of humanity, had been lifted from poverty to a living standard to the verge of becoming a high-income economy by international standards. Nothing approaching such a rapid improvement of the life of such a large proportion of humanity has ever taken place anywhere else in human history. That is the measure of the literally incredible achievement of the PRC since 1949.
The article below examines that improvement in the life of China’s people via the most direct of all measures – life expectancy, which is well known to be the most sensitive measure of overall social well-being. The figures are staggering. Leaving aside China itself, China’s life expectancy has increased by more than that of 99.2% of humanity! This is in addition to China being responsible for lifting over 850 million people out of internationally defined poverty – three quarters of the reduction of world poverty. China has lifted out of poverty far more people than the entire population of the European Union or the entire continent of Latin America.
Capitalism naturally lies regarding China
To anyone who can think seriously about the well-being of humanity what is reflected in these ‘dry statistics’ about China is such a gigantic improvement in the lives of people that for anyone understanding it they must almost be moved to tears. Therefore, naturally capitalism does everything it can to make sure such realities are known to as few people as possible in the world. Nothing else is to be expected from capitalism, because if such realities were widely known it would be a gigantic blow to the standing and hegemony of capitalism. As China becomes still more successful, and the life of the 1.4 billion Chinese people improves further, all that will happen from capitalists and the media they control is that the amount of distortion and lying will increase – because it is vital for capitalism to prevent the rest of the world knowing how much the life of the Chinese people has improved in the 70 years since China’s socialist revolution. Because if that truth is known more people, particularly at present in developing countries, would want to follow that route.
Any serious progressive individual or media, let alone socialists, would, of course, hail the gigantic step forward for humanity which has taken place in China – while doubtless making whatever were their liberal qualifications or critiques of it. But capitalism and liberals long ago ceased to be progressive. If you read newspapers such as the Guardian or the New York Times around the 70th anniversary of the PRC you will see not analysis of what a huge step forward for humanity this is but suppression of the real facts regarding China’s development – liberals long ago ceased not only to be progressive but to pay any attention to the truth.
In addition to the overall lies against China there are of course specific ones which any examination of the facts disproves. One is related to the gigantic support for Mao Zedong in China. Supposedly this is inexplicable given that it is claimed by capitalism Mao Zedong was a vile oppressor. In reality in China during the period of Mao Zedong, despite the huge mistakes of the Great Leap Forward and Cultural Revolution, China experienced the most rapid improvement in social conditions, reflected in increase in life expectancy, in human history – a reflection of China’s emphasis on health care and education. As the article notes: ‘In the 27 years between the establishment of the People’s Republic of China in 1949, and the death of Mao Zedong in 1976, life expectancy in China increased by 31 years – or over a year per chronological year…. Far from being negative, China’s record in this period was one of history’s most extraordinary social achievements.
‘Instead of engaging in factual falsification and myth making, foreigners can more accurately understand the support for Mao Zedong in China, even leaving aside other issues, such as the achievement of real national independence, merely by the lived experience of this fact. If someone leads you to live an extra 31 years it is unsurprising you hold them in esteem! ‘
The fact that capitalism systematically lies about China of course makes it incapable of understanding the real dynamic in that country.
Confusion in parts of the left
But if rejection of reality is to be expected from capitalism and its apologists what is ridiculous is that sections of the left refuse to face such a gigantic reality as China’s social achievements – these ‘left’ criticisms in fact only repeat capitalist propaganda. At the most absurd they spread capitalist lies such as that Chinese workers life in ‘slave like’ conditions – something which is refuted in 1 second by looking at the figures on China’s life expectancy dealt with in this article. The idea that a ‘sweatshop’ produces a more than 40 year increase in life expectancy, more than every major country in the world, is an absurd joke, or more precisely ‘leftist’ repetition of capitalist propaganda.
Illustrating even more lack of seriousness about socialist and Marxist theory is left repetition of the claim that China is capitalist. This is refuted by any Marxist analysis of China’s economic structure – see ‘Why China is a socialist country – China’s theory is in line with Marx (but not Stalin)’. For those who claim China is capitalist it is then necessary to explain why these gigantic and measurable steps forward for humanity took place in a country which declares itself socialist and no such step forward was taken in countries which declare themselves capitalist. But it is also necessary to understand the profound consequences. If ‘capitalism’ is capable of lifting more than 850 million people out of poverty then capitalism is not reactionary but is a profoundly progressive system. This foolish so called ‘left’ criticism of China therefore turns out to be…. a justification for the progressive role of capitalism!
But the practical consequences of confusion on the left on this issue are extremely serious. China has an economic system which demonstrably delivers in practice, not merely in theory, enormous improvements in the living conditions for the overwhelming majority of the population and in particular the poorest sections of society. It is based on the socialisation of the dominant sectors of China’s economy – that is the ability of the state to control the level of investment in China. As it was stated at the 3rd Plenum of the Central Committee of the 18th Congress of the CPC, the latest comprehensive statement of China’s economic policy: ‘We must unswervingly consolidate and develop the public economy, persist in the dominant position of public ownership, give full play to the leading role of the state-owned sector.’ Any study of how China’s economy is regulated confirms that decisive role of the state sector.
The left should be using this model to explain that it is the most effective method to raise living standards and eliminate poverty. In Latin America, for example, where the left was unable to deal with the consequences of the downturn in commodity prices after 2014, this is decisive. As Brazilian socialist Elias Jabour put it recently: ‘The rise of China means that Brazil and Latin America has a real alternative to neo-liberalism. It provides the possibility for greater economic integration outside the orbit of imperialism. It is impossible to imagine the existence of progressive governments in Latin America without the existence of socialist China.’ This applies both to the support that economic interaction with China can give to Latin American, and other developing, countries and to how the Chinese economic model provides a proven practical alternative to neo-liberalism within Latin American countries.
The left in China
But also, internationally, it is necessary to understand that the biggest left in the entire world is in China. The best way to understand that is to read Weibo, the Chinese equivalent of Twitter, or to follow websites such as Guancha.cn – something it is entirely possible for anyone who does not read Chinese to do with modern translation software. And for those who do not trust anything produced in China, or find it too tiring to use translation software, they can get a distorted but not wholly inaccurate vision by reading Jude Blanchette’s China’s New Red Guards. No where else but China do you find obviously left-wing leaders who have 3 million, 5 million, 6 million followers on social media. And these huge left-wing forces are unequivocal in their support of the overall path, naturally not every specific policy, of the CPC. They are ‘Maoist’ in their overall world outlook. The Fidelista left in Latin America is undoubtedly the other mass socialist/Marxist current in the world, but even that is much smaller than the left in China.
Understanding the actual reality of China, and the impact this has on its population, will immediately lead to realities the ‘Western left’, in particular the left in Europe and North America, finds very hard to immediately understand. But they are based on the social realities analysed below. For example, this is the evaluation of Fidel Castro, the greatest Marxist/socialist leader ever to have lived in the Western hemisphere, of China: ‘If you want to talk about socialism, let us not forget what socialism achieved in China. At one time it was the land of hunger, poverty, disasters. Today there is none of that. Today China can feed, dress, educate, and care for the health of 1.2 billion people.
‘I think China is a socialist country, and Vietnam is a socialist nation as well. And they insist that they have introduced all the necessary reforms in order to motivate national development and to continue seeking the objectives of socialism.
‘There are no fully pure regimes or systems. In Cuba, for instance, we have many forms of private property. We have hundreds of thousands of farm owners. In some cases they own up to 110 acres. In Europe they would be considered large landholders. Practically all Cubans own their own home and, what is more, we welcome foreign investment.
‘But that does not mean that Cuba has stopped being socialist.’
Of China’s current president Xi Jinping this was the evaluation of Fidel Castro: ‘‘Xi Jinping is one of the strongest and most capable revolutionary leaders I have met in my life’. The left in China clearly supports Xi Jinping – naturally not without abandoning their specific views but clearly as regards the overall course of China. For exactly the same reason the capitalist press in the West is particularly full of bile and hatred against Xi Jinping – innumerable articles spewing out attacks on him as the 70th anniversary of the creation of the PRC approached.
It is not necessary for the Western left to become involved in detailed assessment of China’s leadership – although for China this is extremely important. What the international left does have to understand is that the greatest rapid improvement in the condition of the greatest proportion of the world’s population in human history has taken place in the 70 years of the PRC.
The role of the socialist left
For the mass of the population who live in Europe or North America it is difficult for them to imagine what it meant to make a socialist revolution, and to commence constructing a new society, from an economic starting point lower than their own countries in the Middle Ages and in only 70 years to achieve a standard of living and a life expectancy that is on the verge of high incomes economies. Only China’s continued development will convince the mass of hundreds of millions of people. That is why there is a much wider and more understanding of China’s stupendous achievements in Africa, developing Asia, and Latin America than there is in Europe or North America. But what there is no excuse for is that parts of the so called ‘intelligentsia’, who are supposed to understand the course of human history, do not grasp such facts.
The following article, written for China for the 70th anniversary of the creation of the People’s Republic, focuses not on the data on GDP but on the most important factor or all – the impact of the 70 years of the Peoples Republic of China on the life of the Chinese people.
* * *
‘The Chinese people have stood up,’ the title of this famous speech by Mao Zedong in 1949 embodied a promise made by the Communist Party of China to the people of China. This promise was that if China adopted the socialist programme and methods of the CPC the Chinese people would be progressively lifted from more than a century of poverty, foreign invasion, foreign oppression, and humiliation by foreign powers to regain a position in which no country or people in the world was superior to China.
Measuring China’s social progress
There are numerous ways to measure whether the promise by the CPC was kept. A number specifically relate to China’s specific national identity and its situation in 1949. For example, in a total transformation of China’s position from the preceding century, no country any longer dares militarily attack China – due to the strength of the People’s Liberation Army (PLA) and the economic and technological power that now sustains it. China has now also completely regained its territorial integrity – all former foreign concession territories in China have been abolished, Hong Kong and Macao have reunified with China, only US controlled Taiwan province still remains to be regained practical control of and that is only a matter of time. Numerous foreign countries now seek friendly and equal relations with China. That the socialist path of the CPC has delivered its 1949 promise on the field of China’s national integrity is beyond doubt.
But it is also legitimate to make international comparisons by more universal and less specifically national criteria – those regarding the development of the overall social position of the Chinese people compared to other countries. Fortunately, since 1949 the situation of humanity as a whole has advanced – the old colonial empires have been destroyed, living standards have improved, life expectancy has increased. How has China developed in comparative terms? Has China improved its social conditions more rapidly than other countries – justifying the CPC’s promise that its programme and methods, based on Marx-Lenin-Mao Zedong, were the best to achieve China’s rejuvenation – or do the facts show that other countries have achieved superior social progress in the 70 years since the creation of the PRC?
Why life expectancy is the most sensitive measure of social progress
Among the different potential criteria that could be used to measure China’s relative social progress compared to other countries one is in reality decisive. The declared aim of the CPC is to ‘Serve the People’. In policy terms its framework is ‘people centre development’ – which is necessarily integrated with China’s national rejuvenation because China’s people are overwhelmingly its greatest power and resource. How much, therefore, in overall terms has the overall condition of the ordinary people of China improved since 1949? Has the CPC delivered on its promise that its methods would deliver improvement in the conditions of the ordinary people of China in a way superior to any other?
One single criterion is in reality sufficient to dramatically demonstrate the superiority of the socialist path China embarked on 1949 compared to alternatives. This is the increase in the life expectancy of the Chinese people compared to other countries. This fact also entirely adequately demonstrates that the slogan of the CPC, ‘Serve the People’, is not empty words but is the precise result of the party’s activity.
The reason the criterion of life expectancy is decisive and chosen for analysis is not simply, or even primarily, that increase in life expectancy is a universal wish of human beings – although it certainly is! It is because it is well known to economists that life expectancy is the most comprehensive and sensitive measure for judging the overall impact of changes in social and environmental conditions. This is due to the fact that average life expectancy summarises in one single figure the effect of all positive social developments (high quality consumption, good health care, improvements in education, environmental protection etc.) and subtracts the negative ones (poverty, poor health care, lack of education, environmental degradation etc. Life expectancy is therefore a more adequate measure of social well-being than purely per capita GDP – significant as the latter is, and despite per capita GDP being the single biggest determinant of life expectancy. As Nobel Prize winner Amartya Sen summarized regarding the relation between these variables:
‘Personal income is unquestionably a basic determinant of survival and death, and more generally of the quality of life of a person. Nevertheless, income is only one variable among many that affect our chances of enjoying life… The gross national product per head may be a good indicator of the average real income of the nation, but the actual incomes enjoyed by the people will also depend on the distributional pattern of that national income. Also, the quality of life of a person depends not only on his or her personal income, but also on various physical and social conditions… The nature of health care and the nature of medical insurance – public as well a private – are among the most important influences on life and death. So are the other social services, including basic education and the orderliness of urban living and the access to modern medical knowledge. There are, thus, many factors not included in the accounting of personal incomes that can be importantly involved in the life and death of people.’
By studying the development of life expectancy during the 70 years of the People’s Republic of China therefore in fact what is being studied is the overall development of the Chinese people’s standard of life compared to trends in other countries.
The conclusion of such comparative study of international facts is simple and clear. The CPC has delivered on its promise that its methods and programme would create results superior to any other – in particular China’s socialist path of development has achieved results which are superior to any capitalist alternative. These are not empty boasts, or purely nationalist rhetoric, but are simply the objective results of the study of global development since 1949.
Resolving historical debates on China’s development
Carefully establishing the facts on this question also casts a clear light on key issues in China’s own history, on international discussion regarding China’s success, on understanding of China’s perception of itself, and in grasping the role of the CPC and the socialist path of development that flows from it.
It is extremely important internationally to establish this fact regarding the unparalleled increase in China’s life expectancy compared to other countries and the conclusions that flow from it. While, as will be seen, the scale of China’s economic and social development in the 70 years since the establishment of the PRC is unequalled this is frequently not shown in China’s research in presentation of its own achievements – particularly as presented internationally. Too often systematic comparison of China’s achievements compared to other countries is not carried out, which allows excessive international circulation of slanders against China and also even allows the spreading of false analyses within China.
To attempt to contribute to a more widespread understanding of the truly enormous scale of China’s social achievement this article therefore carries out a systematic study of the development of life expectancy in China compared to other countries since the establishment of the PRC. This establishes clearly that the increase in life expectancy since 1949 shows that China’s is by far the greatest social miracle in any country in the last 70 years, and probably the greatest social miracle in the entire history of humanity. It will be shown that such a conclusion is not overheated nationalist rhetoric, but simply follows from an objective and impartial study of the facts.
China’s extraordinary achievement in life expectancy
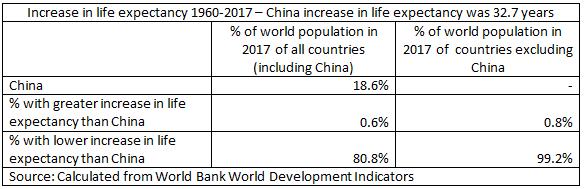
Turning to the overall comparative results of China’s increase in life expectancy compared to other countries these are summarised in Table 1. Ideally a comparison would be made of life expectancy for all countries starting in 1949, but systematic World Bank data is not available before 1960 – a specific study of China for the period 1949-1960 is given below. However, from 1960 to 2017, the latest available data, systematic World Bank data covering 189 countries exists, accounting for 99.3% of the world’s population. That is, from 1960 entirely comprehensive international comparisons can be made – systematic international comparative data therefore exists for 57 out of the 68 years of the existence of the PRC. Furthermore, as will be demonstrated, there is no indication of countervailing data for the period 1949-1960. There is, therefore, no doubt as to China’s performance compared to other countries.
The comparative international results are overwhelming and conclusive.
- In 1960-2017 China’s average life expectancy increased by 32.7 years – from 43.7 years to 76.4 years.
- By 2017 China’s 1,386 million people had enjoyed a higher increase in life expectancy than 6,027 million people, living in countries with a lesser increase in life expectancy than China, and only 46 million people living in countries with a greater increase in life expectancy than China.
- China’s increase in life expectancy was therefore higher than that of 99.2% of the population of the world’s countries excluding China.
- Only 0.8% of the world’s population, excluding China, lived in countries with a longer increase in life expectancy than China – this was purely in six small countries, Bhutan, the Maldives, Tunisia, Timor-Leste, Nepal, Oman.
To show clearly how overwhelming is China’s increase in life expectancy compared to other countries, Figure 1 shows graphically the percentage of the world’s population living in countries with higher and lower increase in life expectancy than China in 1960-2017- including China in the calculation.
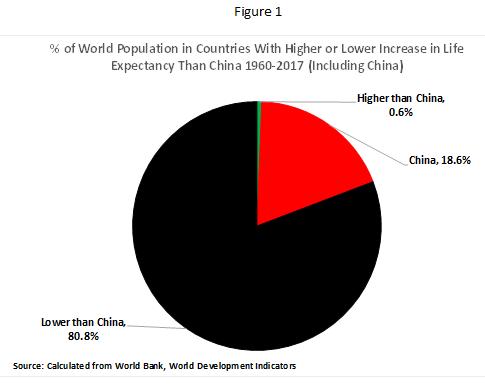
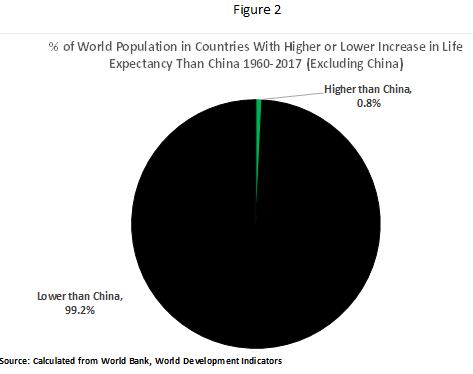
Figure 2 shows the percentage of the world’s population living in countries with higher and lower increase in life expectancy than China in 1960-2017 excluding China.
The social impact of China’s increase in life expectancy
This fact that China’s increase in life expectancy exceeded that of almost all other countries, and far exceed that of all other major countries, is itself a decisive vindication of the superiority of China’s socialist path of development. There are today literally hundreds of millions of people in China alive because of China’s far superior performance in increasing life expectancy. But in addition to this direct effect on China itself this overwhelming comparison is also is decisive in deciding other issues.
The claim made in rabid anti-China Western media that the people of China live in ‘misery’ is entirely laughable – the life expectancy data shows the Chinese people have experienced a greater improvement in their overall social conditions than countries representing over 99% of the world’s population.
The claim that China has pursued economic development at the expense of its people is evidently untrue. On the contrary, as seen, China’s increase in life expectancy is superior to all except 0.8% of world’s population excluding China.
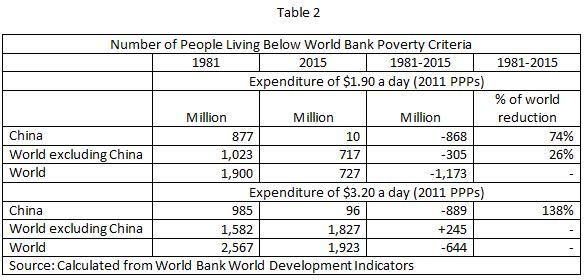
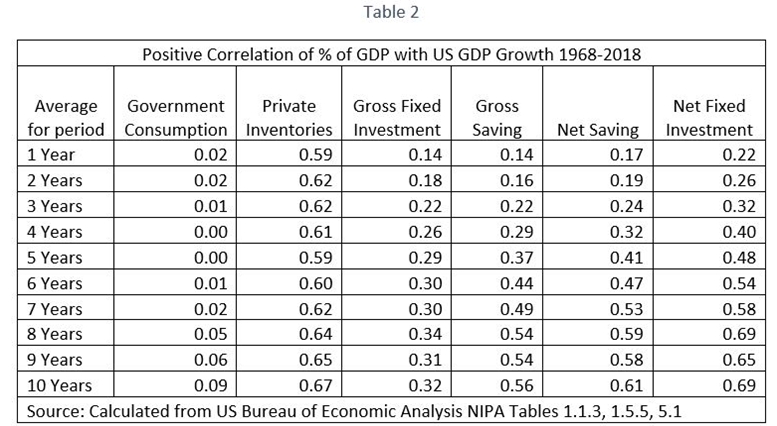
It is well known that China’s achievement in world poverty reduction is completely unequalled – as is confirmed by the latest World Bank data shown in Table 2. Taking the World Banks’ extreme poverty criteria of expenditure of $1.90 a day, measured in 2011 PPPs, China was responsible for 74% of the reduction in the number of people in the world living below this level of poverty in 1981-2015 (the latter year being the latest available data). Taking the alternative, slightly higher, World Bank criteria of poverty of expenditure of $3.20 a day, measured in 2011 PPPs, China was responsible for 138% of the reduction in the number of the people in the world living at this level of poverty – i.e. the number living below this level in China fell by 889 million while in the rest of the world it increased by 245 million. But while data for poverty shows the improvement in life conditions for the poorest in society, the data for life expectancy are, of course, an average – with the dramatic increase showing that the improvement in China’s social conditions applied to the overwhelming majority of China’s population.
Having established the overall framework of the development of China’s life expectancy the light this throws on resolving some specific issues of controversy will now be analysed in more detail
China in 1949
As a starting point for analysis it is crucial to understand China’s position in 1949. After more than a century of foreign invasions China was almost the world’s poorest country. Systematic international data does not exist for 1949, which was the last year of China’s civil war, but it does for 1950 – the PRC’s first year of peace. This will therefore be taken as the comparative starting point for analysis.
Of systematic international analyses that have been made, Maddison, former head of statistics of the OECD and the world’s most renowned analyst of long term growth, concludes that in 1950 only 10 countries in the world had a lower per capita GDP than China – two in Asia (Myanmar and Mongolia), eight in Africa (Botswana, Burundi, Ethiopia, Guinea, Guinea Bissau, Lesotho, Malawi, Tanzania). The Conference Board, using a slightly different method of analysis, concludes that only six countries in the world in 1950 had a lower per capita GDP than China – two in Asia (Cambodia, Myanmar), four in Africa (Burkina Faso, Ethiopia, Malawi and Mozambique). On Maddison’s data, in 1950 only 2.4% of the world population lived in countries with a lower per capita GDP than China. These detailed differences in conclusions are clearly entirely insignificant compared to the overall finding. At its starting point the PRC was established in a country which was almost the world’s poorest.
As would be expected, China’s extreme poverty in 1949 was reflected in very low life expectancy. As already noted, comprehensive comparative World Bank data on life expectancy is not available for 1950, it begins in 1960. However, the most relevant comparison is to India, which with China is the other largest developing country. This is because India is the only country comparable in size to China in terms of population, because India achieved independence from Britain in 1947 at almost the same time as the creation of the PRC, and because India’s life expectancy at that time was close to China’s. Studying not only the 1950-1960 period but also the pre-1978 reform period in China’s history compared to India therefore casts a clear light on numerous issues.
In 1947, the year India achieved independence, its life expectancy was 32. China’s life expectancy in 1949, the year of the creation of the People’s Republic of China, was 35 – a gap of three years compared to India. By 1978, the last year of pre-reform China, China’s life expectancy was 67 and India’s 55 – a gap of 12 years. This is shown in Figure 3.
This sharply growing difference was not because India had a bad record – as an increase of 22 years in life expectancy over a 31-year period graphically shows. It is simply that China’s performance was sensational – life expectancy increasing by 32 years in a 29-year chronological period. This means that in pre-reform China life expectancy increased by more than a year for every chronological year that passed – an annual average increase of 2.3%.

To understand the true scale of such an achievement in comparative terms, it need simply be noted that China’s rate of increase of life expectancy in the three decades after 1949 was the fastest ever recorded in a major country in human history. For comparison:
- The US in the thirty years after 1880, a period of sharp increase due to recovery from the Civil War, saw a 0.9% annual increase in life expectancy.
- Life expectancy in the UK after 1871, a period of rapid growth, was under 1.0% a year.
- Japan, a country considered to have an outstanding record in increasing life expectancy, and enjoying a rapid increase due to recovery from World War II, raised life expectancy by 1.3% a year in the 29 years after 1947.
China’s 2.3% increase in life expectancy in 1949-78, therefore, far outperformed all these countries whose records, by normal standards, are considered exceptional.
When did life expectancy increase?
The period in which this spectacular increase in life expectancy was concentrated is highly interesting and casts a strong light on debates concerning the continuity of the PRC’s development – and in particular shows clearly the falsity of ‘historical nihilism’, the claim that trends in China only became favourable after 1978. During the 1950s China made very creditable progress – life expectancy increasing by an average of slightly over nine months in each chronological year. India’s performance in this period was comparable – between 1947 and 1960 its life expectancy increased by slightly less than nine months for each chronological year. India continued this progress in the period up to 1978, with life expectancy rising by slightly under nine months for each chronological year. But after the 1950s China’s life expectancy began to rise extremely rapidly. Between 1960 and 1970 China’s life expectancy increased by a dramatic one year and nine months per chronological year. Over the entire period 1960-78 China’s life expectancy grew by an average one year and three months per chronological year.
This spectacular, indeed historically unprecedented, social achievement during 1949-78 does not overturn any analysis of economic developments in this period, nor of political judgements concerning the Great Leap Forward and Cultural Revolution. But it shows clearly that attempts to present the pre-1978 period in an overall negative social light, as ‘historical nihilism’, and as represented in the West by a series of books attempting to present pre- reform China as socially disastrous, is, to put it straightforwardly, a blatant falsification. In the 27 years between the establishment of the People’s Republic of China in 1949, and the death of Mao Zedong in 1976, life expectancy in China increased by 31 years – or over a year per chronological year. In comparison, in the 27 years after India’s independence average life expectancy increased by 19 years. Far from being negative, China’s record in this period was one of history’s most extraordinary social achievements.
Instead of engaging in factual falsification and myth making, foreigners can more accurately understand the support for Mao Zedong in China, even leaving aside other issues, such as the achievement of real national independence, merely by the lived experience of this fact. If someone leads you to live an extra 31 years it is unsurprising you hold them in esteem!
Historical accuracy certainly means clearly noting that China’s economic growth was superior after 1978, but this should not lead to underestimation of the astonishing social achievements of the preceding pre-reform period. Xi Jinping put it precisely on these two periods of China’s post-1949 development, that is from 1949-1978 and 1978 to the present:
The two phases – at once related to and distinct from each other – are both pragmatic explorations in building socialism. … Although the two historical phases are very different in their guiding thoughts, principles, policies, and practical work, they are by no means separated from or opposed to each other. We should neither negate the pre- reform-and-opening-up phase in comparison with the post-reform-and -opening-up phase, nor the converse.
Systematic international comparison
While India is the most relevant single comparison for China there could be an accusation that it is selectively chosen. From 1960 onwards however, as already noted, such an accusation cannot be made as systematic World Bank data exits and leaves no doubt as to China’s performance. It is therefore useful to expand further on the overall results after 1960 noted above.
Due to China’s very low starting point in life expectancy in 1949, by 1960, despite the progress made in the 1950s, it was still the case that 55% of the world’s population lived in countries with a higher life expectancy than China and only 23% in countries with a lower life expectancy than China. The astonishing transformation is that by 2017, due to the very rapid increase in China’s life expectancy, only 19% of the world’s population lived in countries with a higher left expectancy than China and 62% of the world’s population lived in countries with a lower life expectancy than China. This is shown in Figure 4
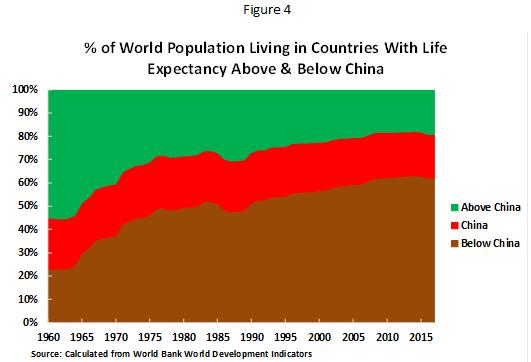
To understand the significance of this still more clearly, it may be noted that in 2018 only 15.6% of the world’s population lived in countries which were high income, that is advanced, economies by World Bank classification. Therefore, less than 4% of the world’s population lived in developing countries with a longer life expectancy than China – out of 84% of the world’s population which lives in developing countries. In short, from being one of the world’s poorest countries in 1949, with a low life expectancy, in 1949 China has already achieved a longer life expectancy than almost all every other developing economy.
The increase in human well-being and real human rights which is reflected in those simple figures is truly staggering – precisely because average life expectancy is the best overall indicator of overall social and living conditions. It means the Chinese people, almost one fifth of humanity, has enjoyed by far the greatest improvement in social conditions, reflected in their average life expectancy, of any major country in the world. Literally over a billion people have enjoyed a greater improvement in their standards of life than that by any other means. It precisely means that Marxism in China has delivered its promise, made in 1949, that its programme and methods would achieve the national rejuvenation of China in a way superior to any alternative. The facts show that what was a promise in 1949 was delivered as a reality in the 70 years that followed.
Conclusion
In conclusion, the fact that after 1949 China’s increase in life expectancy outperformed any other major country is of course of the greatest significance to China’s people – it shows the unparalleled increase in living and social conditions that has occurred due to China’s socialist path. But it also decisively settles a number of other issues.
- Those in who apologize for capitalism are simply wrong – it is clear China’s socialist path has achieved a greater improvement in overall living conditions, reflected in the increase in life expectancy, than any capitalist path of development over the last 70 years.
- Attempts to essentially counterpose the two periods of development of the PRC, between 1949-78 and 1978-2019, are wrong. The fundamental task in both periods was to ‘serve the people’, to achieve ‘people centred development’ – which was successful achieved as shown in the sharp increase in life expectancy in both periods.
- The theory of ‘historical nihilism’, the claim that China’s development prior to 1978 was negative is the purest nonsense. Economic growth was faster after 1978 but the increase in life expectancy, reflecting the overall improvement in social conditions, in 1949-78 was unparalleled in human history. Therefore, the attacks made on Mao Zedong in the West simply mean that those making them cannot accurately understand China or understand its dynamic. The period of Mao Zedong saw an increase in life expectancy which was unparalleled in human history – which in no way contradicts negative judgements on the Great Leap Forward or the Cultural Revolution. What is involved is the overall course of China during the Mao period, which the data on life expectancy proves saw an unprecedented step forward in the overall social conditions of the China people. By denying the facts of this reality the West, among other things, renders itself incapable of understanding China and its dynamics.
- The facts on the development of life expectancy in China since the founding of the PRC confirm in a single decisive and verifiable figure that the CPC delivered on its promise that its socialist methods and programme would be superior for the rejuvenation of China to any other method. They show that the improvement in the conditions of the Chinese people since 1949 is the greatest ever achieved in a major country in a 70-year period in the whole of human history.
These are the fundamental facts of the truly staggering scale of China’s ‘social miracle’ during the last 70 years.

Recent Comments