
yesTestJohn Rosshttps://www.blogger.com/profile/08908982031768337864noreply@blogger.com0
Uncategorized
Greek myths retold
Greek myths retoldBy Michael Burke
The world economy is not strong and the President of the United States is sufficiently concerned about new shocks to it that he recently met the Greek Finance Minister to urge ‘flexibility on all sides’ in the negotiations between the Syriza-led government and its creditors. US concern is fully justified.
In any attempt to reach agreement it is important both to have an objective assessment of the situation and to understand the perspective of those on the opposite side of the table. In Mythology that blocks progress in Greece Martin Wolf, the chief economics commentator for the Financial Times argues that negotiations to date are dominated by myths. He demolishes some of these key myths in turn: that a Greek exit would make the Eurozone stronger, that it would make Greece stronger, that Greece caused the crisis driven by private sector lending, that there has been no effort by Greeks to repay these debts, that Greece has the capacity to repay them, and that defaulting on the debts necessarily entails leaving the Eurozone.
Together, these provide a useful corrective to the propaganda emanating from the Eurogroup of Finance Ministers and ECB Board members. Some if this is slanderous, in repeating myths about ‘lazy Greeks’ (who have among the longest working hours in Europe). Much of it is delusional, based on the notion that Greece can be forced to pay up, or forced out of the Euro without any negative consequences for the meandering European or the world economy.
Austerity ideology
The genuine belief in a false idea, or a demonstrably false system of ideas constitutes an ideology in the strict meaning of that word. Inconvenient facts are relegated in importance or distorted, and secondary or inconsequential matters are magnified. Logical contortions become the norm.
All these are prevalent in the dominant ideology in economics, which is supplemented by another key weapon, the helpful forecast. In Britain for example, supporters of austerity argued it would not hurt growth and the deficit would fall. Now there is finally a recovery of sorts, they argue austerity worked, ignoring all the preceding five years and the unsustainable nature of the current recovery (and the limited progress in reducing the deficit).
For Greece the much more severe austerity and its consequences means that supporters are still obliged to rely on the helpful forecast to support their case. The Martin Wolf piece includes a chart of IMF data on Greek government debt as a percentage of GDP, which is reproduced in Fig.1 below.
The IMF includes not only data recorded in previous years but its own projections for future years. From a government debt level of 176% of GDP in 2014, the IMF forecasts a fall to 174% this year and 171% in 2016 and much sharper declines in future years. The IMF has also forecast an imminent decline in Greek government debt ever since austerity was first imposed in 2010, which has not materialised.
Fig. 1 Greek Government Debt, % GDP & IMF Projections

However, the most recent data released by the Greek statistical service Elstat shows that Greek government debt rose once more (pdf) at the end of 2014 to stand at €317bn. The total debt was €9bn higher in 2014 than 2013, whereas the IMF forecast is effectively flat. Worse, as the Greek economy is still contracting the debt as a proportion of GDP will be rising sharply, not falling as officially projected.
In the course of 10 years the Greek government debt level has effectively doubled as a proportion of GDP close to 180%. Most of this took place while austerity was being implemented. The unavoidable verdict is that the debt burden is unstainable and that austerity will only increase it.
To date the Syriza-led government has met all its obligations to creditors but this clearly cannot go on for very long. It is possible that it may prefer to default on the ECB, which can in the end simply print the money (as with its Quantiative Easing programme, but from which it currently excludes Greece).
Defaulting on the IMF is perhaps more politically difficult, as its Board would have to convene a meeting of all shareholders. €3.46bn is due to the ECB on July 20.
But a default is necessary and inevitable. The authors of the Maastricht Treaty thought that anything more than debt level equal to 60% of GDP was dangerous. Then this would provide an appropriate target for Greek debt reduction.
Investment flows
In the Martin Wolf piece he also suggests that debt reduction should occur “after the completion of reforms”. This is mistaken. ‘Reform’ in the context of the negotiations is a synonym for deregulation, privatisation, attacks on workers’ rights and living standards. This has already been tried and failed. It is a myth that too many Greek regulations, or too much state ownership, or workers fighting for better pay and pensions is the cause of the crisis. All those were in place in 2003 and 2004 when real GDP in Greece grew by 6.6% and 5% respectively.
One myth that hardly needs to be dealt with any longer is that the crisis was caused by imbalances within the Eurozone current accounts (the balance of trade plus overseas interest payments). For a period this became a key explanation of the crisis (pdf) in the official ideology. It has been largely abandoned as all the crisis countries have swung into surpluses. Greece now has a current account surplus because imports have slumped and so remains in crisis.
A common feature of the crisis countries is that they were beset by huge inflows of private sector capital seeking returns, primarily through speculation in property and housing. It was when these private sector inflows dried up and reversed that the crisis became apparent. Until austerity was imposed in 2010 the fall in Greek GDP due the recession was almost exactly the same as in Germany or in Britain, a fall of approximately 4.75% in all cases.
The austerity policy and the ratings’ agencies induced panic had the effect of driving capital flows back from the ‘periphery’ to the ‘core’ countries. Ferocious austerity in Greece and the other crisis countries meant that private sector banks withdrew capital and repatriated it to the key banking centres of Europe: Britain, German, the Netherlands and France.
These private sector speculative flows were destabilising in both directions. They caused both the boom and the bust in Greece and elsewhere. A solution based on reviving these flows, with the inducement of ‘reform’ can only end in renewed destabilisation and crisis. The desperation of these private sector investors is demonstrated by the fact that, for most industrialised countries currently (excepting Greece) borrowing rates are close to zero as unutilised capital seeks a return.
Structural adjustment
The Greek economy needs structural adjustment. For the ideologues of austerity this is a synonym for wage cuts. But Greek finance minister Yannis Varoufakis is right, cutting wages even further will have no effect on improving Greek competitiveness in key industries, “we are not going to be competitive with Mercedes-Benz and Toyota, simply because we don’t make cars.”
The structural adjustment needed is to increase the productive capacity of the Greek economy. This requires productive investment on a large scale. Prior to the crisis the EU did provide some transfers of funds for investment, as well as current transfers in the form of the Common Agriculture Policy and other funds (which is why the anti-austerity parties and most voters in the crisis countries are not anti-EU). However, these were on an insufficiently large scale and were in any event overwhelmed by the private sector inflows which were primarily directed towards construction and housing.
Worse, the EU has cut its funding for investment as the crisis has deepened. This has exacerbated the private sector withdrawal of capital and is an important factor in prolonging the crisis. Fig.2 below shows the levels of investment from the EU and the different forms of investment from the private sector, both total investment (Gross Fixed Capital Formation) and productive investment, which excludes housing.
Fig.2 Investment in Greece & Selected Components, % GDP

All types of investment have fallen as a proportion of GDP during the crisis. But it was the EU’s declining contribution which led the way. In addition, the real cuts in investment are flattered in this comparison as GDP itself was falling. In 2006 productive investment from the EU to Greece amounted to €4.7bn. In the depth of the crisis in 2012 it had been cut to €1.6bn.
This is a punitive measure and is entirely contradictory to the objective needs of the Greek economy. All properly functioning single currency areas require significant fiscal transfers in order to be sustainable. This follows from the fact that all regions or countries in a monetary union are subject to very similar monetary conditions (official interest rates, exchange rates, and so on) yet have very different levels of productivity. Those levels of productivity will diverge to a crisis point unless there are sufficient fiscal transfers to compensate. If the fiscal transfers are sufficiently large and well-directed, they can even compress or reverse the divergence in productivity. Currently, the policy of the Troika is to lay siege to the government in Athens in an attempt to starve it into submission.
As a result, the Greek economy is at that crisis point. It requires very large fiscal transfers otherwise it will diverge out of the Eurozone. This is in addition to the requirement for a very substantial debt write-off already noted. Even then, very strong government and supranational measures would be required to direct the inevitable revival of private sector investment that would inevitably follow a large increase in (supranational) public sector investment. The public sector must begin to direct large-scale investment.
Martin Wolf is quite right to attempt to disabuse the ideologues of austerity of their Greek myths. There is no prospect of an end to the crisis without very substantial debt reduction. It is also reckless bravado to claim that only Greece would be hit by a forced exit from the Euro. But even debt reduction is insufficient to end the crisis, and further ‘reforms’ would only deepen it. Very large fiscal transfers to pay for a structural upgrade of the Greek economy are necessary.
The biggest beneficiaries of the EU are the big firms and banks in the leading EU economies. They need to start paying for this benefit or they will lose it.
Tories’ ‘Right to Buy’ housing plan will deepen the housing crisis
Tories’ ‘Right to Buy’ housing plan will deepen the housing crisisBy Michael Burke
The Tory manifesto election pledge to make housing associations sell their homes at a discount and force local authorities to sell off some of their best stock has been widely condemned by the associations themselves and by housing experts. The government has set aside £1 billion to fund the discount available to the new ‘right-to-buy’ owners and will demand that the housing associations build replacement homes, which do not have to meet affordability criteria. The net new money available for homebuilding is therefore just £1 billion.
Using average construction cost estimates from the National Association of Home Builders of £150,000 per home, this equates to just 6,600 homes. Very few or none may be affordable.
The idea of bribing a tiny number of housing association tenants (and some of the few remaining local authority ones) with public money to become owner-occupiers is part of the policy of privilege to bolster the Tory election campaign. But since the majority of these homes tend rapidly to become part of the private rented sector it will also exacerbate the growing inequality and unaffordability of housing.
It does nothing to address the housing shortage in Britain, which is both chronic and in many parts of the country acute. Fig.1 below shows the level of both new ‘social rent’ housing and total affordable homes from 1991 to 2014. It is necessary to include at least these two categories in order to indicate some general trends as the government has changed the definitions of many categories of housing with the effect of obscuring to wider picture.
Fig.1 Social Rent and Total Affordable new homes

To give an indication of how grossly inadequate this is, the number of (loosely-defined) new affordable homes of all types was just under 43,000 last year and compares to 1.368 million households on local authority housing waiting lists in England alone.
The recent peak level for annual new affordable homes was just over 60,000 and was inherited by this government from the previous Labour government. The official projection of new household formation over the next 25 years is an average 210,000 per year (pdf). While not all of these households will want or need social or affordable housing, the majority will. Therefore the current pace of home building is completely inadequate to meet the additional projected demand. It will do nothing to address the backlog on waiting lists and the housing crisis will deepen.
There are many addition costs to the housing crisis simply beyond the extremes of unaffordability. These include the miseries of overcrowded and substandard housing, the increasing transfers of household incomes to landlords and the distortions to wider society, including the workforce. The much-discussed ‘productivity puzzle’ (pdf) is much less baffling when it is noted that under this government the rise in real estate jobs has far outstripped the rise in construction jobs, as shown in Fig. 2 below.
Fig. 2 Change construction and real estate jobs under the current government

Solutions to the housing crisis
Labour has adopted a policy of aiming for 200,000 new homes per year by the end of the next parliament. This would come close to meeting the projected rate of new household formation. This would also have the effect of moderating the rise in house prices. But it would be unlikely to reverse it, especially as the housing shortfall as indicated by local authority waiting lists would have increase to beyond 1.75 million for Britain as a whole in the meantime.
One of the many myths surrounding government policy is that the state is not intervening in the economy. The reality is the opposite. There are innumerable ways in which this government and its predecessors intervene in ‘the markets’, with costs running into the hundreds of billions of pounds. The bank bailout was only the most spectacular example.
In the housing sector this government has intervened repeatedly in order to boost prices without ever boosting the construction of new affordable homes, which has decreased. Perhaps the most notorious of these schemes is the £40 billion ‘Help to Buy’ policy which uses public funds to boost private property prices which were already excessive.
A radical step that the next Labour government could take is to use this same £40 billion guarantee and offer it to local authorities to build new homes. The first 20% of (unlikely) local authorities’ losses on construction of affordable homes could be guaranteed using these funds. At the same time, government could borrow to increase the funds available for construction.
The arithmetic of borrowing to invest in new public affordable housing is simple and compelling. A 5% rental income on a £150,000 home amounts to £625 per month. A 3% yield requires just £375 per month. Yet the government can now borrow at well below even 3%. It would make money on its housing investment, which could be used for investment in other areas, all of which would see the deficit fall as a consequence. Housing affordability (and quality) would improve and job-creation switch from estate agency towards building.
The big losers from a radical policy would be private landlords who no longer benefit from the upward spiral of house prices and the large ‘house builders’, the companies who do not build homes but sit on undeveloped land banks and count the paper profits of the increasing land and home values.
Shifting the burden of the crisis onto workers and the poor
Shifting the burden of the crisis onto workers and the poorBy Michael Burke
There is an old joke, not a very good one, that the definition of a consultant is someone who you pay to tell the time who then asks to borrow your watch. Osbornomics, the specific variant of austerity economics that operates in Britain is similar.
The British economic ‘recovery’ is the centrepiece of the Tory election campaign and has been blessed by the IMF as a model. But the recovery is entirely fake. On some of the most important measures of average living standards the economy has at best stagnated over 5 years, on others they have fallen. The majority of the population has seen their real living standards decrease. The Tory election slogan should be, “You’ll never have it so good again”.
The essential con-trick of Osbornomics can be illustrated in one chart, Fig. 1 below. This shows the household savings ratio, the proportion of savings relative to household incomes.
Fig.1 Household savings ratio

The Tory-led government came to office when the household savings ratio was 10.9%. In the final quarter of 2014 it had fallen to 5.9%. The ‘recovery’ is essentially driven by this fall in household savings, which is equivalent to approximately 3.75% of GDP. But, as already noted real living standards have not been rising. The household sector has been running down savings in order to finance consumption. This is the epitome of British boom-bust cycles since the Second World War, although formerly there was at least some increase in living standards for a period. This promises to be a boom-bust cycle without the preceding boom.
Debt and deficit obsession
The run-down in household savings highlights a key fallacy of government policy, which it claims is focused on reducing government deficits and debt. In Western Europe the entire economic debate is dominated by the distraction of government finances. In most of the rest of the world, and this means overwhelmingly in countries that are growing more strongly than Western Europe or Britain economic policy debate centres on the issues of growth. This is not only true in fast-growing Asia and Africa, but also in the more sluggish Americas, including in the US where growth rates have been stronger than Western Europe since the recession began, and yet remain feeble by historical comparison.
In Britain, to the limited extent that government deficits have been reduced, as the economy has been stagnant government deficit-reduction has relied on increasing borrowing elsewhere, among households. This illustrates a general truth. Savings and lending must equal each other (aside from money stuffed under the mattress or similar hoarding). All borrowing/lending is a transaction which creates both an asset and a liability; a lender and a borrower.
In common with other Western European countries, Britain’s programme to reduce its government deficit has relied on reducing the savings/increasing the borrowing of the household sector. But in the mainstream economics textbooks a normally functioning industrialised economy is supposed to include a household sector that is acting as a net saver (for big purchases, for retirement and so on). It is the business sector which is supposed to borrow to supplement its own profits in order to invest. In fact, it is this process which is mediated through the banks and which its supporters claim is the uniquely positive attribute of capitalism. Relying on falling household savings to finance consumption cannot lead to increased productivity and is inherently unsustainable.
Fig. 2 below shows the saving and borrowing of three key institutional sectors, the government (blue line), private non-financial corporations (PNFCs, red line) and households (green line) from 1997 to 2014.
Fig.2 UK Institutional Sector Accounts

Over a prolonged period and well before the 2008 to 2009 recession businesses (PNFCs) have not been performing their allotted role. Businesses have been savers. The pre-recession boom was financed by a run-down in household savings. As PNFCs started to increase their savings once more at the end of 2006 the government began to borrow. It was only after this period, in late 2008 when the recession had already begun that households sharply reverted to their allotted role and increased their savings once more. Because both the business and the household sector were now significant savers, the government was obliged to increase its borrowing.
The austerity policy attempts to address this imbalance by decreasing the government’s borrowing by cutting its spending and increasing its income. It does this by forcing a reduced saving of households, through raising VAT, cutting social security benefit, cutting disability benefits, public sector pay and pensions and so on. At the same time it has lavished funds on the private sector businesses (cutting corporate taxes, privatisations, and so on) in order to increase their incomes (profits) and eventually to increase their spending and borrowing.
Economically this policy has failed. The government deficit remains stubbornly high and both living standards and GDP are stagnant. Most importantly the austerity to date has failed in its central purpose which is to revive the profitability of British companies, which is the only conceivable basis on which they could be willing to increase investment. Fig.3 below shows the trend in the profit share of UK companies since 1995. At most the policy of austerity has stabilised the decline in profitability and prevented a further fall. But this is very far from a recovery in profits (and even further from a recovery in the profit rate) which would lead to an autonomous rise in private sector investment.
Fig.3 UK Profit share

Austerity back on the agenda
For a combination of economic and political reasons the Coalition government stopped implementing new austerity measures midway through the current Parliament. SEB identified this at the time, and now it has become a rather more commonplace analysis. It was this halt to new austerity measures combined with the effects of Quantitative Easing and other government measures to boost consumption which have led to the unsustainable upturn in economic activity.
But a faltering economy and plunging Tory opinion poll ratings meant that the drive to push down the savings rate of households also had to be suspended. With the government attempting to lower its own borrowing and businesses showing little sign of investing rather than saving profits, the necessary savings had to come from another source. This was the ‘Rest of the World’ (RoW) sector in the national accounts, which is overseas investors.
For ease of presentation borrowing from the RoW was not shown in Fig. 2 above. But given that the savings of both the household and PNFCs sectors have been static in the recent period, it is worth illustrating just the growing dependence on borrowing from overseas and the government deficit in Fig. 4 below.
Fig. 4 Sectoral Accounts; Government borrowing and Rest of World saving

The business expansion before the recession was in part financed by increased overseas borrowing (red line). At the end of 2007 the level of government borrowing in the final quarter was almost exactly equal to the level of savings by the Rest of the World. But the effect of the recession was to decrease consumption financed by borrowing from overseas. In the 2nd quarter of 2011 the level of borrowing from overseas was less than £1bn even though government borrowing in the same quarter was almost £32bn. The savings then were supplied by both the households and PNFCs (as shown in Fig.2).
Since that time the quarterly level of government borrowing has fallen by £13.5bn and the level of borrowing from overseas has increased by approximately £24.5bn. It is this increased borrowing from the RoW which has allowed the government deficit to fall while there has also been a simultaneous modest upturn in investment and consumption.
This is unsustainable. At a certain point the demand for overseas savings exceeds the willingness of overseas investors to lend. The British economy is increasingly dependent on borrowing from overseas and when there is a sudden withdrawal of funds living standards in Britain will fall dramatically once more. Traditionally in Britain this has been accomplished by a ‘balance of payments crisis’ and now more usually relies on a fall in the pound.
It is therefore completely ridiculous for Tory supporters, or the head of the IMF, to claim that Britain’s recovery offers a model. The world cannot increase its borrowing to finance consumption from another planet. It is not even sustainable in Britain.
The requirement to increase private companies’ profitability is the fundamental driving force behind the proposed resumption of austerity after the general election. It is quite possible too that there will be a renewed crisis to accompany it at a certain point, with overseas investors unwilling to continue financing an increase in British consumption, unsupported by an increase in production or investment.
Economic failure, austerity continues
.678ZEconomic failure, austerity continuesBy Michael Burke
The Tory election campaign is based on the claimed success of the government’s economic policy, as the hype around the latest Budget confirms. In reality the Tories’ economic record has been unprecedentedly poor. Their economic policy is not primarily aimed at increasing growth or prosperity but rather at effecting a fundamental change in the economy which entails a very large transfer of incomes from workers and the poor to big business and the rich. This project is very far from complete and is set to continue.
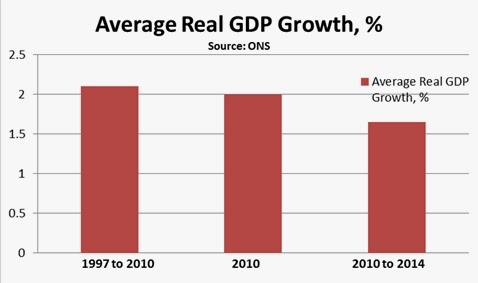
The relative economic performance under the current government is shown in Fig.1 below. Real GDP has grown by an average of 1.65% under austerity policies. This is remarkably poor by comparison. In the 12 months before the current government took office the economy grew by 2%. Austerity lowered growth even from a feeble pace coming out of recession.
For the entire period from 1997 to 2010 the annual average real GDP growth rate was 2.1%. This includes the recession of 2008 to 2009, the deepest slump in activity since the Great Depression. Yet the performance of the economy under Tory austerity has been even worse
Fig.1 Comparative Real GDP Growth
Einstein said repeating an experiment and expecting a different outcome is the definition of madness. Yet the intention is to repeat austerity. This is because the purpose of the austerity of policy is not to induce growth, or even to cut the deficit.
In the crisis profits fell sharply, even in nominal terms. The Gross Operating Surplus (GOS) was £86.2bn in the 1st quarter of 2008 and fell to £79bn in the 2nd quarter of 2009. At the same time the Compensation of Employees (CoE) fell by just £1.5bn (although in real terms both wages and profits fell by far greater amounts). Since that time and to the end of 2014 the GOS has risen by £16bn and the CoE has risen by £32bn. It should be noted that profits fell once more in the final quarter of 2014, as shown in Fig.2 below.
Fig.2 Wages and Profits
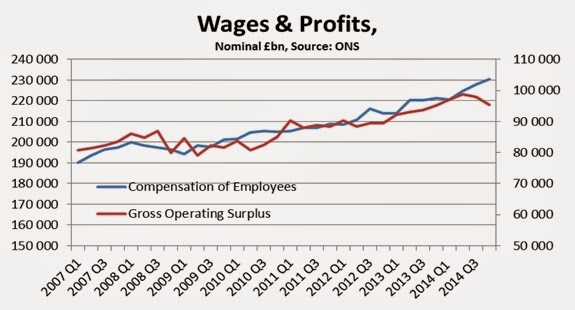
CoE on LHS GOS on RHS
Despite the fierce impositions of austerity it has proven quite difficult to cut wages in nominal terms (although in real terms wages have fallen substantially). New austerity measures were also suspended after 2011 because of the slump in Tory electoral fortunes. Therefore the plan is to resume austerity with renewed intensity immediately after the election. Austerity is aimed at reviving the profit rate and this is nowhere near being accomplished.
Austerity did not even cut the deficit
.493ZAusterity did not even cut the deficitBy Michael Burke
The Coalition parties are set to feature deficit reduction as a central achievement of their time in office as part of the election campaign.
The economic crisis is driven by the excessive saving of the private sector – its refusal to invest. As the government’s deficit is a response to this private sector saving, cutting the government’s own spending is entirely the wrong approach. It is the weakness of the economy that has caused the deficit, not vice versa. The supporters of austerity look at the world through the wrong end of the telescope and demand we all do the same.
It is also the case that the Coalition has failed even in its own terms. The deficit has not been eliminated. The total deficit (excluding the effect of the public sector banks, that is their bailout) was £153.5bn in 2010 and had fallen only to £93.6bn in 2014. The deficit is far from being eliminated.
The discrepancy between the actual deficit and the forecasts made by the Office for Budget Responsibility (OBR) and the Treasury at the time of the June 2010 Budget is shown in Fig.1 below. The official forecast was that the deficit would be £60bn in the last Financial Year and would fall to £37bn in the current Financial Year ending in April 2015. The actual deficit has been very different.
It was £97bn last year and will be an estimated £90bn in the current FY. The government claimed it would reduce annual borrowing by £117bn and the fall has been just £63bn, approximately half of what was promised.
Fig.1 Official forecasts for the deficit and the actual outturn

In addition the composition of the deficit belies any claim that austerity has led to an improvement in public finances. In reality a combination of accounting fiddles, reduced investment and inflation more than account for the entire reduction in the deficit to date. None of these are supposed to be part of the central design of austerity policies and none can be relied on to sustainably lower the deficit. This is the case when the entire debate about economic policy in the next five years is framed around even more austerity.
Investment, inflation and accounting fiddles
The factors reducing the deficit should be taken in order of magnitude. By far the biggest contribution to the £60bn reduction in the deficit has been the rise in VAT receipts, which have increased by £44bn over the period or by approximately two-thirds of the total deficit-reduction. The Coalition increased the VAT rate from 17.5% to 20%, but consumer prices have also risen by 12% in the 4 years to 2014. This implies that the contribution from increased VAT rates and inflation were approximately equal. Inflation has since subsided sharply and unless the pound falls again is unlikely to accelerate again in the near future.
Despite great fanfare from Osborne and Cameron on the need for investment, there has been no policy action that has made a larger contributor to the fall in the deficit than the cut in government investment. This is shown in Fig. 2 below. In total the fall in net public sector investment from 2010 to 2014 was £25.6bn. Even mainstream Tory opinion nods in the direction of the need for increased public investment and only the most extreme ideologues explicitly argue for cuts in this area. Even so this is the policy which has been carried out to massage the total deficit lower. It is also in the clear hope that the private sector will replace public investment, which has failed to take place.
Fig.2 Public Sector net investment

There have also been a number of accounting adjustments and outright fiddles which George Osborne has conducted in order to get the deficit numbers down and further measures of this type may be expected in the Budget later this month. Perhaps the most scandalous was the £5 billion ‘pencilled in’ from an amnesty for tax evaders agreed with the Swiss authorities which has yielded little more than £1bn. But the most substantial of these fiddles is the £8.7bn in 2014 (and £18.6bn in 2013) from the Bank of England’ s ‘Asset Purchase Facility’ which are part of the wind-down of bank rescue operations and nothing to do with current public sector income.
In other key items of revenue there are some important features. National Insurance Contributions have risen by 11% and £11bn reflecting the growth of employment during austerity. But the level of PAYE income tax has risen by just 5.9% (£7.7bn) as average pay has fallen and there has been no increase at all in the tax revenue on self-assessed income (mainly from the self-employed), despite more than half a million new ‘self-employed’ over the period. This confirms the trend of low-wage, casual job creation.
It should also be noted that Corporation Tax revenues which are levied on profits have actually fallen by £0.5bn over 4 years despite a £67bn rise in nominal profits. This reflects the cut in the tax rate from 28% to 21% which will further fall to 20% in April. The stated purpose of this cut was to spur growth by encouraging business investment. But SEB has repeatedly noted the fall in investment is the cause of the crisis and remains the main brake on any recovery. Instead, the combination of the VAT hike and Corporation Tax cut represented the key mechanism of austerity policies as a whole; the transfer of incomes from poor to rich and from labour to capital.
Austerity was severe – it just doesn’t work as claimed
In terms of expenditure items, the total is considerably below the projection first outlined by the Treasury and Office for Budget Responsibility in June 2010. It is therefore factually incorrect to state that austerity has not been implemented, or has been not severe enough. This is a fiction peddled by right-wing critics of the government. But in June 2010 the Treasury/OBR forecast that total public sector current expenditure would be £692.7bn in 2014/15 and in December this year they forecast that the outturn would soon be £671.7bn. This is also a much tighter spending policy than was planned given that inflation was higher than anticipated. Austerity was applied even more severely than planned. It simply failed to deliver deficit-reduction.
There was also a windfall to government accounts because of much lower debt interest payments as global interest rates plummeted. The British government in common with many others now receives money from investors who are lending to it, paying negative interest rates. This lowered government outlays by £27bn comparted to 2010 forecasts.
Yet the social security bill was also £28bn higher than officially forecast. This serves to highlight a crucial point made at the time by the opponents of austerity; that cuts aren’t savings. Given that the population continues to both increase and age irrespective of fiscal policy, it was always certain that outlays would grow. As austerity also leads to both slower growth and increased poverty then key items such as social security will grow automatically.
By contrast the sole significant item of government expenditure which has seen a fall in cash terms is transfers to local government, which has produced both widespread hardship and increased likelihood of local government bankruptcies.
The change to total Public Sector current Expenditure and the two key components of higher social security and lower debt interest payments are shown in Fig.3 below.
Fig. 3 Change from OBR Forecast to 2014/15 to total Public Sector Current Expenditure and key components, £bn

Conclusion
Austerity damaged the economy austerity and did not even lead to deficit reduction. The deficit has fallen due to growth – that itself has been stifled by austerity.
However this nominal growth has been much more comprised of inflation than real activity. This has created a one-off boost to VAT receipts, which is unlikely to be repeated. The main policy change leading to a lower overall deficit is the cut to public sector investment, which will prove highly damaging in the long run. That aside, the Chancellor largely relies on accounting tricks to massage the deficit lower.
There has been a very substantial windfall too from the fall in debt interest payments, in common with nearly all the industrialised economies. This reflects widespread economic weakness and fears of deflation. It is not a positive sign about growth. The cuts have been even more severe than was first planned by the Coalition when inflation is taken into account. But the supporters of austerity ignore the crucial point that it creates economic weakness, which in turn leads to both higher government spending and lower tax revenues.
The real cure for the deficit and for the economy is the same. Investment-led growth will produce a sustainable increase in economic activity and under those circumstances the deficit would take care of itself.
The money exists for investment in Greece
.309ZThe money exists for investment in GreeceBy Michael Burke
The fraught negotiations between the new Greek government and representatives of the EU institutions are likely to be prolonged. They have centred to date on Syriza’s efforts to find room to alleviate some of the worst effects of austerity and address what is called the ‘humanitarian crisis’.
This is entirely justifiable given the depth of the fall in living standards with widespread malnutrition in Greece, a health crisis, hundreds of thousands of homes cut off from electricity supply and other ills.
Policies aimed at income redistribution can help in this key area, so it is entirely correct to attempt to increase tax revenue from the rich in order to ameliorate the effects of poverty on the poor. But any sustainable improvement in living standards must be based on increasing the productive capacity of the economy which requires investment. Any transfer of income will be a one-off effect if income does not grow. Yet the austerity measures imposed by the Troika (EU Commission, European Central Bank and IMF) and the existing burden of debt interest payments prevent the government from investing and provide a further disincentive for the private sector to invest of its own volition.
Domestic sources of investment
There are two key sources of funds that could be tapped for investment; domestic and international.
Domestically the Greek business class claims the highest share of national income in the whole of the OECD. In 2013 (in nominal terms) the Gross Operating Surplus of Greek firms was €102.2bn from a GDP total of €182.4bn. This profit share in GDP of 56% is way in excess of the customary levels in the OECD. By comparison the German profit share in the same year was 39.3%.
A high profit share is not itself directly harmful to growth and prosperity. If firms were investing profits the productive capacity would be rising rapidly and new high-quality and high-paid jobs could easily be created. But the opposite is the case in Greece, which also has the lowest rate of investment as a proportion of GDP in the whole of the OECD. Again in nominal terms investment (Gross Fixed Capital Formation) in Greece in 2013 was just €20.5bn or 11.3% of GDP. By comparison the German proportion of investment was 19.8%.
This is not to hold up the German economic model to be emulated. Like all the Western economies (including Britain) the rate of investment in the German economy has slowed dramatically over several decades, which is the cause of the ‘secular stagnation’ of the Western economies over the same period.
Even so, the disparity in the profit rate and the investment rate is exceptional in Greece. The proportion of uninvested profits in Germany is equivalent to 19.5% of GDP (profits equal to 39.3% of GDP minus an investment level equivalent to 19.8%). This level of uninvested profits is very high by historical standards. But the proportion of uninvested profits in Greece is 44.7% (profits of 56% of GDP minus investment of 11.3%). The nominal level of profits and investment is shown in Fig. 1 below.
Fig.1 Profits and Investment in Greece, 1990 to 2013, €billions (nominal terms)

The charge of indolence and feckless aimed at Greek workers, which is a slur repeated and not solely confined to northern European tabloid newspapers, is entirely misplaced. It is Greek capitalists who refuse to invest a vast proportion of profits who have caused both long-term low productivity growth and the relative crisis. This is true not just on a relative basis but also on a historic one. In 1990 Greek investment was equivalent to 42.8% of profits. In 2013 it was just 11.3%.
International sources of investment
A structural flaw in the Euro Area economy is that it represents an effort to create a single, continental-sized economic entity to compete with the scale of the US and Chinese economies by purely monetary means. The Euro Area has a single exchange rate and single short-term interest rate. But fiscal policy remains overwhelmingly as a national responsibility.
This is a structural flaw as all economic development is uneven. An exchange rate or interest rate policy which may be appropriate to the average will necessarily cause dislocations or worse to economies whose level of development differs significantly from the average. In all other modern economies fiscal transfers occur between regions, usually automatically via common tax and spend systems. In the United States, a federal system of taxation and transfers does not prevent individual states levying their own taxes or making transfer payments (social security, subsidies to farms, etc.). But these federal transfers amount to more than 10% of US GDP.
The EU and the Euro Area have both had fiscal transfers. These have been set through the European Social Fund, the Common Agricultural Policy and others but have usually amounted to little more than 1% of GDP. Disastrously, they have also been cut at a time of crisis, which David Cameron and others boasted as an achievement. The 7-year budgeting round has seen the 2014 to 2020 European Social Fund cut from €961bn to €367bn in nominal terms. The European Regional Development Fund will be €453bn, an increase from €347bn over the preceding period. But this does not compensate for cuts elsewhere and inflation further erodes the total. It is also widely misunderstood that big countries are also recipients of EU funds. Fig.2 below shows for example that Germany received twice as many as ESF funding as Greece over the period 2007 to 2013.
Fig. 2 National Distribution of ESF funding 2007 to 2013, € billions

Source: EU Commission
The cuts to internal transfers have taken place at the worst conjuncture, coinciding with the gravest economic conditions in Europe since the aftermath of World War II. The cuts will accelerate centrifugal tendencies with the EU and unless the trend is reversed they will be key factor in the potential of a break-up of the Euro Area.
While this is a strategic issue, which would need to be addressed by a supplementary budget, there are funds at hand which could immediately be deployed in Greece. One of the many large funding institutions sponsored by the EU is the European Investment Bank (EIB), which has ample scope to increase lending.
As part of a general trend, the EIB has not provided funds for investment that could have alleviated the crisis despite having the financial capacity to do so. Prior to the crisis in 2007 the main components of the EIB’s balance sheet were capital of €35bn and borrowing of €276bn. From this it had made outstanding loans of €285bn. By 2013 the bank’s capital had increased substantially but the growth of its loan portfolio has lagged significantly.
Table1. Key components of EIB’s balance sheet, €bn

Source: Author’s calculations, EIB annual reports and accounts
The EIB is part of an elite group of the world’s most highly-rated borrowers, with a very high capital buffer (own funds) and the explicit guarantee of all the EU governments. As a result it can borrow at extraordinarily cheap interest rates. Maintaining the same ratios as in 2007 and based on the increase in its own funds since it could raise its borrowing to €457bn and its loan portfolio to €472bn.
Given the immediate priority is reviving the Greek economy this could easily be the recipient of the extra €45bn in funds for investment that would become available. A similar pattern applies to the European Bank for Reconstruction and Development, which mainly lends to Eastern Europe (pdf). Since 2011 new investment in projects has fallen by €9bn even though bank capital has increased by €1.7bn. But funds are needed to both develop and integrate the region with the richer West and geographical reasons mean Greece should also be a key destination for that purpose.
Beyond Greece, the subscribing EU countries to both banks can now borrow at exceptionally low interest rates and earn far larger returns from the banks’ investments. Neither the EIB nor EBRD are charitable institutions. The focus for investment would be all the crisis economies of Europe East and West. But these sources of investment could also form part of the overall solution both to the investment crisis and the growing strains on the Euro Area and European Union economies.
Conclusion
There is a pressing need to address the humanitarian crisis in Greece. It remains to be seen how much breathing space Syriza’s fight can win from the EU institutions.
But sustainable growth requires investment. The trend of cutting investment and other transfers within Europe, and cuts to development lending fit with the general austerity policy across Europe of cuts to state investment which are exacerbating the private sector investment strike.
However, this not only deepens the current crisis but threatens to undermine the entire Euro and EU project from within. It is not only the Greek economy which is at stake; it is just the most extreme example of general trends.
Within Greece the key source of funds for investment are the uninvested profits of the business sector. Internationally, EIB and EBRD funds already exist for major infrastructure and other forms of investment. These should be tapped immediately to rescue the Greek economy. And much larger funds could be applied to all the crisis countries of Europe, in a win-win for them and for the key investing countries. The alternative is ongoing crisis and increased risk of Euro break-up.
The money exists for investment in Greece
.309ZThe money exists for investment in GreeceBy Michael Burke
The fraught negotiations between the new Greek government and representatives of the EU institutions are likely to be prolonged. They have centred to date on Syriza’s efforts to find room to alleviate some of the worst effects of austerity and address what is called the ‘humanitarian crisis’.
This is entirely justifiable given the depth of the fall in living standards with widespread malnutrition in Greece, a health crisis, hundreds of thousands of homes cut off from electricity supply and other ills.
Policies aimed at income redistribution can help in this key area, so it is entirely correct to attempt to increase tax revenue from the rich in order to ameliorate the effects of poverty on the poor. But any sustainable improvement in living standards must be based on increasing the productive capacity of the economy which requires investment. Any transfer of income will be a one-off effect if income does not grow. Yet the austerity measures imposed by the Troika (EU Commission, European Central Bank and IMF) and the existing burden of debt interest payments prevent the government from investing and provide a further disincentive for the private sector to invest of its own volition.
Domestic sources of investment
There are two key sources of funds that could be tapped for investment; domestic and international.
Domestically the Greek business class claims the highest share of national income in the whole of the OECD. In 2013 (in nominal terms) the Gross Operating Surplus of Greek firms was €102.2bn from a GDP total of €182.4bn. This profit share in GDP of 56% is way in excess of the customary levels in the OECD. By comparison the German profit share in the same year was 39.3%.
A high profit share is not itself directly harmful to growth and prosperity. If firms were investing profits the productive capacity would be rising rapidly and new high-quality and high-paid jobs could easily be created. But the opposite is the case in Greece, which also has the lowest rate of investment as a proportion of GDP in the whole of the OECD. Again in nominal terms investment (Gross Fixed Capital Formation) in Greece in 2013 was just €20.5bn or 11.3% of GDP. By comparison the German proportion of investment was 19.8%.
This is not to hold up the German economic model to be emulated. Like all the Western economies (including Britain) the rate of investment in the German economy has slowed dramatically over several decades, which is the cause of the ‘secular stagnation’ of the Western economies over the same period.
Even so, the disparity in the profit rate and the investment rate is exceptional in Greece. The proportion of uninvested profits in Germany is equivalent to 19.5% of GDP (profits equal to 39.3% of GDP minus an investment level equivalent to 19.8%). This level of uninvested profits is very high by historical standards. But the proportion of uninvested profits in Greece is 44.7% (profits of 56% of GDP minus investment of 11.3%). The nominal level of profits and investment is shown in Fig. 1 below.
Fig.1 Profits and Investment in Greece, 1990 to 2013, €billions (nominal terms)
The charge of indolence and feckless aimed at Greek workers, which is a slur repeated and not solely confined to northern European tabloid newspapers, is entirely misplaced. It is Greek capitalists who refuse to invest a vast proportion of profits who have caused both long-term low productivity growth and the relative crisis. This is true not just on a relative basis but also on a historic one. In 1990 Greek investment was equivalent to 42.8% of profits. In 2013 it was just 11.3%.
International sources of investment
A structural flaw in the Euro Area economy is that it represents an effort to create a single, continental-sized economic entity to compete with the scale of the US and Chinese economies by purely monetary means. The Euro Area has a single exchange rate and single short-term interest rate. But fiscal policy remains overwhelmingly as a national responsibility.
This is a structural flaw as all economic development is uneven. An exchange rate or interest rate policy which may be appropriate to the average will necessarily cause dislocations or worse to economies whose level of development differs significantly from the average. In all other modern economies fiscal transfers occur between regions, usually automatically via common tax and spend systems. In the United States, a federal system of taxation and transfers does not prevent individual states levying their own taxes or making transfer payments (social security, subsidies to farms, etc.). But these federal transfers amount to more than 10% of US GDP.
The EU and the Euro Area have both had fiscal transfers. These have been set through the European Social Fund, the Common Agricultural Policy and others but have usually amounted to little more than 1% of GDP. Disastrously, they have also been cut at a time of crisis, which David Cameron and others boasted as an achievement. The 7-year budgeting round has seen the 2014 to 2020 European Social Fund cut from €961bn to €367bn in nominal terms. The European Regional Development Fund will be €453bn, an increase from €347bn over the preceding period. But this does not compensate for cuts elsewhere and inflation further erodes the total. It is also widely misunderstood that big countries are also recipients of EU funds. Fig.2 below shows for example that Germany received twice as many as ESF funding as Greece over the period 2007 to 2013.
Fig. 2 National Distribution of ESF funding 2007 to 2013, € billions
Source: EU Commission
The cuts to internal transfers have taken place at the worst conjuncture, coinciding with the gravest economic conditions in Europe since the aftermath of World War II. The cuts will accelerate centrifugal tendencies with the EU and unless the trend is reversed they will be key factor in the potential of a break-up of the Euro Area.
While this is a strategic issue, which would need to be addressed by a supplementary budget, there are funds at hand which could immediately be deployed in Greece. One of the many large funding institutions sponsored by the EU is the European Investment Bank (EIB), which has ample scope to increase lending.
As part of a general trend, the EIB has not provided funds for investment that could have alleviated the crisis despite having the financial capacity to do so. Prior to the crisis in 2007 the main components of the EIB’s balance sheet were capital of €35bn and borrowing of €276bn. From this it had made outstanding loans of €285bn. By 2013 the bank’s capital had increased substantially but the growth of its loan portfolio has lagged significantly.
Table1. Key components of EIB’s balance sheet, €bn
Source: Author’s calculations, EIB annual reports and accounts
The EIB is part of an elite group of the world’s most highly-rated borrowers, with a very high capital buffer (own funds) and the explicit guarantee of all the EU governments. As a result it can borrow at extraordinarily cheap interest rates. Maintaining the same ratios as in 2007 and based on the increase in its own funds since it could raise its borrowing to €457bn and its loan portfolio to €472bn.
Given the immediate priority is reviving the Greek economy this could easily be the recipient of the extra €45bn in funds for investment that would become available. A similar pattern applies to the European Bank for Reconstruction and Development, which mainly lends to Eastern Europe (pdf). Since 2011 new investment in projects has fallen by €9bn even though bank capital has increased by €1.7bn. But funds are needed to both develop and integrate the region with the richer West and geographical reasons mean Greece should also be a key destination for that purpose.
Beyond Greece, the subscribing EU countries to both banks can now borrow at exceptionally low interest rates and earn far larger returns from the banks’ investments. Neither the EIB nor EBRD are charitable institutions. The focus for investment would be all the crisis economies of Europe East and West. But these sources of investment could also form part of the overall solution both to the investment crisis and the growing strains on the Euro Area and European Union economies.
Conclusion
There is a pressing need to address the humanitarian crisis in Greece. It remains to be seen how much breathing space Syriza’s fight can win from the EU institutions.
But sustainable growth requires investment. The trend of cutting investment and other transfers within Europe, and cuts to development lending fit with the general austerity policy across Europe of cuts to state investment which are exacerbating the private sector investment strike.
However, this not only deepens the current crisis but threatens to undermine the entire Euro and EU project from within. It is not only the Greek economy which is at stake; it is just the most extreme example of general trends.
Within Greece the key source of funds for investment are the uninvested profits of the business sector. Internationally, EIB and EBRD funds already exist for major infrastructure and other forms of investment. These should be tapped immediately to rescue the Greek economy. And much larger funds could be applied to all the crisis countries of Europe, in a win-win for them and for the key investing countries. The alternative is ongoing crisis and increased risk of Euro break-up.
How the austerity con works
.796ZHow the austerity con worksBy Michael Burke
‘The Austerity Con’ is the title of a recent article in the London Review of Books. It is written by a leading Keynesian economist Professor Simon-Wren Lewis, who is also a fellow of Merton College, Oxford. The article is available to non-subscribers here. It deserves to be widely read because it contains two important arguments against austerity.
The first argument nails the lie that austerity was necessary because of an immediate crisis of government funding. The second argument exposes the myth that austerity has been responsible for an improvement in government finances. Both of these arguments will be familiar to regular readers of SEB and Prof. Wren-Lewis will give them a far wider airing. Given that averting the crisis in government finances is offered by the supporters of austerity as its main justification, the title of his piece is fully justified.
However there is a difference of view among opponents of austerity about the nature of the current crisis. It is important because it underpins both the overall analytical framework and the suggested policy prescriptions. Prof. Wren-Lewis says, “The place to begin is 2009. By then the full extent of the financial crisis had become apparent.” He goes on, “The financial crisis was leading consumers and firms to spend less and save more. That made sense for individuals, but the problem was that because everyone was doing it, the total amount of demand in the economy was falling. As demand fell, firms produced less, so they reduced their workforce.”
This is not entirely accurate. Demand is comprised of two components, consumption and investment. By taking a step back to 2007 it possible to see more clearly how the crisis arose. Regarding the industrialised countries as whole grouped in the OECD it is possible to see that only one of these experienced a sharp fall. This was investment not consumption.
Fig.1 below shows the level of real GDP and its key components, consumption, investment and net exports. The data is presented in both in constant prices in constant Purchasing Power Parity exchange rates and is itemised in the box below.
Fig. 1 Real OECD GDP and components, US$ PPP trillions, OECD base year

OECD GDP & Components, US$ trillions, PPPs
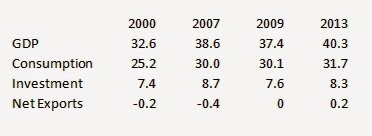
Source: OECD (data may not sum due to rounding and omissions)
By 2009 the OECD economies as a whole had experienced economic contraction compared to 2007 (the 2008 data is almost identical to 2007). But the direct contribution of falling consumption to the overall economic contraction was non-existent. It had even marginally increased.
The cause of the slump in 2009 was the decline in investment. In round terms GDP in the OECD fell by US$800billion in the two years to 2009 and investment (Gross Fixed Capital Formation) fell by US$1,100 billion. Over the same period, consumption rose fractionally.
It is the case that household consumption fell, just as Wren-Lewis says. But this was more than off-set by the simultaneous rise in government consumption. As he correctly states this was largely because of the operation of what are known in the jargon as ‘automatic stabilisers’. In economies where there exists significant provision of social security and other payments, these tend to rise automatically as unemployment increases along with in-work poverty and other aspects of social deprivation.
Yet taken together the effect of falling household consumption and rising government consumption was a small net increase in total consumption. More important than either a small net rise or fall, what is also clear is that a broadly steady level of consumption was not enough to prevent a sharp fall in investment, which was more than responsible for the entire slump across the OECD.
It is also the case that consumption in the OECD has recovered and now exceeds its pre-recession peak, but investment has not. This is not to say that ordinary households, workers and the poor have not suffered in the crisis. That is true in most countries and is at an extreme in a country such as Greece. But the decline in investment was both the cause of the economic crisis and is responsible for the weakness of the subsequent partial recovery in activity.
Furthermore, recent experience shows that increases in government consumption can at most soften the effects of the downturn (and some cost to government long-term finances, if not the apocalypse conjured up by the supporters of austerity). Rising government consumption during the crisis did not prevent the sharp fall in investment. The slump in investment cannot be corrected by ever more consumption. Consumption has risen since 2009 and is above its pre-recession peak.
The fall in investment was not only responsible for the economic crisis. It was also directly responsible for the deterioration in government finances. Falling investment is a form of saving (unwillingness to spend on investment). As the private sector of the economy increased its savings the public sector was obliged to increase its borrowing which creates the deficits on public finances.
The crisis was not caused and is not perpetuated by a fall in both the components of demand. Only investment fell and it alone has failed to recover. Analysis needs to take account of this key factor, and the policy prescriptions which flow from it. Prof. Wren-Lewis is entirely correct to highlight the ‘Austerity Con’. The biggest con is that the crisis was caused by the public sector, when it was actually caused by the refusal of the private sector to invest. This cannot be addressed by government increasing consumption, or subsidies for consumption. It needs state-led investment.
How the austerity con works
.796ZHow the austerity con worksBy Michael Burke
‘The Austerity Con’ is the title of a recent article in the London Review of Books. It is written by a leading Keynesian economist Professor Simon-Wren Lewis, who is also a fellow of Merton College, Oxford. The article is available to non-subscribers here. It deserves to be widely read because it contains two important arguments against austerity.
The first argument nails the lie that austerity was necessary because of an immediate crisis of government funding. The second argument exposes the myth that austerity has been responsible for an improvement in government finances. Both of these arguments will be familiar to regular readers of SEB and Prof. Wren-Lewis will give them a far wider airing. Given that averting the crisis in government finances is offered by the supporters of austerity as its main justification, the title of his piece is fully justified.
However there is a difference of view among opponents of austerity about the nature of the current crisis. It is important because it underpins both the overall analytical framework and the suggested policy prescriptions. Prof. Wren-Lewis says, “The place to begin is 2009. By then the full extent of the financial crisis had become apparent.” He goes on, “The financial crisis was leading consumers and firms to spend less and save more. That made sense for individuals, but the problem was that because everyone was doing it, the total amount of demand in the economy was falling. As demand fell, firms produced less, so they reduced their workforce.”
This is not entirely accurate. Demand is comprised of two components, consumption and investment. By taking a step back to 2007 it possible to see more clearly how the crisis arose. Regarding the industrialised countries as whole grouped in the OECD it is possible to see that only one of these experienced a sharp fall. This was investment not consumption.
Fig.1 below shows the level of real GDP and its key components, consumption, investment and net exports. The data is presented in both in constant prices in constant Purchasing Power Parity exchange rates and is itemised in the box below.
Fig. 1 Real OECD GDP and components, US$ PPP trillions, OECD base year
OECD GDP & Components, US$ trillions, PPPs
Source: OECD (data may not sum due to rounding and omissions)
By 2009 the OECD economies as a whole had experienced economic contraction compared to 2007 (the 2008 data is almost identical to 2007). But the direct contribution of falling consumption to the overall economic contraction was non-existent. It had even marginally increased.
The cause of the slump in 2009 was the decline in investment. In round terms GDP in the OECD fell by US$800billion in the two years to 2009 and investment (Gross Fixed Capital Formation) fell by US$1,100 billion. Over the same period, consumption rose fractionally.
It is the case that household consumption fell, just as Wren-Lewis says. But this was more than off-set by the simultaneous rise in government consumption. As he correctly states this was largely because of the operation of what are known in the jargon as ‘automatic stabilisers’. In economies where there exists significant provision of social security and other payments, these tend to rise automatically as unemployment increases along with in-work poverty and other aspects of social deprivation.
Yet taken together the effect of falling household consumption and rising government consumption was a small net increase in total consumption. More important than either a small net rise or fall, what is also clear is that a broadly steady level of consumption was not enough to prevent a sharp fall in investment, which was more than responsible for the entire slump across the OECD.
It is also the case that consumption in the OECD has recovered and now exceeds its pre-recession peak, but investment has not. This is not to say that ordinary households, workers and the poor have not suffered in the crisis. That is true in most countries and is at an extreme in a country such as Greece. But the decline in investment was both the cause of the economic crisis and is responsible for the weakness of the subsequent partial recovery in activity.
Furthermore, recent experience shows that increases in government consumption can at most soften the effects of the downturn (and some cost to government long-term finances, if not the apocalypse conjured up by the supporters of austerity). Rising government consumption during the crisis did not prevent the sharp fall in investment. The slump in investment cannot be corrected by ever more consumption. Consumption has risen since 2009 and is above its pre-recession peak.
The fall in investment was not only responsible for the economic crisis. It was also directly responsible for the deterioration in government finances. Falling investment is a form of saving (unwillingness to spend on investment). As the private sector of the economy increased its savings the public sector was obliged to increase its borrowing which creates the deficits on public finances.
The crisis was not caused and is not perpetuated by a fall in both the components of demand. Only investment fell and it alone has failed to recover. Analysis needs to take account of this key factor, and the policy prescriptions which flow from it. Prof. Wren-Lewis is entirely correct to highlight the ‘Austerity Con’. The biggest con is that the crisis was caused by the public sector, when it was actually caused by the refusal of the private sector to invest. This cannot be addressed by government increasing consumption, or subsidies for consumption. It needs state-led investment.
Recent Comments