
.649ZChina accounts for 100% of the reduction in the number of the world’s people living in poverty
By John Ross
In 2010 Professor Danny Quah, of the London School of Economics, noted: ‘In the last 3 decades, China alone has lifted more people out of extreme poverty than the rest of the world combined. Indeed, China’s ($1/day) poverty reduction of 627 million from 1981 to 2005 exceeds the total global economy’s decline in its extremely poor from 1.9 billion to 1.4 billion over the same period.’ The aim of this article is to analyse the situation taking data published three years after Quah’s analysis; look at the trends not only of extreme poverty, which the World Bank calculates using expenditure of $1.25 a day or less; examine a slightly wider poverty definition ($2 a day expenditure), and compare the trends in other regions of the world economy.
The conclusion is simple. Quah’s conclusion still holds. China is responsible for 100% of the reduction in the number of people living in poverty in the world. This finding is the necessary backdrop to any serious and informed discussion of the role of China in the world economy and its contribution to human rights.
* * *
There are many remarkable economic statistics about China.
- China contained 22% of the world’s population when its reforms began in 1978, so the percentage of the world’s population directly benefitting from China’s rapid economic growth is seven times that of the 3% of the world’s population in the US or Japan when they began rapid growth, or the 2% of the world’s population in the UK at the time of the Industrial Revolution.
- China’s 9.9% average increase in GDP per capita during the two last five year plans is the fastest economic growth per capita ever achieved by a major country in human history.
- In the same period China’s annual average 8.1% increase in household consumption, and 8.3% annual increase in total consumption, including state expenditure on items vital for quality of life such as education and health, was the fastest of any major economy. Coupled with a life expectancy above that which would be expected from China’s GDP per capita it is evident China experienced the most rapid increase in living standards of any country.
- Measured in Parity Purchasing Powers (PPPs) – that is the real increase in output in steel, cars, transport, services etc. – the greatest absolute increase in output ever recorded in single year by the US was in 1999 when it added $567 billion in output. But in 2010 China added $1,126 billion – more than twice the increase in output in a single year ever achieved by any other country in human history.
Nevertheless, impressive as such statistics are, from the point of view of human welfare it is another number which dwarfs all others: the contribution of China to the reduction of human poverty not only within its own borders but in its impact on the world. The astonishing fact remains that China has been responsible for the entire reduction in the number of people living in absolute poverty in the world!
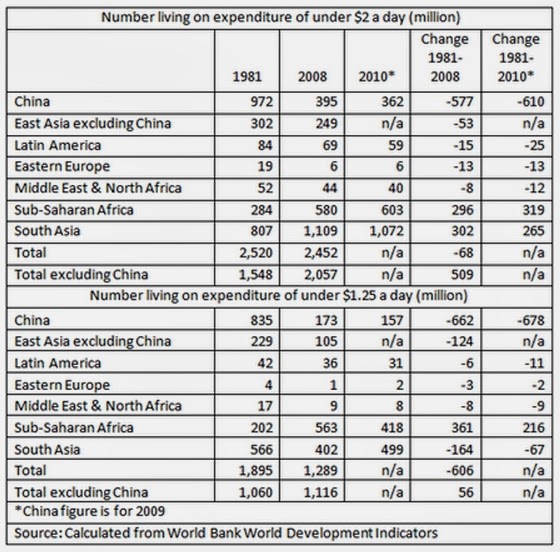
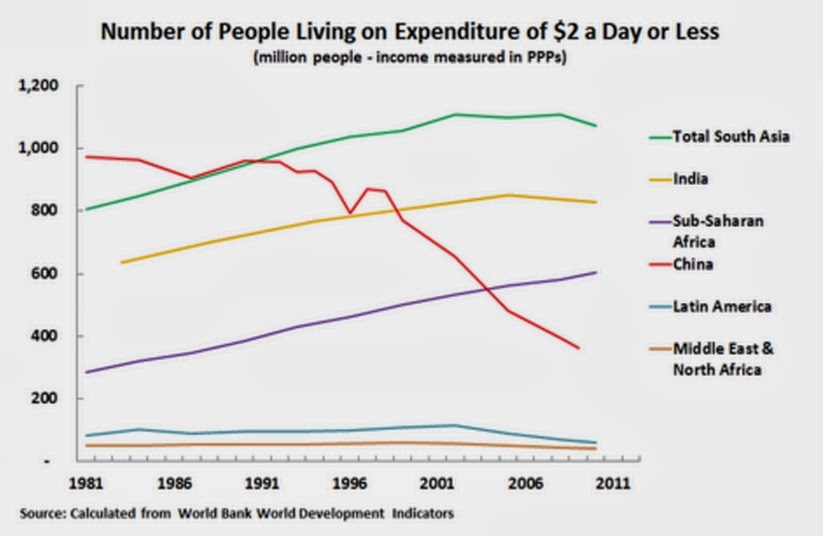
To show this the table below gives the number of those in China and the world living on expenditure less than the two standard measures used by the World Bank to measure poverty. These are the criteria for extreme poverty, expenditure of less than $1.25 a day ($37.5 a month) and those living in poverty – expenditure of $2 day ($60 a month). Charts showing the trends are at the end of the article.
In 1981, on World Bank data 972 million people in China were living on an expenditure of less than $37.50 a month. By 2008 this had been reduced to 173 million, by 2009 it fell to 157 million. Consequently 662 million people were lifted out of extreme poverty in China in the twenty seven years up to 2008 and 678 million by 2009.
In contrast the number of people living in such extreme poverty outside China increased by 50 million between 1981 and 2008 – the number of people emerging from poverty was less than the population increase. This was due to the rise in the numbe of people living in extreme poverty in sub-Saharan Africa. China was consequently responsible for 100% of the world’s reduction of the number of people living in extreme poverty.
Analysing those living on $2 a day ($60 a month), still a very low figure, the trend was even more striking. The number of people in China living on an expenditure of this figure or less fell from 972 million in 1981, to 395 million in 2008, to 362 million in 2009. The number living on expenditure of $60 a month or less in China fell by 577 million by 2008, and by 610 million by 2009.
In contrast the number of those living at this level of poverty in the world outside China rose from 1,548 million in 1981 to 2,057 million in 2008 – an increase of 509 million. Again, China accounted for the entire reduction in the number of people in the world living at this level of poverty.
It is therefore almost impossible to exaggerate what a contribution not only to its own people but to the welfare of the whole of humanity China’s economic progress has made. Without China there would have been literally no reduction in the number of world’s people living in poverty.
The gigantic impact of this on human well-being is not only in its direct effect on personal income and expenditures. It is also in its indirect consequences for human welfare. To take simple examples
- Life expectancy in China is nine years longer than in India – a country which at the end of the 1940s had a higher GDP per capita than China.
- Measured per thousand people China has 66% more nurses and midwives and 160% more doctors than India.
- In China the literacy rate for women aged 15-24 is 99%, on the latest World Bank data, while for India it is 74%.
- The infant mortality rate per 1,000 live births is 12 in China compared to 44 in India.
The direct and indirect effect of bringing people out of poverty is also the greatest contribution that can be made to human rights, The reality is that China’s bringing over 600 million out of poverty means no other country in the world remotely matches China’s contribution to human wellbeing and real human rights.

Notes
Quah, D. (2010, May). ‘The Shifting Distribution of Global Economic Activity’.Retrieved January 2, 2012, from London School of Economics: econ.lse.ac.uk/~dquah/p/2010.05-Shifting_Distribution_GEA-DQ.pdf
This article originally appeared at Key Trends in Globalisation


Recent Comments