Socialist Economic Bulletin

Norway, Switzerland or Albania?

Norway, Switzerland or Albania?By Tom O’Leary

The Brexit referendum campaign was dominated by assertions that the UK economy could benefit from access to or participation in the EU single market while opting out of the conditions on Freedom of Movement for workers. These assertions are false. This was continued during the strange Tory leadership contest, which had more casualties than debates, and has been repeated by the new Prime Minister and some of her key allies. This is a reactionary myth, with the potential to do great harm to the economy.
The former Justice Secretary and chair of the official Leave campaign Michael Gove dropped a bombshell in the Brexit campaign that not only would the UK be leaving the EU, which was on the ballot, but that a Leave vote meant we would be departing the single market too, which was not on the ballot. Gove made this highly damaging pledge because he followed the logic of the two official campaigns, which had been fought primarily on the terrain of anti-immigration. He understood that there was no realistic possibility of restricting Freedom of Movement (FoM) for workers while remaining inside the single market. 
Like Farage, Gove was effectively choosing impoverishment and lower immigration over prosperity and higher immigration. It was largely dismissed with derision, as Gove said the model would not be Norway’s or Switzerland’s relations with the EU, but those of Albania. All three countries are outside the EU. But Switzerland and Norway are part of the single market whereas Albania is not. Switzerland and Norway both have to accept all the conditions of access to the single market including Freedom of Movement (and pay far higher per capital contributions to the EU Budget than the UK does).
Elsewhere, confusion on the relationship between the single market and Freedom of Movement continues to dominate public discussion on this topic post-referendum. It is also in danger of infecting the debate inside the labour movement. For both reasons, it is necessary to set out the correct position:
  •  Under current circumstances and for the foreseeable future membership of the EU single market is crucial to the prosperity of the UK economy; living standards will fall outside it
  • The Freedom of Movement is a fundamental pillar of the single market, not an add-on or trade-off with it
  • In both cases, the single market and its Freedom of Movement component raise living standards in this country greater than they would otherwise be
  • The notion that it is possible to negotiate with the EU to access the single market while restricting Freedom of Movement (FoM) is false. It is unacceptable to the EU as a whole.

The nature of a market
A market allows the exchange of commodities. Any capitalist economy is a market on a grander scale, a series of interlocking markets. This exchange allows for what Adam Smith called the division of labour. Marx’s more precise term was the socialisation of production. This is the most powerful force in economic development. Adam Smith’s ‘Wealth of Nations’ was devoted to the outworkings of the division of labour. For Marx, the socialisation of production is the economic base of socialism.
To illustrate this point, no-one reading this piece on a laptop or a phone built that laptop or phone themselves. In a modern economy even the technology we have come to take for granted relies on a vast array of inputs of basic goods, different stages in the production process and an army of hundreds of thousands of workers to produce those goods, to develop, refine, market, transport, sell and service them and their various components. This army and this production process takes place across continents. Adam Smith argued it would take an enormous time for a single labourer to create just one pin from scratch. It would take an eternity to create a laptop from one individual’s labour.
Of course, the exchange of commodities in the market is unequal. The owners of the means of production can claim for themselves a huge proportion of the value created by the labour of others (which is one of the arguments for the common ownership of the means of production). But the benefits of the division of labour/socialisation of production cannot take place at all without the exchange that a market allows.
So too is the exchange between countries unequal. Many economies, most of them former colonies were unable to develop domestic industry before the whole world was already dominated by huge multinational enterprises. They often need to restrict access to their markets in order to develop domestic industry. This is a trade-off as costs are higher and technology necessarily poorer. But it is entirely legitimate for an oppressed country to take this detour so that is can later enter the world market. Britain is not an oppressed country.
In both cases, the optimal rate of development is ultimately produced by fully participating in the division of labour/socialisation of production. But because markets allocate resources on the basis of profit, not human needs, the optimal rate of development of the economy is when the market is allowed to fly freely within the iron cage of the state.
Continental-sized economies
The superiority of the capitalist system over its predecessors lay largely in its ability to harness the productive capacity of the whole economy and raise it up to a higher level. This was initiated on the basis of the nation-state, which necessitated in most countries sweeping away feudal domains, princes and kings, as well as their laws and restrictions on all the factors of production to create a single market. Those factors of production are goods, capital and labour. But as soon as feudalism was overthrown and supplanted by capitalism, most classically in the case of the Britain, production began to penetrate overseas markets. Capitalism necessarily created modern nations and immediately began to operate internationally.
In the modern era, entire economies are being organised on a continental basis and integrating into the world economy through that medium. The growth rate of trade within those continents is growing far faster than their external trade. North America, China and the EU are continental-sized economies. India may soon join them and it is to be hoped that so too will Latin America and Africa.
Irrespective of it size, to develop the potential of any market there must be free movement, distribution and exchange of commodities within that market. One of those commodities is labour. It would be impossible to imagine, say, a properly functioning market to build houses where bricks, wood, slates and so on could be freely exchanged, and builders were free to borrow to pay for them, but labour was excluded. The whole economy includes all sectors and construction serves here as just one illustrative sector. Freedom of movement of labour is integral to the optimal function of any market.
The EU Single Market
It is widely understood that the EU single market is vital to the maintenance of living standards in the UK. Even most of the Leave campaign leaders still want access to the single market. The greatest vulnerability in the current crisis is unlikely to be trade, even though new tariffs are likely to raise prices and cut exports to a certain degree. The bigger negative response is likely to be felt in terms of investment.
All large-scale firms operating internationally, wherever they are located, achieve market position and dominance by directing their activities towards the largest possible market, the UK’s vote to retreat from the EU will deter some proportion of large-scale investment, either by firms based in Britain or firms who might otherwise have invested here. Unless there were radically different economic policies where the state directs the bulk of investment, which is not on off in a country like Britain, then any economy dependent mainly on private investment will suffer outside the single market.
The EU and all its major component economies and political parties are committed to the operation of the single market including the Freedom of Movement. However they rationalise this, it derives from an understanding that they too would suffer economically if the single market were broken up. They are committed to FoM as an integral part of the single market for the same reason. Quite literally, it is only Little Englandism which opposes free movement.
Therefore the notion that effective membership of the single market can be achieved while restricting free movement of workers is a fantasy. It is a reactionary fantasy because it implies that FoM is a negative factor, unlike the movement of goods, capital and firms. Michael Gove recognised the unreality of being in the single market and promising to cut immigration, and so opted for the Albanian model. The EU cannot adopt that model, or allow others to while accessing the single market. Every train, lorry, car and van crossing borders would need to be opened to check whether the driver and passengers had the right to reside in the country.
Now that the Tory party has done its blood-letting, at least for now, its Brexit negotiations will be obliged to return to the real world.
It is imperative that the Labour Party stands for policies that will raise the living standards of the population. In that context, this means committing to membership of the single market and of course the free movement of movement of workers that makes it possible.  

Theory of under-consumption cannot explain the current crisis

Theory of under-consumption cannot explain the current crisisBy Michael Burke

Incorrect ideas usually reflect a one-sidedness or distorted analysis of a problem, reflecting one or a limited series of factors rather than encompassing the totality of all important factors, their proper weight and their inter-connection. So, the theorists of the Medieval church who insisted that the Sun and the planets revolved around the Earth could point every morning to the dawn and every evening to the sunset. The Earth was the centre of the Universe. Famously, what they could not explain is why Jupiter’s moons revolved around Jupiter or later, more prosaically, why a tall ship disappears gradually beyond the horizon, its tallest mast disappearing last. The theory explained one phenomenon but could not withstand new evidence.

The theory of under-consumption is espoused across a variety of schools of thought, in mainstream economics as well as by some of those describing themselves as either Keynesians or Marxists. It bears the same relation to scientific analysis as the ideas of the Medieval church do to astronomy. This is meant in a strict sense. Under-consumption can be used explain one or more phenomena, but cannot explain an all-encompassing crisis such as the current slump. It does not stand up to the evidence.

In a ‘normal’ or average business cycle downturn it might appear that some combination of household or government spending, or private sector investment or exports start to fall more or less simultaneously and GDP as a whole weakens. (Very often, behind the apparent widespread downturn is the leading role of falling business investment, but that can be set aside here). Some change in fiscal or monetary policy, increased government spending, lower interest rates, or a lower currency and so on may off-set the slump, ‘demand’ recovers and expansion resumes across all sectors of the economy.

But under-consumption cannot explain this crisis (or severe downturns in general). This is shown in a stylised account of the current crisis of the British economy using annual data. Fig.1 below shows the level of GDP, Consumption and Investment in real terms from 2007 to 2015. The data table is shown below for clarity.

The pre-recession peak of activity was in 2007. From that point to the low-point of the slump in 2009 GDP fell by £77 billion. Over the same period Consumption fell by £29 billion and Investment fell by £50 billion. Even though Investment is a far smaller component of total expenditure it fell by far more than Consumption. It was an Investment-led slump.

UK Real GDP, Consumption and Investment, £mn
 

The period since has been the weakest economic recovery on record. Annual GDP only surpassed the 2007 level in 2013. Over that time GDP rose by £34 billion while Consumption rose by £20 billion. But Investment was still the main brake on the recovery, down £31 billion from its peak level.

The most recent data to 2015 show GDP has increasd by £124 billion from 2007. Consumption has risen by £92 billion. But Investment has not recovered, being less than £1 billion higher in 2015 than in 2007. Worse, Investment has begun to contract once more in the latest two quarters. Therefore a GDP increase of £124 billion and a Consumption increase of £92 billion has led to zero increase in Investment, which is now declining.

Consumption has risen in the UK economy since the slump. But Investment has not. The theory of under-consumption, with the policy prescription that boosting Consumption will itself lead to a recovery in Investment has been demonstrated as false. The same pattern is true in the US and the Eurozone economies. Consumption is higher but Investment is flat or lower.

This is because private sector Investment is not determined by the level of Consumption but by profitablity. Without a rise in profits, private investment will not rise. Therefore it falls to the public sector to Invest, or wait until the private sector businesses graciously deign to invest once they see fit, perhaps destroying existing factories and offices and jobs first in order to recover profitability.

All theory is supposed to be able to explain the world. The theory of under-consumption cannot explain the world and the actual performance of the most advanced industrialised economies since the crisis. The theory is demonstrably false and should be junked.

Tory economic policy: “Welcome to Slumsville”

Tory economic policy: “Welcome to Slumsville”By Michael Burke

In what is probably a desperate attempt to stay politically relevant Chancellor George Osborne has announced a ‘5-point plan’ the centre-piece of which is an undated intention to cut the Corporation Tax rate to 15%. This is justified in terms of attracting investment to off-set the shock of the Brexit referendum outcome. It will do nothing of the sort. The effect will be to reduce further the funds available for public sector investment. As this deepens the investment crisis of the UK economy Osborne’s claim that this cut signifies that ‘Britain is open for business’ is false. Instead it indicates ‘welcome to a low tax, low investment Slumsville’.

Emergency measures to boost investment are almost certainly needed in the wake of the Brexit vote. Private sector investment was already in recession (two quarters of contraction) before the vote. As investment is the most volatile component of output it is likely that the first and most damaging effect of the shock will be further sharp reductions in private sector investment. But it is a myth that investment increases with reductions in Corporation Tax, as proved by Britain’s own recent history

SEB has previously shown that repeated cuts to the level of Corporate Tax (on profits) have not led to an increase investment at all. This is illustrated in Fig.1 below which shows the level of the CT rate and business investment as a proportion of GDP.

Fig.1 UK Corporate Tax Rate and Business Investment, % GDP
 

The highest levels of business investment in this period were when the CT rate was at 30%, close to its highs. After the slump business investment staged a weak recovery from 2009 onwards while the tax rate was unchanged. But repeated cuts to the tax on profits under Tory governments saw business investment stall. As noted above business investment has begun to contract once more even while the CT rate is at its low.

This should not be surprising. Business investment is driven by returns or profits. If Company X makes profits of £1 million and pays a 30% CT rate then the net profits will be £700,000 and it may be attractive to invest further. But if the same Company X makes profits of £500,000 and pays just a 20% CT rate of its net profits are just £400,000. This may be too low to attract investment.

Private investment is driven by returns not tax rates. Otherwise, Bulgaria, with a 10% CT rate would be one of the high investment economies in Europe with commensurately high living standards and Germany with a 29.65% CT rate would be one of the low investment economies with low living standards. The opposite is the case.

But the effect of the CT rate cut is worse than neutral. The UK Treasury works with the assumption that each 1% cut in the CT rate reduced Government revenues by £2 billion. Table 1 below shows the level of CT revenues by year.

Table 1. Corporate Tax revenues 2006 to 2015, £bn
Source: ONS
 
In 2006 the CT rate was 30% and the CT revenue was £50.9 billion. Therefore the taxable profits in that year were £169.7bn. In 2015 the CT rate was 20% and the CT revenue was £44.9 billion. Therefore the taxable profits in the year were £224.5 billion. Over the period profits rose by £54.8 billion yet the tax revenues from those profits fell by £6 billion.

Just as lower tax rates have failed to lead to any improvement in the level of business investment, restoring the CT rate would not lead to a slump in investment. If the CT rate had been maintained at 30% the revenues on the level of profits recorded in 2015 would have been £67.3 billion, or £22.4 billion more than actually recorded. A 10% cut in the CT rate led a £22.4 billion decline in revenues, slightly worse than but overall in line with the Treasury model.

With these additional Government revenues it would have been possible to fund very extensive public sector investment programmes. These would generate high-skilled and highly-paid jobs, boosting the level of economic activity and productivity. The projects themselves could be taken from the Government’s own National Infrastructure Plan, about which there has been so much publicity and so little activity. Previous experience shows that those parts of the private sector benefiting from increased public sector investment respond with increased investment of their own. This is the road that the Government should now go down in response to the crisis, providing a public sector-led investment response to the crisis. 

But the Tories strive at every turn to reduce the role of the state, even as the banks, the housing association sector and now possibly the social care sector falls into state hands as the private sector atrophies under the crisis. Unfortunately, the Labour right in the person of Alistair Darling signed up to the Osborne fantasy ‘Emergency Budget’, which even Osborne is not so reckless to implement. This signifies complete inability to learn anything from the economic crisis of the last 9 years. 

The only significant political force which understands the need for increased public sector investment in response to the crisis is the Labour leadership under Jeremy Corbyn and John McDonnell. Yet they are under attack, it seems, not despite their correct understanding of the solution to the crisis, but because of it.

Migration is an economic benefit

Migration is an economic benefit
By Michael Burke

Migration is an economic benefit which has the potential to lift the living standards of the whole population. Unfortunately, the debate on the EU referendum has been dominated by the two official campaigns, both of whom are anti-immigration. The leaders of the Leave campaign are the more virulent of the two. This is an economic (as well as political) dead-end, which will deepen the current economic crisis rather than end it.

As human society has developed its basic economic unit has grown ever larger. Societies have moved from being based on the tribe or similar entities through estates to towns and villages and to the nation state, including barbarisms such as slavery along the way. A key contributor to these successive developments has been the movement of goods and people as well as capital. 

Capitalism developed in the city-states of northern Italy and reached its flowering first in the nation states of Holland and England, with the flow of goods, people, capital and expertise playing a decisive role in each case. It is evident that the US could not have reached the heights of becoming the world’s leading economic power with the highest standards of living of its population without migration on a vast scale, as well as the forced migration of slavery on an unprecedented industrial scale. Less widely acknowledged, it was the immigration of the Huguenots and Jews fleeing persecution in Europe, the mass migration forced by the Highland clearances, the migration-by-starvation practised by Britain in Ireland that provided the raw material, cultural links, language skills and expertise which contributed to and helped to sustain the English Industrial Revolution. 

Goods, services and above all capital itself are in now constant motion around the world. These are all among the physical manifestations of what Adam Smith called the division of labour, or what Marx called the socialisation of production. That is, the production process itself becomes ever more complex and intricate, requiring ever-greater specialisation in ever-larger marketplaces across national borders in order to increase efficiency and so maximise profits. A key contradiction is that capitalism has become a global system while still resting on the nation-state. 

The advocates of restricting freedom of movement within the EU such as Cameron, or withdrawing from the EU and the single market in order to prevent it such as Gove, Johnson and Farage are literally reactionary. They attempt to oppose a process of migration which has been present since the dawn of humanity and which has increased as human society has progressed. They wish to resolve this contradiction by going backwards. A nostalgic and unfeasible version of the nation-state takes precedence over the actual development of society and the economy. 

Four Freedoms

The European single market is built on ‘Four freedoms’, the freedom of movement of goods, of companies, of capital and of workers to move across borders within that market. The reactionaries wish to limit the freedom of just one of those, the movement of workers. The effect would be twofold. First, the functioning of the single market would become less efficient and average prosperity would be lower as a result. The division of labour/socialisation of production would be hindered. Secondly, within the single market it would be the bargaining power of labour that would specifically decline.

Even in the heyday of rising British industrialisation there were restrictions on the freedom of movement of workers, known as the Poor Laws which kept the unemployed from seeking work outside their parish. In this way a permanent reserve army of labour was prevented from going AWOL, and kept as a permanent threat to those in work. The Poor Law legislation was only finally abolished by the progressive post-war Labour Government in 1948.

If companies and capital are free to move, but workers are not then the easiest trick for employers to pull is to say, “accept these worse terms or lower wages, otherwise we will move to A N Other country”. Tata Steel is currently deploying a variant of this, “gives us these subsidies and allow us to cut pension entitlements, or we will fold the British business”.

It would be even more reactionary to respond that these four freedoms should all be limited, precisely because it reverses the trend socialisation of production. When increasing overseas trade last gave way to national protectionism in the 1930s it led to global economic slump.

Labour share

There is a separate objection that the fruits of these freedoms, and of globalisation more generally have been disproportionately claimed by big capital, the large banks and multinational firms. But this is increasingly true of all positive economic developments as the share of national income in the advanced industrialised economies is increasingly claimed by capital, not by labour. 

But no serious commentator suggests we should abandon the benefits of mass telecommunications because of the enormous profits made by Apple, Amazon, Microsoft and so on. Returning to the pigeon post is no more sensible than restricting free movement of workers. How the benefits of economic advances are distributed is an independent matter, a product of the struggle between classes. But the working class cannot claim a greater share of these benefits if the benefits themselves have disappeared.

It is not possible to find a way out of the economic crisis by advocating policies that would deepen it, such as protectionism or restricting the freedom of movement of workers. Socialists advocate the increasing socialisation of production; greater investment, greater free education, growing trade, free movement of workers because these raise the material well-being of society as a whole, especially the material well-being of workers and their dependants. This is where the term socialism comes from.

Migrants to Britain create twice as many jobs as their proportion of the population, 14% versus 7% to 8%. They are net direct contributors to government finances of approximately £20 billion per annum, over and above anything they receive in social protection. The indirect fiscal effect is far greater, taking into account the employment creation noted above. Whatever the claims and counter-claims of the two warring Tory factions in charge of the EU ‘debate’ the truth on migration is very simple: Migration is an economic benefit.

Why Osborne fails to cut the deficit- and how John McDonnell can

Why Osborne fails to cut the deficit- and how John McDonnell can
By Michael Burke

As the UK economy is slowing once more, it is likely that the public sector deficit will begin to rise again as it did in 2012 under the impact of economic stagnation. George Osborne’s claimed target of deficit-reduction will once more recede on the horizon.

The Office for National Statistics (ONS) has recently published the data for public sector finances for the Financial Year ended in April. This shows a deficit of £76 billion, even though George Osborne (in)famously claimed he would eliminate the deficit in the previous year.

An examination of these data shows how the austerity policy has failed in its stated objective of deficit-reduction. More importantly analysis shows how the Labour plan initiated by Jeremy Corbyn and John McDonnell can regenerate the economy and thereby end the crisis in government finances.

Deficits matter

In the first instance it is important to state why public sector finances matter as there are some, even among progressive economists, who seem to believe that large scale deficits are of no consequence, or should even be permanently embraced

Deficits matter because they are a tax or lien on the public sector by the private financial sector via the bond market. So for example, because of the current crisis government interest payments have remained exceptionally low and are effectively unchanged since before the crisis at just over £30 billion per annum. At some point interest rates should recover to pre-crisis levels. Only if there is a permanent crisis will interest rates remain unaltered. Pre-crisis interest rates combined with the current trebling of the level of Government debt would see interest payments soar. These are funds that could be used for productive investment or in providing government services. Instead, there would be increased payments by governments to the financial sector which is the principal source of the outsized growth of the financial sector (pdf), which is frequently but mistakenly described as ‘financialisation’.

Outside exceptional periods, routinely borrowing via the bond market is justified only if the return to the government is greater than the initial outlay, which can only occur via investment. Under these conditions, the borrowing is used to grow the economy and, far from leading to an outsized financial sector reduces its relative weight in the economy because the productive sectors grow more rapidly led by public investment.

Osborne’s track record

To date the progress in eliminating the deficit has been painfully slow. The Tory-led Coalition came into office in May 2010, almost coinciding with the beginning of the new Financial Year. As most Government spending and revenue is determined by policies and economic trends from the preceding year, the more accurate starting-point to gauge the effect of austerity policies should be the total deficit in 2010/11, which was £137 billion. As noted above, the deficit at the end of FY 2015/16 was £76 billion. Far from eliminating the deficit in 5 years, Osborne has not even halved it.

Yet contrary to the claims of the extreme right, there have been very substantial cuts in public spending. As a proportion of GDP public sector spending has fallen from 43.9% of GDP to 38.2% in 2015/16. In relative terms this is a decline of 12% while the population has increased by 3.55% over the same period. Austerity is real.

Even so, because the economy has grown modestly and there has been inflation, the nominal level of public spending has increased from £681 billion to £716 billion. It is extremely difficult to reduce the deficit by cuts. They have to be on an enormous and devastating scale, like Greece, to achieve even very modest outcomes.

The principal factor which has led to modest deficit reduction in the UK is modest economic growth. While nominal Government outlays have risen by £35 billion to £716 billion, over the same period Government revenues have risen from £577 billion to £682 billion. If the OBR estimates of outlays and receipts are presented in real terms, adjusted for inflation the same trends are evident. Outlays have risen by £11 billion in real terms while receipts have risen by £62 billion. It is growth, not austerity which has produced deficit reduction.


Austerity and the deficit

Under Osborne, and supported by the entire Tory parliamentary party, the minimal reduction in the deficit has only occurred via growing Government receipts, which is a product of economic growth. The reason that progress has been so slow is that growth itself has been too weak.

This weakness of economic activity is a product of austerity policies. Although the cuts to investment are the least visible cuts of all, they are the most damaging to the living standards of the population over the medium-term precisely because investment raises the level of GDP. 

The most direct effect of this slow growth is on the Government current account, not on the capital account itself. This is because growth increases all types of tax revenues as more people are in better-paid jobs. In addition Government outlays fall for the same reason as unemployment benefits fall along with social protection payments for the low paid. 

The cut in the level of Government investment has produced a ‘saving’ of £16 billion in the most recent Financial Year compared to the peak level during the crisis. However the cumulative effect over 6 years of continuous cuts to investment has been to reduce the capital stock by £50 billion compared to what would have been the case if investment had been maintained at previous levels.

The direct effect of the cuts to investment on the current account includes two factors. First is the lower level of GDP simply by reducing investment, which is £16 billion. But fixed investment constitutes additions to the net capital stock, what used to familiarly be known as the means of production and the cumulative reduction under the Tories has been £50 billion. Secondly, therefore, it is also necessary to calculate the loss in production arising from this reduction in the net capital stock.
One way of estimating this loss of output is by using the Incremental Output Capital Ratio (IOCR). This is the measure of the level of the additional capital stock required to increase output by 1 unit a given year. It is calculated by dividing the capital stock by the level of annual Gross Value Added.  

According to the Office for National Statistics (ONS) the total IOCR for the net capital stock is 2.6. This means that to increase output by £1 billion in a single year it is necessary to increase the capital stock by £2.6 billion. Other estimates put the IOCR much higher, but as this is the official estimate, it will be accepted for now in the calculations below.

The reduction in the net capital stock arising from the Government’s cuts to investment amounts to £50 billion over 6 years, as noted above. If the IOCR is 2.6 then this reduction in the net capital stock reduces output in the latest year by £19 billion (50 ÷ 2.6).

Therefore the total reduction in output in the latest year is the sum of the reduction in investment (£16 billion) plus the cutback in output arising from the reduction in investment (£19 Billion). The combined effect of these two in the latest year is to reduce GDP by £35 billion. A ‘saving’ of £16 billion in Government investment has led to a total reduction in output of £35 billion in the same year.

The champions of austerity, including Osborne himself rarely talk about the actual cuts to investment that have been made by successive Tory Governments precisely for the reason that they are almost impossible to justify within any reputable economic framework. 

Fiscal impact is on the current account

As we have already noted a reduction in the level of GDP is the main cause of the fiscal deficit, while moderately higher growth has led to a moderate reduction in the deficit. It is the policy of cutting investment which is the primary cause of ongoing economic weakness and consequent inability to eliminate the deficit.

The effect of changes in GDP to changes in Government finances has been analysed previously by the UK Treasury and cited previously by SEB. Public finances and the cycle (UK Treasury Working Paper Number 5) estimates that for every £1 change in economic output, Government finances benefit by £0.75. 50 pence of that improvement arises from increased taxation revenues and 25 pence derives from automatically lower outlays. 

This is the ‘automatic stabilisers’ working in reverse; just as Government finances deteriorate in a slowdown they automatically improve in an upturn. It should be noted that the entirety of this improvement is registered in the current account in terms of both day-to-day revenues and outlays.

Returning to the current example a cut of £16 billion in Government investment has led to a reduction in GDP of £35 billion. But this also has a negative impact on the Government current account of approximately £27 billion (35 X 0.75). 

So, using official estimates, a cut of £16 billion in investment has led to a deterioration in Government finances of £27 billion, a net deterioration of £11 billion. All of this deterioration is registered in the Government’s current account, which is why it proves so intractable. Any actual deficit reduction is the combined product draconian cuts to public services, higher tax rates and very modest growth.

There are differing estimates of the ICOR for the UK economy, some much higher that the ONS estimate. This would have the statistical effect of limiting both the damage to growth and the negative impact on Government finances as a result, and cannot be dismissed. But in this piece there has been no attempt to include the spillover or ‘induced’ effects of Government investment on private sector investment, which would be an offsetting factor even if the direct damage to the economy and the public finances is overstated using official ICOR estimates. An illustration of these induced effects would be, say, if the public sector were to engage in a major house building programme then this might induce private brick makers or other producers of inputs to increase their investment.

It is easy to set the damaging effects of austerity into reverse. Jeremy Corbyn and John McDonnell have emphasized repeatedly the centrality of investment to their economic programme of regenerating the economy. For this reason, they stress that they will borrow for investment. This is exactly correct. There should be no confused or silly allegations that this is an austerity-lite programme, or similar. As shown above, their planned reduction in the current deficit naturally follows from a significant increase in public sector investment.

Staring in to the future by looking at Japan’s past

Staring in to the future by looking at Japan’s past
By Michael Burke

The G7 meeting in Tokyo ended inconclusively, with no agreement on how to lift the advanced industrialised economies out of stagnation. The venue was appropriate. It used to be commonplace to talk of a Japanese ‘lost decade’ yet the recession that generally began in the G7 and elsewhere in 2008 is now 8 years old. Without any programme to end the crisis, Western governments are following the Japanese path, with a repeat too of the failed policies of successive Japanese governments.

In reality is there has now been a lost generation in Japan. The Japanese economy has effectively stagnated for 25 years. Since the stock market and property bubbles burst in 1989, Japan’s real GDP growth has on average been well under 1% per annum. In nominal terms the economy is substantially smaller now than it was in 1997 as deflation has also taken hold of the economy, that is persistent falls in the price level.

The source of the Japanese crisis is the slump in investment. In 1990 the proportion of GDP devoted to investment (Gross Fixed Capital Formation) was 29.7%. By 2014 it had fallen to 20.3%. While GDP as a whole has crawled along since the bubbles burst, investment has fallen outright, as shown in Fig.1 below.

Fig.1 Japan Real GDP and GFCF

Yet bizarrely this has not prevented the growth of a cottage industry devoted to claims that the Japanese crisis is based on over-investment (pdf). Even more extreme is the notion that it is excessive investment by the Japanese public sector which has caused the crisis, or at least has been useless in counter-acting it. This reaches ludicrous proportions with anecdotal evidence about ‘bridges to nowhere’ substituting for economic analysis. This propaganda against public sector investment obscures a central fact- that Japan’s public sector investment, like investment as a whole, has been cut and is contributory factor in the investment-led downturn (Fig.2).

Fig.2 Japan Government GFCF as Proportion of GDP
Yet there has been no shortage of ‘stimulus packages’ by successive right-wing Japanese governments, including by the current one under Abe. One estimate is that these combined stimulus packages during the crisis amount to Yen75 trillion, well over 15% of current GDP.

However, these packages typically took the form of a stimulus to consumption. Where there was any focus on increasing investment this took the form of incentives, subsidies and outright bribes to the private sector, especially to the construction sector which is one of the main funders of the LDP and in whose interests it serves. As noted above, government investment was cut. But the private sector does not consider that increasing investment is in its own interests, which would be to increase profits.

Subsequently, these packages have been supplemented by a series of apparently ground-breaking policies including money-creation, inflation-targeting, deregulation, and currency devaluation. None of this has led a to a revival of investment. Therefore the crisis is unabated.

Could it happen here?

The Western advanced industrialised economies have nearly had a lost decade of their own, from 2008 to 2015. In all cases their growth has been weaker than the initial period of Japan’s lost decade from 1990 onwards which did not begin with outright recession. This is shown in Table 1 below.

Table 1 Selected Economies Real GDP Growth 2008 to 2015, % (national currency basis)
Source: OECD, author’s calculations
The Japanese economy did not first contract until 1998. Instead, the burst bubbles led to a sharp deceleration in the growth of GDP. The investment decline began much earlier, in 1992. For a time, the Japanese economy was able to continue growing by drawing on the fruits of previous high levels of investment.
 
The Western advanced industrialised economies, primarily the US and EU (as well as the UK) had no such luxury. They each had relatively low levels of investment before the financial crash. Compared to Japan’s investment/GDP rate of 29.7% prior to its crash, the US rate was much lower. US investment as a proportion of GDP peaked at 22.5% in 2005. For the EU (28 countries) the same peak was reached later, in 2007, confirming that the US was the source of the global Great Recession. The UK is a long-term low-investment economy and its investment rate peaked at 18.3% of GDP in 2007. 

It should be noted that in all cases the fall in investment preceded the decline in GDP, often by some years. Falling investment in all cases was therefore the main factor driving recession, led by the fall in US investment.

There is no indication to date that the industrialised economies either individually or as a group are correcting this main force driving the Great Recession and the subsequent Great Stagnation. On the contrary, in all cases the proportion of GDP devoted to investment has failed to recovery its pre-recession peak (Fig.3). Even this picture may be flattering as indications around the turn of this year were that investment is once more weakening.

 
Fig.3 Investment as Proportion of GDP in the Advanced Industrialised Countries
The G7 is considering many of the same failed options as Japan, or has already implemented some of them. It is a myth that Japan has tried increased public investment and failed. Factually, the opposite is the case. Japan cut public investment in the crisis, which deepened it. In order to get itself out of crisis the G7 would need to do the opposite by increasing public investment.

US productivity declines

US productivity declines
By Michael Burke

US productivity is set to decline for the first time in three decades, according to forecasts from the influential business research organisation the Conference Board. The level of productivity, which is the amount produced per hour of labour, is decisive for living standards. It is extremely difficult to increase the living standards of the mass of the population without increasing productivity, and impossible to do so on a sustained basis. The Conference Board is forecasting US productivity will decline in 2016.

The Financial Times quotes Bart van Ark, the Conference Board’s chief economist saying, “Last year it looked like we were entering into a productivity crisis: now we are right in it”. Fig.1 is the Conference Board chart reproduced from the FT. Rising productivity has been a feature of the US economy since the crisis of the early 1980s.

Fig. 1 Conference Board changes in US productivity -via FT
 

But the chart also shows US productivity growth has been exceptionally weak in the recovery phase since the 2008 crisis. This weakness or outright falls in productivity is a generalised feature of the advanced industrialised economies since the crisis.

The cause is easily identified. Weak productivity growth is associated with weak investment growth. Outright falls in productivity have followed declines in investment. This is the pattern evident in the US economy. Fig.2 below shows Federal Reserve Board of St Louis data on the level of real investment (Gross Fixed Capital Formation) in the US economy, which is falling.

 
Fig.2 Level of real Investment (Gross Fixed Capital Formation) in US
 
The level of productivity is expected to fall after the level of investment has already fallen. In effect, more workers will be attempting to produce goods and services with fewer machines to hand. As a result the level of that output per hour worked will decline. It is possible, for a period, to make the existing level of productive capacity work harder. But this simply accelerates the deterioration and dilapidation of that capital stock (its ‘wear and tear’) so the rate of consumption of capital exceeds the rate of investment. Net investment falls and with it the productive capacity of the economy as a whole.

Two further points are worth noting. First, the level of investment in the US economy never recovered its pre-recession peak and is now turning lower. The economic outlook is deteriorating as a result, not improving as the policy makers of the Federal Reserve Board seem to believe

Secondly, the chart clearly demonstrates that this was an investment-led downturn in the US economy. As the US led the whole world into crisis, therefore it is reasonable to state that the Great Recession was caused by the US investment decline. In the chart above the shaded area represents the period of the recession itself. Evidently investment declined long before the recession began. In fact, it was two years later that recession began, as investment peaked in the 1st quarter of 2006. As the financial crisis of 2007-2008 also followed the investment decline, the millions of words written in support of the idea that it was the financial crisis which caused the recession are factually wrong. It was the fall in investment which caused both the financial crisis and the recession.

Turning to the UK economy, a cottage industry has grown up attempting to obscure the fundamental forces driving the decline in productivity here. SEB has shown that it is the decline in investment, leading to a decline in the net capital stock which has caused the crisis of productivity here, and that all other explanations are spurious. In the words of the FT report, the UK may simply be the ‘canary in the coalmine’, its productivity decline a harbinger of what may happen to the Western economies generally.

The State of the Economy

The State of the Economy By Michael Burke

800 people packed into a recent ‘State of the Economy’ conference hosted by Shadow Chancellor John McDonnell to discuss economic trends and economic policy. This was in addition to the series of lectures that John McDonnell is hosting, with workshops at the conference allowing a more wide-ranging discussion and debate. In addition to important speeches by McDonnell himself and Jeremy Corbyn, there was a very valuable contribution from Ha Joon Chang, along the lines of his recent article in the Guardian.

SEB hopes to post videos and other material from the conference as they becomes available. Here is John McDonnell’s speech that opened the conference (video).

The piece below is based on a Powerpoint presentation at one of the workshops by the present author.

***

The UK economy remains in crisis, in contrast to the assertions of George Osborne and the supporters of austerity. The chart below compares the current slump to the Great Depression in this country and to the slump that followed the onslaught of Thatcherism (Fig.1).

Fig.1 Depressions Compared
At the end of the 1st quarter in 2016 the current crisis was 8 years old, approaching a ‘lost decade’. As the chart shows the current crisis is much worse than either the Great Depression or under Thatcher. SEB previously suggested that this slump would be “twice as bad as Thatcher”, and this judgement has proved correct.

There is no suggestion that the course of this slump will necessarily follow the earlier periods. Major events or external factors intervened. The Great Depression ended with rearmament for World War II. The Thatcher experiment was boosted by the huge windfall from North Sea oil, although the Tories created another recession after the consumption splurge of the ‘Lawson Boom.’

There can be no crystal ball about the trajectory of the economy, but it is possible to identify the key internal dynamics which determine growth. This slump and its predecessors were all led by a crisis of investment. At the same time, it is impossible for an economy to grow sustainably over the medium-term if it has a low and/or falling level of investment. This characterises the current crisis in the economy (Fig.2).

 
Fig.2 Change in GDP and its components since the crisis began
 
The economy overall remains close to stagnation, so that average living standards cannot rise. But the modest increase in GDP since the crisis is almost entirely driven by rising consumption. The combined increase in household and government consumption amounts to £84.3bn. But the rise in investment is just £5.8bn. Since the crisis the proportion of investment has amounted to just 5% of GDP. As this is below the rate of capital consumption (capital used up in production, or which dilapidates), the stock of capital in the British economy is falling. As a result the capacity for future increases in output is declining. At the same time, an inevitable consequence of growth which relies almost entirely on consumption while net investment falls is a rising trade deficit. The trade gap has widened once more to record levels even during a period of stagnation.

The key factor in this investment-led crisis is the weakness of business investment (Fig.3). There has been no recovery at all in business investment and it remains below its pre-crisis level, even though both GDP and consumption have recovered. As the chart shows, the fall in business investment preceded the decline in GDP and led the whole downturn. Business investment as a proportion of GDP has declined markedly over the period and is now falling once more in outright terms. ‘Demand’, by which is meant consumption, has not led growth.

 
Fig.3 Weakness of UK Business Investment
Source: ONS
Over time, Britain and the other advanced industrialised economies have increasingly adopted the US model of economic growth, particularly from the 1980s onwards (Fig.4). This is a model based on rising consumption as a proportion of GDP and consequently a declining proportion of GDP directed towards investment.

However, the consequence of this is plain. As consumption has risen as a proportion of GDP, the growth rate of consumption has slowed sharply. This apparent paradox relates to the sources of growth. Investment is a key input into economic growth while consumption is not. So, as consumption claims an ever-greater share of GDP and investment a diminishing share, the growth rate of the whole economy slows. Consumption then slows with it.

By contrast economies with a high and/or rising proportion of GDP directed to investment will produce higher rates of GDP growth and consumption can grow more rapidly. But this is not the US or Western model.

 
Fig.4 US Consumption share in GDP and consumption growth
 
The same trends are evident in the British economy (Fig 5.). The proportion of consumption and the growth rate of consumption in the UK are inversely correlated. As the proportion of consumption in the economy rises, the growth rate of consumption falls, and vice versa.

The US-led Western model of growth can be summarised as ‘shop till you drop’ and consumers frequently do. Slow growth economies produce flat or falling real incomes and consumption is

increasingly financed by debt, until the point at which the debt becomes unsustainable.

 
Fig.5 UK Consumption share in GDP and consumption growth
 
This fundamental economic context demonstrates why the fiscal framework set out by John McDonnell is correct. The commitment to borrow only for investment provides the optimal basis for sustainably higher rates of growth. The claims that this is austerity-lite or similar to failed Labour policies of the past are misplaced or disingenuous.

The crucial difference lies less in the specific fiscal rules than in the economic context. The entire theme of the State of the Economy conference was the need to substantially increase investment. Previous governments cut investment and adopted Tory spending plans. In those circumstances, it is only possible to balance the current spending budget by applying a brake to it. The level of government spending as a proportion of GDP was on average lower in the New Labour years than under Thatcher.

By contrast, if investment is increased the economy will grow more rapidly and consequently tax revenues will grow more rapidly. It is also likely that social welfare payments will fall as more people are in better-paid work. Both of these revenue and expenditure headings are in the Government current spending account. Increased investment will cut the current spending deficit.

The scale of problem requires this break from past economic orthodoxy in Britain. The depth of the crisis means that traditional ‘demand management’ and muddling through will not work. It may even be that ‘People’s Quantitative Easing’, that is money creation for investment purposes, is necessary.

The general rule is that the greater the increase in investment the faster the economy can sustainably grow and the more rapidly the deficit on current spending will decline, which is the basis for Labour’s economic plans. There is no sign that anything else is likely to rescue the British economy.

Slowdown is made in Downing Street

Slowdown is made in Downing StreetBy Michael Burke

It is now customary for George Osborne to blame all the ills of the British economy either on overseas economic weakness or more recently the ‘uncertainty’ over the Brexit debate. This is nonsense. The renewed economic stagnation is directly related to the policies the Tories have pursued.

The three most widely discussed symptoms of the renewed stagnation are the decline in retail sales, the widening of the trade gap and the fall in production. Of these the fall in production is the most important.  

This point may require explanation, primarily because the strength of the neoliberal counter-revolution in economics has tended to drag all other schools of thought in its direction. As a result, there is widespread confusion on these matters as if to suggest that consumption, or wages, or some other factor can lead the economy.

Marx argued (in Grundrisse and elsewhere) that,

“The conclusion we reach is not that production, distribution, exchange and consumption are identical, but that they all form the members of a totality, distinctions within a unity. Production predominates not only over itself…..but over the other moments as well. The process always returns to production to begin anew. That exchange and consumption cannot be predominant is self-evident.”

It is self-evident that exchange and consumption cannot be predominant for the simple reason that it is impossible to exchange or consume a good or service before it has been produced. It is sometimes suggested that this is only true of pre-monetary economies. An individual or a whole economy can borrow so that the level of consumption rises beyond their share of what has been distributed to them after production. Very true. But since the money borrowed has to be paid back plus interest, the borrowing amounts to a claim on future production.

Production-trade-retail sales

This fundamental point applies to analysis of the current state of the British economy. Production and manufacturing are both in recession, that is at least two consecutive quarters of declines. The trade gap has widened to record levels. But retail sales have only just begun to falter by recording falls in February and March.

Osborne and others want to claim this is a result of Brexit ‘uncertainty’. But if British-based companies were cutting back on investment this would be reflected in lower import demand for investment goods. If British consumers’ greater uncertainty led to lower consumption, then this should be reflected in lower imports of consumer goods. In both cases the trade gap would narrow.  

At the same time, there has been no crisis of ‘demand’ in the British economy, if by that is meant under-consumption. Retail sales have been far stronger than either production or exports since the recession. This is shown in Fig.1 below.

Fig. 1 Consumer demand versus output
  

Retail sales, which are primarily the key discretionary part of household consumption, have risen modestly since the beginning of the recession, up 6.5%. But output is now in its third recession in 8 years and has fallen back towards levels last seen in the depth of the Great Recession itself. It has fallen by 10%. Quite logically, if production in Britain is falling but consumption is rising, then the trade gap must grow.

To be clear, there is the same broad pattern when total consumption is taken into account, that is household discretionary and non-discretionary consumption plus government consumption. Like the rest of the economy Government has increased consumption and cut investment. The totals for consumption and investment are shown in Fig.2 below.

Fig. 2 UK Consumption and Investment
 
It is not the case there is no growth in consumption in the British economy. It is growing at a modest pace. But investment is effectively unchanged over 8 years, up by just 2%. This is the crucial weakness of the British economy, which is an extreme case of the general malaise afflicting the advanced industrialised economies.

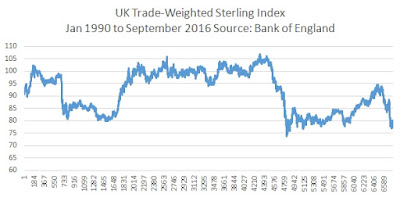
This in turn accounts for the widening trade gap. Producers based in Britain are losing market share globally and domestically. As the world economy is not far from stagnation this leads to falling output. In addition, as the growth of consumption in Britain is greater than most competitor economies, which Osborne claims as a sign of success, this leads to the growth of imports outstripping the growth of exports by some distance. This cannot be solved by devaluation. This has already been tried and failed. The pound is still 16% lower against a basket of major currencies than it was prior to the recession.

It is investment which is the source of the falling levels out output and the widening trade gap. In addition, household income growth has been weak and real wage growth almost non-existent over a prolonged period. Therefore the rise in consumption has been achieved by a rundown of savings/increase in borrowing by households. The household savings ratio has fallen to a new all-time low of 3.8% (Fig.3 below).

 
Fig. 3 Household savings ratio
 
Of course, wages cannot sustainably rise if production is falling. The squeeze on profits if businesses cannot force down wages means profits are cut and output cuts follow. This is what has happened in the steel industry, for example. Rising wages requires rising output. That can only be sustained by increasing investment.

Osbornomics and its followers

There have been two distinct phases to the Tory offensive. The first was to cut government spending, both current spending on services and capital investment. But, as both of these cause economic downturn, then government spending on social security (or other items like working tax credits) tends to rise. This is widely understood as austerity.

The second phase was purely for electoral advantage and began in earnest in the March 2013 Budget. This promoted private consumption, most obviously with policies such as ‘Help to Buy’ and other schemes. This was combined with a halt to new cuts in current spending while continuing to cut public investment. 

It is this sequence of policies combined which has brought about the current crisis. The austerity policy led to a renewed downturn in the economy and a widening public sector deficit. The austerity mark II policy led to an unsustainable rise in consumption. It also led to inflation of asset prices, especially the damaging rise in house prices. In textbook fashion, ‘demand’ for housing was increased with extra funds, without any increase in supply, that is investment in new housing.

All of those, however well-meaning who now argue for further measures to boost ‘demand’ (meaning consumption) would simply repeat Osborne’s highly damaging policy in a new form. This is the case with Adair Turner’s call for monetary financing to boost nominal demand, known as ‘helicopter money’ (pdf).

There is nothing intrinsically wrong with money creation. It is especially useful in extreme cases where the economy is slowing sharply and/or there is a risk of sustained deflation; prolonged falls in the price level. But we have already shown that the British economy is not suffering a deficiency of ‘demand’. It is once more in crisis because there is still a slump in investment.

If instead monetary measures are used primarily to boost consumption there will be a re-run in some new form of Osbornomics. This relates to a fundamental economic law. The greater proportion of output devoted to investment the higher the growth rate of the economy (and ultimately the sustainable rise in the level of consumption). The greater proportion of output devoted to consumption the slower the growth rate of the economy (and the same negative consequences for the level of consumption). You can’t shop your way to prosperity, as British consumers can once more testify.   

Monetary and fiscal measures should be aimed boosting investment. This would raise output and produce high-skill, high-wage jobs. This is in fact exactly what Jeremy Corbyn and John McDonnell have proposed. It is the sustainable way of out of renewed crisis.

RIP ‘All in it together’, buried in Panama

RIP ‘All in it together’, buried in PanamaBy Michael Burke

This Tory government, its economic and social policies and its financial scandals almost seem designed to provide illustrations of fundamental economic truths. “The history of all hitherto existing society is the history of class struggles”, famously wrote Marx and Engels in the Manifesto of the Communist Party. The Panama scandal reveals the big lie that austerity is about deficit reduction and the false mantra that ‘we are all in it together’. The entirety of government policy is an attack by one class on all its subordinates.

Whenever some Tory Minister or another announces another damaging economic policy or wholly regressive social policy and attempts to justify this in terms of a shared burden of adjustment, it can punctured by recalling just one word: Panama. ‘We’re all in it together’ has been fatally wounded.

Tory economic policies and the leaders themselves are often criticised in terms of incompetence or immorality. No doubt that these factors are present. But the same policies now in place have been pursued to different degrees before; public sector spending cuts, cuts to public sector investment, pay cuts, tax increases and benefit cuts for average and low-paid workers, tax cuts for business and the high paid, privatisations, and so on. This was the actual content of Thatcherism although it was cloaked with ‘monetarism’ and again when the pound entered the Exchange Rate Mechanism. The label changed but the policy was the same.

This policy consistency is not accidental. It represents a class interest. As a result the current government cannot be advised or implored to choose different policies. Only militant opposition combined with considered alternatives will work.

Tax haven hub

The focus of the anger has quite rightly been against David Cameron, who called tax avoidance ‘morally repugnant’ when looking for a cheap target in tax-dodging celebrities. But he is also a representative figure of the model of the British economy which his government inherited and which they are recklessly extending.

That economic model places the economy at the centre of an international hub of tax havens, with the City of London as its organisational focal point. Economic policy is aimed at promoting this international role, if necessary at the expense of other sectors of the economy. So, the departing permanent secretary to the Treasury recently told the Financial Times that steel was a ‘lame duck industry’ and should not be bailed out. This assessment clearly does not apply to the finance sector and the banks.

Table 1 below shows the level of bank liabilities (primarily deposits) in selected financial centres. They show the vast level of offshore wealth in tax havens. The data is from the latest quarterly report from the Bank for International Settlements.

Table 1. Bank Liabilities in selected centres, US$ billions
 

The US is no stranger to tax avoidance itself, although to a large extent this is done onshore, through incorporation in Delaware or Nevada. But the UK economy and its dependencies and Overseas Territories have greater bank liabilities combined than the US itself. This is not an exhaustive list, as other territories, including Gibraltar, the British Virgin Isles, Belize and others are engaged in similar schemes.

The efficient management of savings should be a positive contribution to economic prosperity, by directing savings towards the most productive areas for investment. But this is not what is happening. A global system of tax avoidance deprives countries of tax revenues that could be used to for investment or social protection or public goods. This is not just confined to Britain and the biggest victims are the populations of the Less Developed Countries.

Worse, the capital does not lie idle in the banks, offshore companies and hedge funds. It is used for speculation in financial assets, stock markets, commodities and property which further distorts economic activity, and exacerbates inequality.

The current Labour leadership has nothing to do with these rackets and has always opposed their effects. The Labour leadership can only gain from the exposure of these scandals. One of its tasks will be to formulate policies which shift the whole financial sector away from tax-dodging and speculation towards productive investment. That is a major task. But the sums involved are so large that every incremental step has the potential for a huge positive effect.