
yesTestJohn Rosshttps://www.blogger.com/profile/08908982031768337864noreply@blogger.com0
Socialist Economic Bulletin
Corbynomics and crashes: investment versus speculation
Corbynomics and crashes: investment versus speculationBy Michael Burke
Words matter. But in economic discussion as elsewhere they are frequently abused. In economic commentary one of the most frequent falsehoods is to describe speculative activity as investment. Stock market ‘investors’ are in fact engaged in speculative activity. There is no value created by this speculation. The claim made by its apologists that it provides for the efficient allocation of capital to productive enterprises is laughably untrue in light of both recent events and long-run history. In fact, a vast number of studies show that that there is an inverse correlation between the growth rate of an economy and the returns to shareholders in stock market-listed companies.
The chart below is just one example of these studies, Fig. 1. The research from the London Business School and Credit Suisse shows the long-run relationship between real stock market returns and per capital GDP growth. The better the stock market performance, the worse the growth in real GDP per capita. The two variables are inversely correlated.
The Economist found this result ‘puzzling’. But it corresponds to economic theory. The greater the proportion of capital that is diverted towards speculation and away from productive investment, the slower the growth rate will be, and the slower the growth in prosperity (per capita GDP).
Fig.1 Stock market returns and per capita GDP growth

This is exactly what has been happening in all the Western economies over a prolonged period. SEB has previously identified a declining proportion of Western firms’ profits devoted to investment. The uninvested portion of this capital does not disappear. Instead, it is held as cash in banks and the banks themselves use this to fund speculation and share buybacks by companies (which simply omits the banks as intermediaries in the speculation). The effects of this are so marked that some analysts believe ‘financialisation’ is the cause of the current crisis, when instead it is an extreme symptom of the decline in investment and the consequent growth of speculative activity.
Stock market crashes
It is now customary in the Western financial press to routinely ascribe all aspects of the Great Stagnation to some failing in China. So, China’s fractional currency devaluation has been identified as the culprit of the recent stock market plunges, even though the 3% devaluation of the Chinese RMB followed a 55% of the Japanese yen and a 27% decline in the Euro.
The claim that the crashes were caused by China’s currency move has no factual basis. Fig.2 below shows the closing level of the main US stock market index in August. The S&P 500 rose from 2,083 to 2,102 in the 4 days after the RMB’s 3.2% devaluation which finished on August 13 (first arrow).
On August 19 the Federal Open Markets Committee (FOMC) of the US central bank released the minutes of its most recent meeting (second arrow), which was widely interpreted as indicating a strong likelihood that interest rates would be increased in September. The prior closing level for the S&P500 was 2,097 and it fell sharply thereafter. Following speeches by a number of governors of the US Federal reserve (who vote on the FOMC) questioned the need for an increase in rates, and the market has recovered in response. Yet other speeches pointing once more to a rate rise led to stock market falls once more, and so on.
Fig.2 S&P500 Index
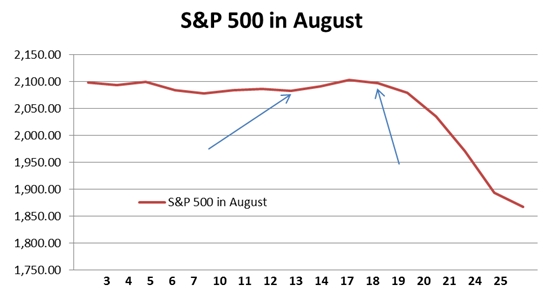
But this uncertainty over US rate increases is only the proximate cause of the crashes. This sharp fall is a stock market verdict that it cannot easily absorb higher US interest rates. The current valuations for the stock market are based on official short-term interest rates of 0.25% and a dividend yield on S&P500 stocks of 2.24%. Even if rates were only doubled to 0.5% the level of the stock market becomes much less attactive. If rates were to rise towards 2%, the risky stock market’s dividend yield looks extemely unattractive compared to risk-free short-term interest rates.
There is a spearate matter that the US economy does not look robust enough to absorb any significantly higher interest rates, but this hardly concerns stock market speculators. Fig. 3 below shows the pace of growth in US industrial production versus the same month a year ago. Production has slowed for a year and is down to a snail’s pace in the last 3 months, averaging less than 1.4% from the same period a year ago. The latest data show that the US economy is experiencing only modest growth, with GDP in the 2nd quarter just 2.6% higher than a year ago.
Fig.3 Growth In US Industrial Production

Despite the widespread hype about the British economy, the equivalent data on industrial production is growth of 1.5% for the latest 3 months compared to a year ago. For the Eurozone it is 1.2%. In China, industrial production has grown by 6.3% in the latest 3 months compared to the same period a year ago.
Corbynomics and crashes
Since 2010 the major central banks of the US, Japan, and the Eurozone have created US$4.5 trillion, Yen 200 trillion and €1.1 trillion in their respective Quantitative Easing programmes. The Bank of England has added £375bn of its own. Over the same period short-term official interest rates have been at or close to zero. Long-term interest rates have also plummeted. This has not led to a revival of investment in the advanced industrialised economies. After the short-lived stimulus in some Western economies to end the 2008-2009 slump, total fixed investment (Gross Fixed Capital Formation) has slowed to a crawl in the OECD as a whole, as shown in Fig.4 below.
Fig. 4 OECD GFCF, % change 1996 to 2013

Yet over the same period the main stock market indices in the OECD economies have soared. The stock markets and real GDP are inversely correlated. The S&P500 index has effectively doubled since 2011. The Eurofirst 300 has risen by 55%, the Nikkei 225 in Japan has risen by 125% (boosted by currency devaluation) and the FTSE100 has risen by 25% (a poorer performance held back by the predominance of weak international oil and mining stocks). Data for 2014 is not yet available but the total cumulative increased on OECD GFCF from 2011 may not have reached 10%.
Corbynomics is the policy of attempting to address an investment crisis with an increase in investment. Its critics repeatedly claim that this policy will cause financial turmoil. In light of recent events this assertion ought to cause a wry smile. At the very least, the most powerful central banks in the world have to reassess their intentions on policy simply because of the wild gyrations in the stock markets. These have been accompanied by further large movements in global currency exchange rates.
The reason stock markets are so febrile, and policy so easily blown off course is that a bubble is being created in financial assets because of the combination of monetary creation, ultra-low interest rates and weak investment. Capital that could be directed towards increasing the productive capacity of the economy is instead being used to finance speculation; the worst of both worlds. This policy has caused inflation in financial assets such stock markets, in house prices and (previously) in commodities prices. But continued economic stagnation means that deflation is now the greater risk in the OECD economies at the level of consumer prices.
Corbynomics addresses those risks because its aim is to raise the level of investment in the economy. By increasing the productive capacity of the economy through investment-led growth it overcomes the weakness of the economy. By redirecting the flow of capital from speculation towards investment, it deflates the speculative bubble. So, to take an obvious example, by building new homes it provides housing and employment while deflating the house price bubble.
The root of the objection to Corbynomics is the insistence that the private sector, private capital must be allowed to dominate the economy in its own interests. But the current Western economic model is a combination of shopping and speculation, leading to stagnation. Corbynomics is the antidote to these; prosperity through investment-led growth.
No China’s economy is not going to crash – why China has the world’s strongest macro-economic structure
No China’s economy is not going to crash – why China has the world’s strongest macro-economic structure
By John Ross
A great deal of highly inaccurate material is currently appearing in the Western media about the ‘crisis’ of China’s economy – an economy growing three times as fast as the US or Europe. This follows a long tradition of similarly inaccurate ‘crash’ material on China symbolised by Gordon Chang’s 2002 book ‘The Coming Collapse of China’.
The fundamental error of such analyses is that they do not understand why China has the world’s strongest macro-economic structure. This structure means that even if China encounters individual problems, such as the fluctuations in the share market or the current relative slowdown in industrial production, which are inevitable periodically, it possesses far stronger mechanisms to correct these than any Western economy. This article is adapted from one published in Chinese by the present author in Global Times analysing the greater strength of China’s macro-economic structure compared to either that of the West or the old ‘Soviet’ model. The original occasion of the article was the next steps in the development of China’s next 13th Five Year Plan. The analysis, however, equally explains the errors of material currently appear in the Western media.
* * *
In October a Plenary Session of China’s Communist Party (CPC) Central Committee will discuss China’s next five-year-plan. This provides a suitable opportunity to examine the reasons for China’s more rapid economic development than both the Western economies and the old Soviet system.
Taking first the facts which must be explained, China’s 37 years of ‘Reform and Opening Up’ since 1978 achieved the fastest improvement in living standards in a major country in human history. From 1978 to the latest available data real annual average inflation adjusted Chinese household consumption rose 7.7%. Annual average total consumption, including education and health, rose 8.0%. China’s average 9.8% economic growth was history’s most rapid.
As China’s ‘socialist market economy’ achieved this unmatched improvement in human living conditions it is this system which must be analysed. Its difference to both the Western and Soviet models explains why China’s economic development is more rapid than either.
China’s is a ‘socialist market economy’ – not a ‘market economy’ as is sometimes imprecisely stated utilising terminology which obscures the structural difference between China’s and Western economies.
The word ‘socialist’ derives from ‘socialised’ – large scale and socially interconnected. China’s economic structure differs from the Western in state ownership of China’s largest companies – those engaged in the most ‘socialised’ production. But simultaneously the largest part of China’s economy, as in every country, is not so large scale, socially interconnected – or state owned. China has billionaires and tens of millions of small and medium companies while China’s agriculture is based on small household farms. However the interrelation of China’s state and private companies fundamentally differs both from the West’s ‘mixed economy’ and the old Soviet system.
In a Western ‘mixed economy’ the private sector dominates. In contrast in China the CPC’s Central Committee in November 2013 explicitly reaffirmed: ‘We must unswervingly consolidate and develop the public economy, persist in the dominant position of public ownership, give full play to the leading role of the state-owned sector.’
But China’s economic structure also differs fundamentally from the old Soviet model in which the private sector was tiny – with even agriculture and local shops state run. Even in Marxist theory there was no justification for Soviet state ownership of small scale, that is non-socialised, companies and such ownership demotivated those working in them, crippling economic efficiency.
This different economic structure of China and the former USSR necessarily determines the different nature of their ‘five-year plans’. As the Soviet economy was essentially entirely state owned the state took even small economic decisions, setting tens of thousands of prices and outputs – it was an ‘administered’ economy.
The majority of China’s economy is not state owned, and China’s five-year plan sets only a few key macro-economic targets – overall growth rate, guidance on investment and consumption, industrial priorities etc. Within these parameters market mechanisms operate and are used to guide the economy. This is the precise sense in which Deng Xiaoping could state: ‘there is no fundamental contradiction between socialism and a market economy’ and ‘if we combine a planned economy with a market economy, we shall … speed up economic growth.’
But China’s macro-economic structure also explains its more rapid economic growth than the West, and avoidance of crises such as the post-2008 ‘Great Recession.’
Western dominance by private companies means no automatic mechanism ensures companies invest even when profitability is high. For example US company operating surpluses rose from 20% of its economy in 1980 to 26% in 2013, while simultaneously private fixed investment fell from 19% to 15%. As Larry Fink, the head of BlackRock, the world’s largest asset manager noted: ‘More and more corporate leaders have responded with actions that can deliver immediate returns to shareholders . . . while underinvesting in innovation, skilled workforces or essential capital expenditures necessary to sustain long-term growth.’ The US government can appeal for greater private investment but it lacks any mechanism to enforce this. Such falling investment culminated in the US ‘Great Recession.’
Western economists such as Keynes foresaw such dangers, noting: ‘the duty of ordering the current volume of investment cannot safely be left in private hands’ and that it was instead necessary to aim at: ‘a socially controlled rate of investment.’ But the Western privately dominated economy has no mechanisms to control its investment level.
In contrast, if required, China’s state owned sector can be instructed to raise or lower investment. As the Wall Street Journal noted: ‘Most economies can pull two levers to bolster growth: fiscal and monetary. China has a third option. The National Development and Reform Commission can accelerate the flow of investment.’ China therefore possesses far stronger anti-crisis mechanisms than the West.
China’s five year plans, by setting certain key economic parameters but within these using market mechanisms, explains the superiority of China’s economy to both Soviet and Western systems – and therefore China’s economic outperformance of both.
John Rosshttps://www.blogger.com/profile/08908982031768337864noreply@blogger.com0
The counter-attack on Corbynomics
The counter-attack on CorbynomicsBy Michael Burke
The economic policies of Jeremy Corbyn have come under widespread criticism. This exceeds the level of scrutiny of his policies; many of his critics do not seem to have troubled themselves to read his key policy document. It also be far exceeds the level of scrutiny devoted to any of his leadership rivals.
This is not surprising. All major sections of big business in Britain and in the western economies as a whole are committed to austerity policies. The economic consensus in favour of austerity arises not from economics textbooks or any appraisal of economic history, even recent history such as the stagnation from 2010 to 2012 and the rise in the deficit that resulted. Austerity is the consensus because it represents the interests of these dominant sections of the economy and therefore society.
This explains the assault on Corbynomics, which we should expect to intensify if he wins the leadership of the Labour Party.
Therefore it is important to address these arguments. The BBC’s economics editor Robert Peston, led the way and was closely followed by the Financial Times’ economics editor Chris Giles. Academics have weighed in, with one characteristic contribution from John Van Reenen at the LSE. There are important nuances between these and other critics of Corbynomics but they have common central arguments. All summaries are reductive and readers are encouraged to review these pieces themselves. But the central argument is this:
· the British economy is dependent on foreign capital inflows
· instructions from government to the Bank of England undermine the Bank’s independence
· the flow of international capital on which Britain depends will halt as investors take fright
· as a result, the currency will fall an interest rates will rise
· this will cause inflation and reduce investment, the very opposite of Corbynomics’ aim
· And, the existing £375bn in Quantitative Easing cannot be used as an example as this may be temporary and almost solely focused on the purchase of government bonds (gilts)
It is noteworthy that the critique begins with capital flows and rests on the absolute power of financial markets to set exchange rates and interest rates. These are real and powerful forces and cannot be ignored. But the dominance of finance capital in British society is so great it influences opinion so that the argument ‘There Is No Alternative’ appears to have great weight. The weight of this argument would be lesser in countries such as Germany, or Sweden, or even the US.
There is no denying the British economy is increasingly dependent on inflows of overseas capital, setting new lows last year. This is not simply or even primarily the chronic UK trade deficit, which has persistently oscillated around 2% of GDP in recent. As Fig.1 below shows it is the sharp deterioration in the primary income account which has caused a sharp and unsustainable rise in the current account deficit. It has swung from small surplus in mid-2013 to a deficit of 3% or more of GDP in recent quarters.
Fig. 1 Current account balance, % GDP & components
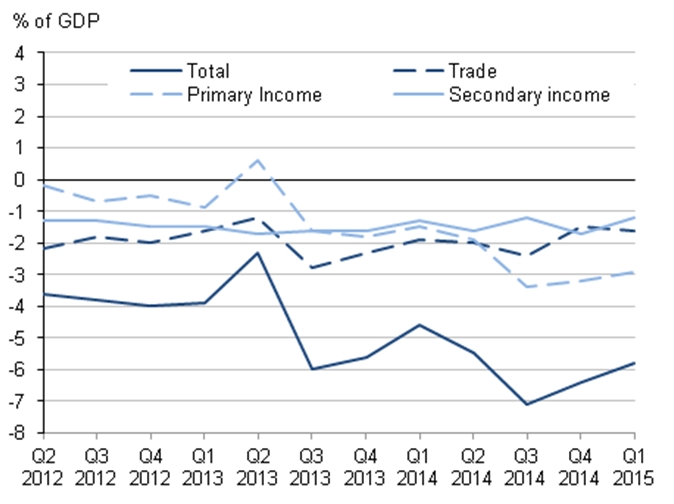
Source: ONS
The primary income account and its components is shown in Fig.2 below. There are two key points to be highlighted. The first is the very large and persistent deficit on portfolio investment, ranging between 5% and 10% of GDP. This is a net outflow of capital representing the far greater propensity of British capital to invest overseas because of higher returns.
But this persistence means that portfolio investment outflows are not responsible for the recent sharp deterioration in the primary investment account and therefore in the current account as a whole. The balance of Direct Investment has swung from a surplus to a deficit and accounts for the deterioration in the external accounts. This has taken place while corporate taxes have been cut and while the last government was claiming that ‘Britain was open for business’.
Fig.2 Primary income account and components
Source: ONS
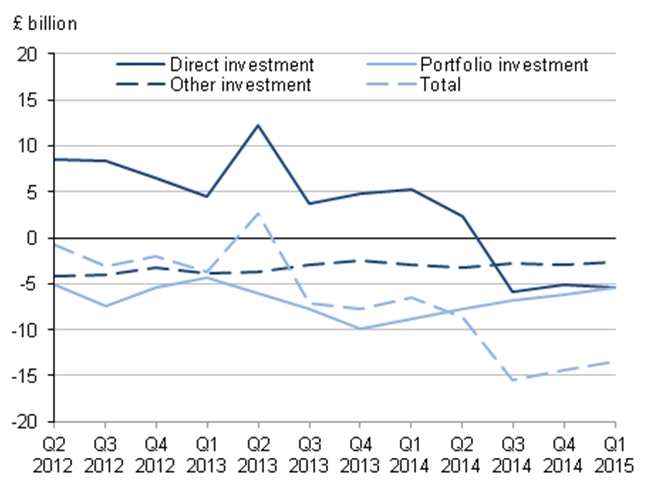
It is a remarkable fact that the government’s repeated assertions that its policies are promoting growth and investment are rarely challenged although they are so clearly false. George Osborne has repeatedly asserted that his policies are successfully promoting investment. Specifically he and his supporters have argued that the cut in Corporate Tax rates from 28% to 18% is and will promote Foreign Direct Investment. Fig.3 below shows that FDI inflows have been declining over the medium-term, even while corporate taxes have been cut and ‘business-friendly’ policies have been adopted.
Fig.3 Net FDI Inflows and components

Source: ONS
It is no accident that the sharp deterioration in the external accounts occurred in mid-2013. As SEB has shown elsewhere the Coalition government halted new austerity measures and even slightly increased government spending in order to get re-elected. Borrowing, particularly for housing and other consumption was encouraged. Unless government borrowing was to increase, or were to companies face higher taxes, then the increase in borrowing had to be sourced from overseas.
In order to get re-elected the government encouraged an unsustainable borrowing binge. It now proposes to deal with this crisis with renewed austerity, which will cause an economic crisis. Overseas investors have a diminishing appetite for investment in Britain because it is a slow-growth, low-investment economy. Low British investment levels become self-reinforcing.
The entire criticism of Corbynomics can be shown to be a case of what Freudian psychoanalysts term projection. It is the current policy which has dramatically increased the dependence of the British economy on overseas capital inflows. And the only remedy offered is renewed austerity. This is simply ‘TINA’ (there is no alternative) purportedly from the perspective of the all-powerful dealing room floors of the City.
One of the weakest points of the critique is that it rests on the outlandish proposition that the Bank of England retains credibility. The independent Bank has presided over the biggest ever financial crash in Britain and the longest recession. Throughout most of 2008 the MPC was discussing the need to raise interest rates, even as the economy had already begun its biggest slump since the 1930s. The Bank’s record on growth since independence has been markedly worse than the rest of the post-WWII period. It has also persistently missed its own inflation target. It has a spectacularly bad forecasting record for growth and inflation even in the short-term. It is even questionable how independent the Bank is on decisive matters as the bank bailout of 2008 was clearly a government plan, with Bank officials still delivering speeches about ‘moral hazard’ (pdf).
The superiority of Corbynomics
The weakness of his opponents arguments do not by themselves mean that Corbynomics can succeed. But this has been dealt with in a previous post.
Instead, it is important to state why Corbynomics is superior to the alternative, based on economic fundamentals. The critics argue that government intervention may have been a necessary evil at the time of the banking crisis (and unsurprisingly acceptable to bankers) but that government intervention in the real economy is unacceptable.
This turns economic reality on its head. The returns to productive investment in the economy are far higher than government bond yields. The rate of return for UK companies is currently around 12%, and never fell below 8% even in the depth of the recession as shown in Fig.4 below.
Fig.4 Net rate of return to Private Non-Financial Corporations, %

Source; ONS
By contrast the British government can borrow at extraordinarily low rates to fund investment, as shown in Fig.5 below. At the time of writing the yield on 10 year UK gilts is 1.8% which is a fraction of the rate of return on private investment.
Fig. 5 UK 10 year gilt yields
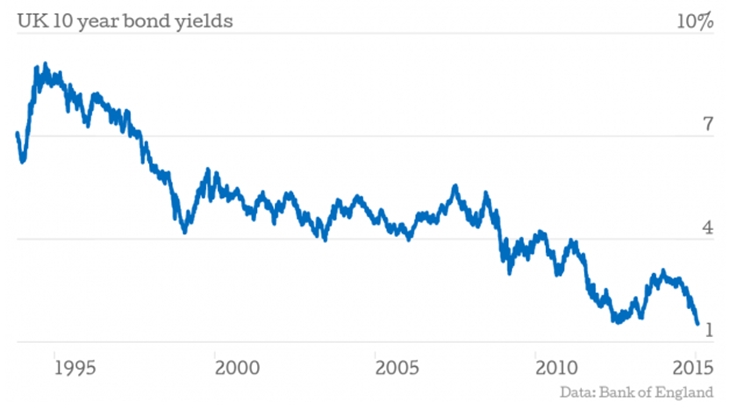
Source: Bank of England
The objection raised at this point (see Peston in particular) is that there are no projects or sectors where such returns are additionally available, otherwise the private sector would be investing in them. But this criticism is misplaced and only serves to highlight the innate superiority of state-led investment over that of the private sector.
On exactly the same investment, the returns available to the public sector are higher.
To demonstrate this, take the obvious case of housebuilding. Private builders estimate an average construction cost per home of £100,000 in Britain, and a sale price of £175,000 to cover their fees, borrowing costs and of course profits (National Association of Home Builders estimates).
Yet government can build exactly the same home at exactly the same price. It will naturally have far lower borrowing costs than any private sector company. But it is the returns to government which are massively higher. This is because government obtains tax revenues which of course are unrecoverable by any private sector developer. This will be both income taxes on all labour employed, plus tax revenues on all consumption financed by that income, and all other consequential taxes. There is also a benefit to government finances from the increase in economic activity arising from lower social security payments.
The UK Treasury estimates that for every £1 increase in economic activity there will be a 75p boost to government finances, 50p in tax revenues and 25p in lower social security payments*. As a result the net cost of home construction is just £25,000 (after all returns are included) while it now has an asset with market price of £175,000. Employment and a home have bene created and a genuinely affordable rent is easily possible.
The superiority of the public sector is even greater in a strategic sense. Government can direct investment to the most-needed or most productive sectors of the economy, energy, transport, infrastructure and education, in addition to housing in a coordinated fashion. The vastly greater returns to the government means that it is not even the main direct beneficiary of the investment. It is private firms who benefit most, at least in a direct sense, from investment in transport, education, infrastructure and so on. But the key condition is that they not be lowed to act as a brake on investment, as they are currently.
The trading response of financial operators is entirely predictable. Irrespective of their political views their purpose is to make money. The dire warnings against the 2009 Labour stimulus Budget that interest rates would soar was actually followed by a sharp fall in interest rates. Investors were more likely to get their money back from a government whose economy was growing rather than contracting. (The political response maybe another matter, but that is a separate discussion on the levers a radical government would have to use).
Government investment in the productive sectors of the economy yields very high returns, much higher than the interest payable on government debt. Corbynomics has offered a range of options to achieve that increase in investment. All of them are preferable to current policies because they can work.
*Treasury Working Paper No.5, Public Finances and the Cycle http://webarchive.nationalarchives.gov.uk/20100407010852/http://www.hm-treasury.gov.uk/prebud_pbr08_publicfinances.htm The author is grateful to the office of Caroline Lucas MP who managed to locate this paper. It seemed to have been buried away under the Coalition government.
Why Corbynomics can succeed
Why Corbynomics can succeedBy Michael Burke
The debate surrounding Labour’s leadership contest is being marred by name-calling and red-baiting. Perhaps this is inevitable but it is regrettable. Britain remains in an economic crisis, which has now entered its eighth year. A more productive course would be to discuss how to end it.
A marker of that crisis is that per capita GDP is still below where it was before the crisis began in 2008, as shown in Fig. 1 below. This remains the weakest recovery on record and the year-on-year growth rate has slowed from 3% to 2.6%. This follows a period from the end of 2012 onwards when no new austerity measures were imposed. Renewed austerity on the same scale as in 2010 to 2012 means there is likely to be a similar slowdown.
Fig.1 Per Capita GDP

The Tory strategy is more of the same, which one commentator called a Captain Bligh policy, “the floggings will continue until morale improves”. This policy is supported by virtually all the mainstream press. Unfortunately, it is also supported by 3 of the 4 candidates for Labour’s leadership. They abstained on the Tory Welfare Bill the centrepiece of the government’s latest Budget. Only Jeremy Corbyn stands on a clear anti-austerity platform. His economic policy can be found here (pdf).
Longest-ever crisis
No-one alive today has ever experienced in a longer economic crisis in Britain. The nearest comparison for the length of the current British economic crisis was at the end of the nineteenth century and the Long Depression. As per capita GDP has not recovered it is extremely difficult for median average living standards to rise. On the contrary, the austerity policy serves to work in the opposite direction by transferring incomes and wealth from poor and middle-income layers to the rich and from labour to big business. So, the latest Budget included a further cut in the Corporation Tax rate to 18% while cutting £12 billion in social protection to the most vulnerable in society.
The Tory policy is straightforward. These transfers of income known as austerity will continue until the business sector is making sufficient profits for it to resume investment. The crisis will be paid for by increasing the rate of exploitation. The austerity mark II of the latest Budget is not because there is still a public sector deficit, as this will fall as it does everywhere even if there is moderate nominal GDP growth. Renewed austerity is necessary because business is not yet willing to fund an investment-led recovery.
The level of investment in the British economy was £295 billion in 2014, exactly the same as the pre-crisis level of 2007. But the economy is actually larger 4.2% larger (keeping pace with population growth, but no more than that). Therefore investment is declining as a proportion of GDP. Consumption, not investment is leading very weak growth and this is not sustainable.
Yet the profit level has also recovered and accounted for 37% of GDP in 2014, compared to 36.1% in 2007. So the Tory policy is not working. Profits have increased by 6.8% in real terms since 2007, but investment is unchanged. Fig.2 below shows the official estimate of the profit rate in the non-financial sector versus the proportion of GDP devoted to business investment. These are strikingly indifferent results for 5 years of austerity policies. The profit rate has only barely returned to its pre-crisis level and is well below profitability prior to this century. The same is true for business investment. Both of these are a recipe for continued slow growth.
Fig.2 Profit rate and business investment

The profits recovery has been greater than the investment rebound. As a result, the extremely high level of uninvested profits has actually grown. The level of uninvested profits in the British economy was £355 billion in 2014, compared to £261 billion in 2007. This is the main brake on a robust and sustainable recovery. Andy Haldane, chief economist of the Bank of England says that firms are ‘eating themselves’ by refusing to invest and instead paying out ever-greater proportions of profits in shareholder dividends. This has been a recurring theme in SEB, and we might add the enormous increase in managerial pay and bonuses which are also a factor. The remainder is deposited in the banks, where it fuels ongoing speculation in financial assets, stocks, housing and commodities.
Unfortunately, it is this Tory strategy that 3 of the 4 contenders for the Labour leadership have endorsed. They have no principle difference with the centrepiece of Tory strategy, cuts to social protection ‘welfare’, privatisations and cuts to corporation tax. The recovery from crisis will be funded by workers and the poor.
This is an extremist economic policy. In the first phase of the leadership campaign it began with an attack on public spending of the Blair and Brown years, placing the candidates not only to the right of New Labour but to the Tories of the time, who effectively endorsed New Labour spending.
Economically, it also places those candidates to the right of Thatcher, who both spent and taxed more than New Labour as a proportion of GDP. It is perhaps worth recalling that main rates of taxation were significantly less regressive even when Thatcher left office in 1990 than they are under the current government (and that many of them were made more regressive by New Labour).
Table 1 Main Taxation Rates- Thatcher versus current

Source: HMRC
This wholesale adoption of the key planks of an economic policy of a government to the right of Thatcher has been compounded by the refusal to oppose the Tory policy of cutting £12 billion from the ‘welfare’ bill. This is widely understood as a direct attack on the living standards of the poorest and most vulnerable and will directly increase child poverty. The Institute of Fiscal Studies, which is not a hot-bed or radicalism but simply uses the Treasury’s own model of the distributional impacts of Budgetary measures, was explicit in arguing that the Budget would increase child poverty.
Yet these measures were not opposed by the Labour frontbench or by 3 of the 4 candidates for leadership. Even the Blairites used to boast that they had reduced child poverty. It is more than a rhetorical question, but also a vital political one to ask if the Labour Party supports increasing child poverty, what is it for?
Corbynomics
Jeremy Corbyn is the only candidate who is not proposing extremist economics. His policy aims to promote growth through increased public investment, funded by progressive reform of the current taxation system, and attacking the abuses of the £93 billion in annual payments for ‘corporate welfare’ in subsidies, bribes and incentives to the private sector.
At the same time he opposes any attempt to make workers and the poor pay for the crisis and rightly argues that the deficit would close naturally with stronger growth. This poses a different way out of the crisis than the one supported by the Tories and the Labour frontbench. His campaign and platform corresponds to a mood inside the Labour Party and wider society. The Tories only won 24% of the electorate’s vote in May because only a minority supports their policy. Labour got fewer votes because it had no alternative.
It used to be the case in the period of economic expansion before the crisis, that to some extent ‘a rising tide lifted all boats’. Even if the labour share of national income declined continuously from the 1980s under all governments, at least living standards for the majority in work were rising. That is no longer the case. The entire austerity policy means that there will be no rise in living standards for the majority until big business sees fit to invest once more. That is, only after having made workers and the poor pay for the crisis and a renewed fall in living standards.
It is this policy which the Labour Party frontbench has signed up to. It is a shock to many in Labour that the verbal commitment to match Tory spending is a real one, even when that means supporting an increase in child poverty. Many are quite rightly revolted by it.
By contrast, Jeremy Corbyn’s economic plan is a moderate, logical and fair one. Big business has the resources to fund the investment the economy needs and as they refuse to invest on a sufficient scale, government will use some of their resources in the interests of society as a whole. Workers and the poor should not pay for a crisis they did not cause. Jeremy Corbyn’s plan for state-led investment offers a way out of the crisis.
Why Poland isn’t Greece
Why Poland isn’t GreeceBy Gavin Rae
According to the Financial Times, Donald Tusk, the President of the European Council, played a key role in finalising the negotiations that led to the forcing of the draconian bailout agreement upon the Greek government. In doing so, the former Polish Prime Minister has contributed to the undermining of the principles of democracy and solidarity that are supposed to uphold the European Union. He has also helped to ensure that the European Union moves further away from the very policies that have benefited the Polish economy.
Donald Tusk, whilst Polish Prime Minister, regularly referred to Poland as Europe’s Green Island and the country that had most successfully avoided the recessionary effects of the global economic crisis. Political leaders and commentators, both at home and abroad, have praised the country for its achievements and put it down as a success story of neo-liberal reform and a model for emulation by others.
Of course this image of Poland is a simplified and in many ways misguided one. The country continues to suffer from high unemployment rates and large pockets of poverty; it has the largest percentage of workers employed on insecure contracts in the whole of the EU; many of its essential public services are crumbling; its industrial base has been largely dismantled and up to two million of its citizens have been forced to emigrate in search of a better life abroad. The fact that Poland can currently be considered a success, says more about the dire state of the European economy than it does about the actual situation in the country.
Despite these failings it would be wrong to dismiss the benefits of Poland’s economic growth. The Polish economy has grown by around 22% since the financial crisis in 2008, whilst for example the Greek economy has shrunk by 28% and Spain’s by 5%. So why has the Polish economy enjoyed this relative success?
Over the past couple of decade, the Polish economy has only developed when it has at least partially diverted from the course of neo-liberal reform. Furthermore, it is rarely acknowledged that this has only been possible when European and international institutions have provided the room and means for the Polish government to take a more interventionist role in the economy. This has principally taken two forms: firstly the writing off large parts of Poland’s external debt and secondly the transfer of large EU funds to the country.
The current economic crisis in the Eurozone is centred upon the attempt to transfer the costs of the European financial crisis onto the people of southern Europe and other periphery economies, through the implementation of extreme programmes of austerity that have already caused a social and economic catastrophe in these countries. However, one wonders whether during discussions between Angela Merkel and Donald Tusk over the current crisis in Greece, they ever reflect on the fact that the only two countries to have had their external debt written off in post-war Europe were in fact Poland and Germany. Poland was able to recover from the sharp economic downturn at the beginning of the transition, when in 1991 it made an agreement with the Paris Club (that represented the main state creditors) to reduce its debt in half and three years later it came to a similar arrangement with the London Club of commercial banks. This provided the room for the Polish economy to grow and in 1996 it became the first economy to return to its pre-transition level of GDP.
Poland was able to recover from its second major economic slowdown, after it entered the European Union in 2004. As we can see in the table below, GDP growth peaked at 7.2% in 2007 and although growth slowed again following the outbreak of the international financial crisis, Poland has continued to sustain its course of economic growth. The common explanation given for this was that its previous reforms had created a competitive and dynamic economy that shielded it from the worst effects of the crisis and allowed it to develop even during the most turbulent times in the international economy. As this version of events has largely gone unchallenged, Poland has become neo-liberalism’s symbol of success in Europe.

Poland was able to avoid an economic recession due to a unique combination of internal and external factors. Firstly, the country suffered no significant collapse in its banking and financial sectors. Personal debt in Poland remained low and the banking sector relatively well regulated. Secondly, Poland was not as dependent on the inflow of private credit and capital as some other small economies in the region, nor so heavily reliant upon exports. Thirdly, Poland had not joined or tied its currency to the euro and therefore could retain some competitiveness through devaluation. Finally, throughout the crisis, the Polish government continued to increase spending, particularly by raising public investment through utilising the money gained from an inflow of European Union structural and cohesion funds. It is this final point that has been of crucial importance for Poland’s relative success.
Poland found itself in the fortunate position of having large structural and cohesion funds flow into the country just as the international economic crisis began. It is worth pausing to consider what these funds actually are. These are funds that are paid by member states into the European Union budget and are distributed primarily to its poorer regions in order to foster economic convergence. Therefore, they are the complete antithesis of neo-liberal economic orthodoxy as they are based on the principles of government spending funded through economic redistribution from the richer to the poorer regions. These funds are inadequately low, with the European Union’s budget only equalling around 1% of the member states’ total GDP. However, they have helped many of the poorest countries and regions of the European Union to invest in their infrastructure and make some important developmental strides.
Poland was the single largest recipient of European Union funds from the 2007-13 budget, and was liable to receive up to €67billion in structural and cohesion funds. This helped the government to instigate large investments in the country’s infrastructure, particularly in preparation for the Euro2012 football championships. As a share of overall investment, public investment increased from 35% to 43% between 2005 and 2010 and as a share of GDP from 4.2% to 5.7% from 2007 to 2011. The biggest increase in investment was in the area of buildings and infrastructure, which increased from €1.8billion in 2005 to €3.1billion in 2010.
However, as the funds from the first European Union budget began to dry up and the investment surge for Euro2012 came to an end, so economic growth in Poland started to slow, falling from 4.8% in 2011 to 1.8% in 2012 and then 1.7% in 2013. This was caused by a fall in the rate of public investment, which declined from nearly 6 of GDP in 2011 to just over 4% in 2013. Nevertheless this was still significantly higher than the average rate of public investment in the European Union and well above that in countries such as Spain and Greece. Poland’s rate of public investment began to rise again in 2014 as funds from the new European Union budget started to arrive and economic growth rose again above 3%. For the first time in its history the present European Union budget (2014-21) is lower than the previous one. However, Poland uniquely managed to negotiate itself a share of the budget that is higher than that which it had received previously, meaning that it has access to around €500bn (adjusted for inflation), which equals around €1,890 per head, €82 more than that received out of the 2007-13 budget. Despite the continual difficulties in Poland, and the ongoing uncertainty in the European and international economy, this sum should be sufficient for the government to once again increase investment in the economy and sustain a course of positive economic growth.
By the end of this decade these funds will begin to dry up and it is unlikely that Poland will receive a similar inflow of money from the European Union again. The danger is that it will then be in a similar position to that which many countries in southern Europe find themselves today. These countries received even higher levels of European Union funds in the 1980s and 1990s, which helped them to develop much of their neglected infrastructure. However, once these funds were diverted eastwards and then the financial crisis hit, so their economies spiralled downwards. If Poland is to avoid a similar fate it has to work out how it will maintain its rate of public investment when the current European Union budget ends. It should start now by arguing for a significantly enlarged future European Union budget and also support restructuring the debt of countries such as Greece to allow them the room, that Poland was previously afforded, to rebuild their economies.
Unfortunately the actions of Donald Tusk and other European leaders have served to significantly weaken any remaining principles of solidarity and cohesion in the European Union. This will hit periphery economies like Poland the hardest and strengthen conservative politicians in the richer states that wish to pursue more protectionist policies, close their labour markets and reduce the amount of subsidies and funds transferred to poorer regions.
Austerity Mark II, same as Mark I
Austerity Mark II, same as Mark IBy Michael Burke
Most media coverage of the Budget is predictably sycophantic and wrong. An objective assessment is that the amount of fiscal tightening planned in this Budget is exactly the same as outlined in the June 2010 Budget. The June 2010 Budget planned tightening of £40bn, but £3bn of this was the projected fall in interest payments. Total austerity measures were £37 billion. This time George Osborne has announced total fiscal tightening of £37 billion, with further details to be added in future Budgets.
Therefore the same result should be expected. The British economy is now 14% larger in nominal terms than it was in 2010, but the international economy is growing more slowly. Circumstances are not exactly the same then and now, but the impact of £37 billion in austerity will be broadly the same. If these plans are implemented growth is likely to slow as it did previously.
At that time in 2010 the economy was growing at a 2.2% annual rate. The imposition of austerity measures slowed that to just 0.7% in 2012 and the economy only narrowly avoided a rare ‘double-dip’ recession[i]. The stronger growth in 2013 and 2014 arose because there were no new austerity measures in the run-up to the General Election.
In that same 2010 Budget Osborne claimed the public sector net borrowing would fall to £37bn in 2014/15, or 2.1% of GDP. The outturn was actually £80 billion and 4.4% of GDP.[ii] In fact the deficit was on a rising trend in 2012 to £111 billion from £92 billion in 2011 as the economy slumped. It only started to fall once new austerity measures were halted and the economy could recover. Austerity did not cut the deficit. Growth did.
Austerity transfer of incomes
Austerity is the transfer of incomes from poor to rich and from workers to big business. Social protections (so-called welfare) are cut in order to drive workers to accept ever-lower pay. If people with disabilities can barely subsist, if the sick have subsistence incomes cut, if women have lower pay, increased burdens from worse public services and greater responsibilities as carers, this is regarded only as collateral damage, if at all.
In the £37 billion in combined tax increases and spending cuts over this Parliament, only £17 billion of that is specified in the latest Budget. Very large departmental cuts will be announced in the Autumn Statement and future Budgets, totalling £20bn. £12 billion of that £17 billion will come from cuts to social security protection, and another £5 billion is said to come from clampdown on tax evasion.
The claim that any of this has as its primary aim deficit reduction is belied by the cut in Corporation Tax to 18%. Even before this cut, businesses paid a token amount of total taxation. In the current year corporate tax receipts are expected to be £42 billion. This compares to a total £331 billion paid in income tax, VAT and council tax.
There is also a host of benefits to companies and the rich including more measures on Help to Buy, and rent a room relief to add fuel to the house price bubble. The Inheritance Tax threshold is raised to £½ million per person, up to £1 million per family on homes. Shareholders can receive £5,000 in dividend payments tax-free. Along with other changes, rich savers can now receive £17,500 a year tax-free. There is an increase in tax-free personal allowances and the main beneficiaries of all such measures are high taxpayers.
For the poorest, there are only ‘welfare cuts’. After 2017 there will be no additional tax credits, Universal Credit or housing benefit for families with more than two kids. New applications to Employment Support Allowance will be curbed, which is for people who are not fit to work. A string of further cuts to entitlements will only emerge slowly. The Financial Times has already shown that cuts to tax credits will hit ethnic minority communities hardest.
Osborne also announced a National Living Wage amid much excitement from the Tory press and the BBC. It is entirely fake. The current National Minimum Wage is not enforced and the TUC estimates 350,000 workers are paid below it, alongside an army of people in forced ‘self-employment’. The actual Living Wage is estimated objectively, and includes the tax credits that Osborne has slashed. Insultingly, the main beneficiaries of the Tory plan are actually businesses, who have had Corporation Tax and employers’ National Insurance Contributions cut by a greater amount to ‘pay for’ it.
Public sector pay rises will be capped at 1%. This is below the level of inflation projected by the Office for Budget Responsibility in every year from 2016 through to 2020. This is another large real cut in public sector pay. The target is not solely public sector workers, as there is what is known as a ‘demonstration effect’ where depressing public sector pay also holds back private sector pay. This seems to have operated strongly for most of the last parliament.
Politically, it is a deeply reactionary Budget. There is a real-terms increase in military budget every year and a commitment to spending 2% of GDP. This stands in contrast to the NHS, education budgets and so on. The Tory claim is that these are ‘protected’ when in fact they are frozen. As there is still inflation and the population is growing, this ‘protection’ amounts to large real per capita cuts. At the same time, Osborne signalled a large shift towards road building and continued the move away from renewable energy. It is the opposite of Green budget.
There will be a strongly regressive regional effect. Areas where there is a higher level of social protections payments, poorer areas and those with a higher proportion of public sector jobs will all be hit harder. The City of London and the South East outside London will be the beneficiaries. Scotland and Wales are threatened with the Tory version of fiscal devolution; taking responsibility for Tory cuts and the power only to make further cuts. The Irish are not even trusted that far. The intention is to try to impose the Tory version of the Stormont House Agreement, which is not what was agreed. The Tory version is a raft of cuts which would further entrench the British mismanagement of the Irish economy.
There are alternatives
The experience of 2013 and 2014 compared to the previous years of the last Government shows that growth is the key to reducing the deficit, not austerity. As the economy slowed in 2012 the deficit rose from £92 billion to £111 billion. When austerity was halted, the economy experienced a mild recovery and the deficit fell to £88 billion.
Austerity doesn’t close the deficit; growth does. The government should be investing in developing the economy and in public services for growth, which would reduce the deficit. Rather than cutting taxes, business levies should be increased in order to finance the necessary investment in renewable energy, rail transport and ports, housing, infrastructure and education. Instead, public sector net investment will be cut every year in this parliament. The projected level of £30.4 billion in FY 2019/20 will be just 1.3% of GDP, compared to 3.5% in 2009/10.
The government’s campaign against ‘welfare’ is based on a falsehood. We are not living beyond our means, as the average household contributes £463 a year more into government coffers than it receives in benefits and services (even including the NHS, education, free school meals, bus passes for the elderly and so on).[iii]
We also learn that ‘corporate welfare’ amounts to £93bn a year, which is greater than the £88 billion of the deficit[iv]. This could be cut, rather than social protection entitlements to the most vulnerable.
The tax system is hugely regressive. It could be reformed to allow those best able to pay the burden of the crisis to do so. Tax breaks on pensions for those earning over £150,000 could be eliminated.
The top tax rate of 50p could be restored at the same level. The 10% rate on Capital Gains Tax should be increased to the basic rate income tax, to ‘make work pay’. Corporate tax relief on both losses carried forward to future years and back to previous years is unique to Britain. Most countries allow one or the other, but not both, and one should be scrapped. ‘Non-domicile’ tax status applies to 115,000 residents, who are overwhelmingly the super-rich, oligarchs, etc. Their status should be ended, not just tinkered with as Osborne has done, so that if they want to live and work here they should pay taxes at the normal rate. These funds could be used to finance public investment, along with levies on business.
There is also hugely wasteful spending. Defence spending is the only area where spending is fixed as a proportion of GDP, and has no economic benefit. Trident will also cost £100bn over its lifetime, which is a non-independent nuclear deterrent and could only be used in a worldwide nuclear conflagration.
There are a myriad of alternatives. What is required is the political will to elaborate and champion them. The attack on ‘welfare’ comes first because there so little opposition to these cuts, certainly none from the Labour front bench.
Yet all Chancellors are political and this one intensely so. The pace of austerity has been slowed compared to the March Budget (which successfully induced Labour to sign up to wholly unrealistic spending plans). The small tax increases in the latest Budget do not fall on workers or the poor. This reflects Tory political weakness, as they felt unable to. This government has less support than Thatcher while it is trying to carry out a more radical programme. Opposition to austerity both inside and outside parliament can change Tory plans. They already changed once after all, in 2012. The Tories have radically reactionary plans, but they can be prevented from implementing them.
[i] World Bank, GDP data http://data.worldbank.org/indicator/NY.GDP.MKTP.KD.ZG
[ii] ONS, Public sector finances, May 2015 Tables PSA1 & PSA5A http://www.ons.gov.uk/ons/dcp171778_407371.pdf
[iii] ONS, The effects of taxes and benefits and household incomes in FY 2014 http://www.ons.gov.uk/ons/publications/re-reference-tables.html?edition=tcm%3A77-375072
[iv] Guardian, 7 July The £93bn handshake http://www.theguardian.com/politics/2015/jul/07/corporate-welfare-a-93bn-handshake
Deficit? Households are running a surplus
Deficit? Households are running a surplusBy Michael Burke
George Osborne will cast his latest ‘emergency Budget’ in terms of the imperative to reduce the deficit. This is of course nonsense. The Chancellor has cut the corporate tax rate from 28% to 20% and cut income taxes for high earners while slashing public services, social protection payments, public sector pay and jobs. This is a transfer of incomes from poor to rich and from workers to big business. Like its policy predecessors (monetarism, shadowing the Deutschemark, membership of the Exchange Rate Mechanism, and so on) deficit-reduction is simply a cloak for policies aimed at reducing wages and the social wage in order to boost profits.
The claim for deficit reduction is that ‘we are living beyond our means’. But the target of the austerity policy is the living standards of average households. They are not running a deficit at all. In fact the average household runs a surplus with the government. The average household contributes more revenue to government than it receives. Taking all taxes and all benefits into account, this surplus amounts to £463 per household on average. As there are approximately 26.5 million households in the UK, this means that the household sector ran an aggregate surplus with government of over £12 billion in the most recent year.
To be clear these benefits include benefits-in-kind including a monetary value of education, of the NHS, subsidised travel and vouchers for free school meals as well as all forms of social welfare protections. The data is compiled by the Office for National Statistics, and the key summary table is reproduced below.
Summary of the effects of taxes and benefits on ALL households, 2013/14

The household sector is not ‘living beyond its means’ and there is no imperative to resume austerity on this score. The welfare burden is anything but; households contribute more in direct and indirect taxes than they receive in benefits.
Yet the deficit is real. Part of this is the necessary spending on international aid, policing and other items, but also on wholly unproductive items such as the military budget. But these are not substantial budget items by comparison to pensions, social security, the NHS and so on. As the deficit is real, and the household sector runs a surplus there must be a key sector of the economy that is ‘living beyond its means’, or lazily scrounging off the rest of the society. In Britain that sector is big business. It receives approximately £85 billion a year in what is known as corporate welfare, tax breaks, incentives, subsidies and other transfers.
Research from the University of York suggests that the annual bill for corporate welfare in 2011/12 was £85 billion, on a conservative estimate. This includes all the subsidies and grants paid to business, as well as the corporate tax loopholes, subsidised credit, export guarantees and so on.
This is the real drain on resources. The subsidies help to preserve inefficient and otherwise unprofitable companies at the expense of both their customers and their efficient competitors. If those companies are performing a necessary function but cannot do so without the subsidies, then they properly belong in the public sector.
There is too the question of the deficit which is the ostensible reason for the austerity policy. In the most recent financial year the public sector deficit (excluding the effects of the bank bailout) was £89.2 billion.
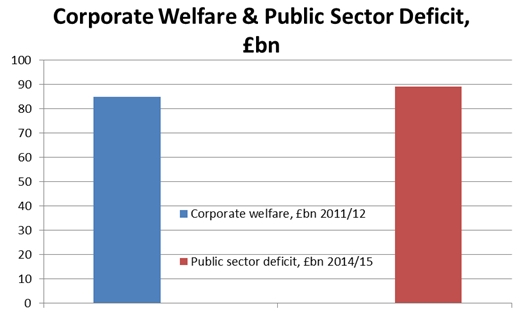
As corporate welfare has been rising since 2011/12 it is safe to assume it accounts for the entirety of that public sector deficit. It is business, not the poor, people with disabilities, women burdened by increased carer responsibilities or public sector workers who should shoulder the burden of the crisis they created.
*Aditya Chakrobortty has provided an excellent update of the latest estimate of ‘corporate welfare’, which now stands at £93 billion. This is greater than the entire public sector deficit in the latest financial year.
Wages, profits & investment In Greece
Wages, profits & investment In GreeceBy Michael Burke
The IMF has placed a road-block in the way of a deal with the Greek government and it remains unclear whether any agreement can be reached. The prior agreement which the IMF rejected was itself already very onerous. But the IMF wants to shift the burden of paying for the crisis away from taxes on business and the better-paid towards more cuts in social protection. This is an insupportable burden as net median household incomes are already below €8,000 a year. Many multi-member households without work subsist solely on state and public sector pensions.
The IMF argues that taxes on business will hamper growth, as business profits are needed to fund investment. This argument is an important one and should be addressed. It can be demonstrated that it is false argument. In demonstrating that, it is also possible to identify a way out of the crisis.
In general, in a commodity producing economy profits are the decisive factor in determining the rate of growth. In a capitalist economy it is the profits of the private sector which predominantly fund the accumulation of productive capital via investment.
But if profits alone were sufficient, then there would no crisis at all in Greece. Greece has the highest profit share (profits as a proportion of national income) in the whole of the OECD. The Greek profit share was 52.4% in the most recent data. This is substantially greater than many other countries in the OECD and as a consequence the labour share of national income is also the lowest in the OECD.
Table 1 below shows the profit share and the wage share in selected OECD countries. In effect, the IMF prescription is that those who are least able to pay should bear the burden of the crisis.
Table 1 Profit Share & Wage Share of National income in Selected OECD Economies

Source: OECD, based on Gross Operating Surplus &
Compensation of Employees as a proportion of GDP, data for Q1 2015.
Does not sum to 100% because taxes on production omitted
Compensation of Employees as a proportion of GDP, data for Q1 2015.
Does not sum to 100% because taxes on production omitted
It should be noted that the crisis countries of the EU in general have the higher levels of profit share but Greece leads the pack. The trends in Greek profits and wages are shown in Fig. 1 below.
Fig.1 Greek profits and wages

There are already ample funds in Greece for productive investment in the form of the profit share of the business sector. The crucial point- and the driving force behind both the structural and cyclical crises of the Greek economy- is that Greek businesses are not investing, but are hoarding capital instead.
Providing businesses with a shield against austerity while cutting social protection will not provide the investment needed. This is because Greek businesses are unwilling to invest. The level of profits in Greece and the level of investment (Gross Fixed Capital Formation, GFCF) are shown in Fig.2 below, as well as the gap between the two.
Fig.2 Greek Profits and GFCF

In the most recent full year the nominal level of Greek profits was €95bn while the level of GFCF for the whole economy (including government and households) was just under €21bn. It is this level of uninvested profits which is the main cause of the crisis in Greece.
Table 2 below compares the profit share and the rate of investment. Using OECD data it is also possible to show what proportion of that investment is actually made by the business sector itself.
Table 2 Profit Share, Investment Share & Uninvested Profits Share of National income
In Selected OECD Economies

Source: OECD, * Most recent year 2013 or 2014
There are of course many other calls on the Gross Operating Surplus other than investment, such as taxes and social contributions, but in the case of Greece all these taken together amount to no more than 5.8% of national income. The net savings of the business sector are far larger, at 9.2% of national income, along with another 2.9% distributed to shareholders.
In a certain sense the situation in Greece is just an extreme case of the general trend in the Western economies, where the profit share has been rising and yet the investment share has been falling. It is the extremely high level of uninvested profits which is the cause of the crisis. There is nothing to prevent the business sector investing all of its profits and more, via borrowing. This frequently occurs in economies where growth is strong. But in the OECD as a whole the business sector is hoarding capital. Greece is an extreme case because this has been the case over decades, and deteriorated further during the crisis.
These savings are not being held in Greek banks, which is a factor contributing to their precarious state. Bank of Greece data show that deposits by Greek firms fell by €8bn (equivalent to 4.5% of GDP) in the year to April 2015 even though both profits and savings were substantial. This amounts to looting the country; extremely high rates of exploitation combined with minimal investment and spiriting away the resulting savings and shareholder dividends to overseas banks.
It is precisely these idle resources of the business sector, especially the Greek oligarchs which should be tapped. This is not simply to shield workers and the poor from further austerity, as important as that is. But these idle resources could be deployed to fund an investment-led recovery that would regenerate the economy. It is precisely taxes and levies on the business sector which are required, and perhaps stronger measures such as nationalisation, in order to tap these resources. They are also the measures that provoke the fierce hostility of the international institutions led by the IMF.
The argument that this will curb the investment of the business sector does not stand up. Despite claiming 52.4% of national income the business sector’s investment is equivalent to just 4.4%. The bulk of investment in the Greek economy comes from households, mainly on house building and repair. Business investment is just a fraction of the level of uninvested and profits and savings. This remains the source of the Greek crisis, which cannot be resolved without state-led investment.
Syriza not crushed yet
Syriza not crushed yetBy Michael Burke
A majority of European leaders have opted to try to strangle the Syriza-led government slowly rather than immediately crush it. In order to survive the Syriza leadership has had to make a series of compromises. The burden of these new measures offered in the latest negotiations is overwhelmingly tax increases and they mainly fall on companies and the higher paid. But, unless there is a breakthrough on debt reduction, there is no progress on ending austerity.
One faction, led by German finance minister Schauble and supported by his Irish and Spanish counterparts wanted to organise a run on the banks and overthrow the government in a re-run of the crisis that was provoked in Cyprus in 2012. Reports suggest that US Treasury Secretary Lew was instrumental in pursuing a line of compromise instead. But all the institutions ultimately represent the interests of big capital and Greece’s creditors. As a result they remain committed to austerity and the ultimate destruction of all anti-austerity forces in Europe, including the Athens government. What they dare not risk is the possibility of European and possibly global financial market turmoil from a disorderly ‘Grexit’.
The new tax measures Syriza has offered are significant. According to the Financial Times, “More than 90 per cent of the €7.9bn fiscal package would be covered by increases in tax and social security contributions. The tax measures include a special levy on medium-sized companies’ profits, higher value added tax rates, a rise in corporation tax and a wealth tax on household incomes above €30,000 a year.” According to Eurostat, median household net incomes in Greece were €7,680 in 2014.
Other reports suggest that even this is not acceptable to the IMF, which represents US interests. They want the burden of taxation shifted from business to cuts in social security payments. While the US holds no Greek government debt, it is the biggest foreign owner of Greek listed shares.
It is clearly preferable that the fiscal burden is borne by companies and the higher-paid. But there is nothing in the current agreement which improves the position of the mass of the population. The effect of the concessions will be slower growth, even if most workers and the poor have largely been shielded from the worst direct effects.
Further details have yet to be hammered out. The focus on the primary surplus (the balance of government income and spending excluding debt interest payments) is meaningless as it is based on the false premise that spending cuts or tax increases will lead to equivalent savings, ignoring the economic effect of slower growth on both government spending and tax revenues. The only possibility for measures to boost growth via investment is if there is significant debt reduction and lower interest payments. On this, the IMF representing the US is more willing to support debt reduction precisely because almost nothing is owed to the US. For the opposite reason, hostility to debt reduction is most ferocious among some of the European governments.
The majority line among the institutions is clearly based on political considerations. Immediate crisis and turmoil has been avoided because of the wider risks to a fragile set of advanced industrialised economies. But undermining Syriza and demoralising its supporters remains the aim. The latest set-backs are only the first steps and the institutions will welcome any splits in the government.
But Syriza still has room, and some time to act. It can improve the balance of forces domestically and internationally by taking unilateral anti-austerity measures using the resources of the Greek oligarchs, possibly supplemented by overseas investment. It is now obvious that it must have measures to protect bank deposits from another bank run provoked by the ECB and others. The institutions will return with further demands in future, when this new measure fails to produce growth and improved government finances. Syriza should prepare for that inevitability.
Recent Comments