Uncategorized

The transformation of Latin America and the Caribbean and its new challenges

6992,00.html”>Above $4 a day people can also begin to move beyond basic necessities and establish at least some quality of life. Most important of all average life expectancy at birth has risen by 3 years, from 71 years to 74 years. This is the most fundamental social indicator of all indicating improvement in living conditions and prosperity and is only possible with a combination of increased access to a range of foodstuffs, improved healthcare and housing.

There are a large number of indicators of poverty reduction and social progress which point in the same direction, although some important indicators of the position of women have not improved or have even gone backwards. These are significant omissions which need addressing. But taken as a whole the improvement in the economy, the general well-being of the population and its poorest members have also shown remarkably rapid and dramatic improvement since the beginning of this century.

Source of growth

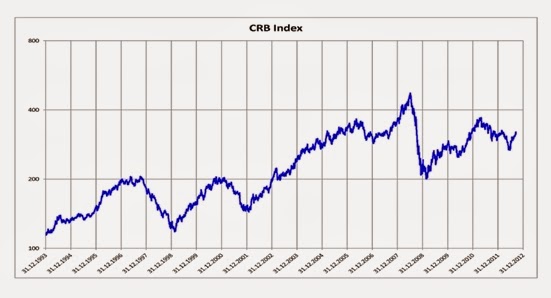
Many Latin American and Caribbean economies are exporters of basic commodities. Like all commodity producers they benefited from the strong rise in global commodity prices in the early years of this century. The increase in commodities’ prices is illustrated in Fig. 4 below, as the commodities’ research Bureau (CRB) aggregates a basket of many of the key commodities’ prices, which doubled in price over the period.

Fig.4 CRB Commodities Index, 1993 to 2012
Source: Reuters/CRB

However the widespread assertion that exports were the sole or even main contributor to regional growth is a misconception. The accurate picture is that the increased export earnings from rising commodities prices were a catalyst for growth in general but that this growth was led by investment. This is shown in Table 1 below which itemises the growth rates for GDP and its components since the beginning of this century.

Table 1. Latin America & the Caribbean, Growth of GDP & Its Components, 2000 to 2016 (Forecasts)
For most of the period 2000 to 2012 exports were one of the weaker components of GDP growth. Over the period as whole they grew more slowly than GDP itself. Furthermore for the entire period exports grew more slowly than imports. As a result net exports actually subtracted from growth.

The leading component of growth was fixed investment. This conforms to economic theory, where the amount of capital deployed and the growth of the workforce and its quality (via training and education) account for the overwhelming bulk of growth. In the most accurate terminology, fixed investment is the accumulation of the productive capacity of any economy. As previously noted, both consumption and living standards improved dramatically over the period. But consumption cannot be an input into growth. If consumption growth exceeds output, it can only be sustained by increased indebtedness which actually leads to lower living standards. The increase in both private and public consumption was only made possible through the sustained increase in fixed investment, which was the strongest component of GDP growth by some distance.

It was only in 2010 and 2011 that exports grew more strongly than GDP. This was a result of global quantitative easing led by the US and the modest recovery in the leading economies which had the effect of driving up global commodities prices even further. But this produced its own negative effect. 2012 was the first year where fixed investment growth lagged GDP growth and the economy has slowed since. As resources are diverted away from investment economic slowdown inevitably follows.

Problems caused by the US

The period 1980 to 2000 was a lost generation for Latin America. The US had overthrown the Allende government in 1973 and held sway over the continent mainly through its alliances with brutal military dictatorships. The revolts against the dictatorships in Nicaragua, El Salvador and Grenada were all blocked or overturned by the US or US-backed forces.

It was this US dominance in the region which paved the way for economic collapse. The US had unilaterally withdrawn from the Bretton Woods currency system in 1971, provoking a global spike in commodities’ prices. It was forced to do so because it was unable to finance both the Viet Nam war and domestic consumption at the prevailing exchange rate. This fall in the US Dollar/rise in commodities’ prices resulted in a huge increase in the Dollar export earnings of the oil producing states, concentrated in the Arab world.

The oil producers, led by Saudi Arabia effectively bailed out the US through a huge inflow of those earnings in the form of ‘petro-Dollars’ into US banks. As well as financing US budget and trade deficits these funds were also used to boost US banks overseas lending, especially in Latin America.

The global downturn of the late 1970s left these borrowers exposed, primarily government borrowers. A full-blown currency, debt and economic crisis was marked by the Mexican government’s debt default in 1982. At US insistence, it was the US banks that were rescued, not the Latin American economies, through the issuance of ‘Brady Bonds, named after the US Treasury Secretary. Debt crises in a host of other countries followed and the resulting debt burden sucked capital from South to North over the following decades and led to economic stagnation and misery.

These gyrations are not solely of historical interest. The role of the US Dollar as the major reserve currency and the denominator for virtually all globally-traded commodities means that significant or abrupt changes in US economic and monetary policy are magnified in commodity-producing and/or debtor economies. Sharp changes in US monetary policy always lead to sharp dislocations in the rest of the world, especially in ‘emerging markets’. As the US is also the world’s largest net debtor economy, it has a constant necessity for inflows of overseas capital. In periods of economic expansion this need increases sharply. Changes in US monetary policy are conditioned by this requirement for capital generated in the rest of the world and so can cause abrupt and hugely dislocating flows of capital in other countries.

This is precisely what has happened in the most recent period. The US Federal Reserve Bank ended its third round of quantitative easing on October 29. This had helped to inflate financial assets included commodities prices from 2010 onwards. Now the US is consciously aiming to drive down key commodities’ prices. The US has agreed with the key oil producer Saudi Arabia that the oil price should fall. On the US side this is an extension of the sanctions against Russia, but it welcomes the collateral damage to countries such as Venezuela, where sanctions are now also threatened.

New challenges

Politics comes before economics. The economic transformation of an entire continent cannot happen randomly. Across the region (with certain exceptions) through decades of upheaval a political leadership has been forged that rejected the dominance of the US and its neoliberal economic policies. The period 2000 to 2002 was marked by the sharp turn of Hugo Chavez’s revolutionary government in Venezuela towards Bolivarian socialism, ending generations of national humiliation. Shortly afterwards the serial humiliations inflicted on Argentina hit a brick wall with its default. Then in 2002 the Lula and the Brazilian Workers’ Party won the Presidential election.

Although they represent different social coalitions their common platform is a desire for economic growth, and the improvement of the living standards of the population, in particular the poorest layers of society. In different ways they draw inspiration from the Cuban revolution and its determined resistance to US rule.

It is important to stress that economic redistribution was an outcome made possible by growth. It was not the driver of it. The principal economic contributor to the economic transformation was the rise in fixed investment. Until 2012 fixed investment was the strongest component of growth and was its leading element. Growing trade, including intra-Latin American trade was a key catalyst for investment-led growth. This in turn allowed the growth of both public and private consumption, which indicates the general rise in living standards.

But the catalyst of rising export revenues has gone into reverse. At the time of writing the CRB Index had fallen to 247, close to levels last seen at the depths of the crisis in 2008. The oil price has fallen below $65/bbl a new 5-year low. This is a direct consequence of changes in US policy. This is in effect a crisis of 2008/2009 proportions for most of the commodity-producing economies, which takes in virtually the entire continent of Latin America and the Caribbean.

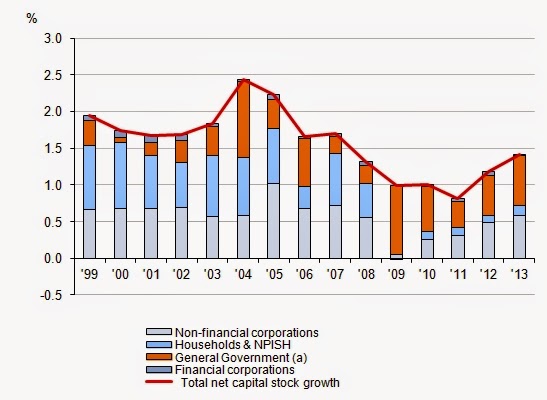
The growth of fixed investment has slowed to a crawl, which will prevent any sustainable revival of GDP growth. This is illustrated in Fig.5 below with reference to Brazil, which is by far the largest regional economy and accounts for nearly 40% of the entire continental GDP. This shows Brazilian Gross Fixed Capital Formation (GFCF) as a proportion of GDP, both the total and the specific contribution of the private sector. From 2002 onwards the long-term decline in the investment rate was being reversed. But there has been a renewed decline in 2012 (and other data suggest this has been extended since).

Fig. 5 Brazil GFCF, Total and Private Sector, % of GDP

Capital outflow

There is also a new threat in the form of capital outflow. The US is the dominant financial power in the world and the US Dollar the main currency denominator not only for commodities but also for international debt. Yet the US has a structural capital shortage, as shown by its chronic deficits on the balance of payments. In periods where US capital is seeking to expand, it is obliged to suck in capital from the world. The outflow of capital from ‘emerging market economies’ was recently the subject of a strong warning from the Bank for International Settlements (BIS). This is a specific threat to the Latin American economies.

The BIS data show that Latin America and the Caribbean owe BIS-reporting banks (the banks of all the industrialised economies) a net amount US$1.337 trillion. Of this $565 billion is held in foreign currencies, which is virtually all in US Dollars. The overwhelming bulk of this US Dollar debt is owed by both private sector firms and banks based in the region and is owed to Western banks. US Dollar debt owed by governments is a relatively modest $113 billion.
In addition to the challenge posed by falling commodities’ prices and the need to reverse the sharp slowdown in the growth rate of investment, it is the region’s private sector firms which are the Achilles Heel of the economy.

The regional firms and banks are no longer benefitting from the rise in exports and are primarily responsible for the sharp slowdown in investment. They are also the primary source of capital outflow from the domestic economies, and will in many cases be directly responsible for it. They are likely to come under severe pressure as they absorb the effects of lower exports, slowing domestic economies and rising debt-servicing costs. There is no point in minimising the scale of these difficulties. They amount to a new crisis for the entire region and need a new response.

Responding to the new threats

A revival of growth is vital for a return to rising living standards. Three key steps are required, each of them interrelated. Returning to per capita GDP growth depends first on reviving the growth of fixed investment. Secondly it is necessary to soften the blow of falling export prices by increasing trade diversification. This is both a geographical diversification as well as adopting measures to increase the value created in production by increasing the output of finished goods and manufactures, compared to basic commodities. Thirdly a series of strong defensive measures are needed to insulate the region from the US-driven outflow of capital.

The decline in fixed investment is primarily the responsibility of the private sector. Since private sector investment is determined by the anticipation of profits a spontaneous recovery cannot be relied on, especially in the current conditions. Therefore the state sector must increase its own level of investment. It can do so in a number of ways, including directing domestic banks to increase productive investment by cutting back on speculation or other useless activity. It can regulate the level of private sector firms’ investment by legislation and other means (including in the awarding of government contracts). It can also apply windfall or other confiscatory taxes to fund direct government investment. If the private sector resists any of these measures, all necessary steps can be taken to overcome that resistance, including nationalisation.

One of the great successes of the period of expansion has been increasing continental economic co-operation through a variety of regional bodies, including Mercosur/Mercosul and ALBA. This helps to break down colonial patterns of development, where nearly all international trade was formerly geared towards exports of basic goods to the US. The deepening of regional ties through increased trade and infrastructure projects can help to soften the blow of falling commodities’ prices. But it is also important to move higher in the value chain of production and away from basic goods. Over the long-term manufacturing has been in decline as a proportion of GDP across the region. Increasing regional value creation requires both development of the economic capacity and access to hi-tech investment products. Here the two key potential allies are the deepening of ties with China and Russia. The former can provide funding for regional infrastructure and both can provide access to hi-tech investment goods, vital to revival of manufacturing and increasing value-added.

The outflow of capital represents an immediate and significant threat to regional prosperity. National savings need to be protected from US predations. Strong counter-measures are required. These may include restrictions on financial trading, capital controls and taking state ownership and control of the banks where necessary, as they facilitate the highly damaging outflow of capital.

Conclusion

Latin America and the Caribbean have seen a remarkable transformation in the most fundamental of living standards of the population in the first decade of this century. The first condition was the forging of a political leadership capable of coming to power and ending US domination.
Economically they were able to achieve this as the commodity-producing economies of the region benefited from the global rise in commodities prices. But this benefit was used to fund investment, which was the leading component of growth. It was the rise in investment which allowed the rise in living standards.

Now commodities’ prices have gone into reverse. Yet it remains the case that only increased investment can lead to increased prosperity. Therefore new radical measures are required in order to fund investment. Continuing the transformation in distribution will require a transformation in production.

This is centred on the direction of private sector firms and banks operating in the region. They have reduced their level of investment in the face of falling commodities prices and a slowing economy. They are also the primary source of the potentially disastrous capital flight from the region, which is being orchestrated by the US to destabilise its enemies and for its own benefit. Only by directing their levels of investment can growth be resumed. In some cases taking ownership of some of these banks and firms can the governments continue with their policies of economic and social transformation.

Renewed, increased austerity will only produce a worse result

.782ZRenewed, increased austerity will only produce a worse resultBy Michael Burke

The scale of cuts set out in George Osborne’s latest Autumn Statement are so large that they are quite unfeasible without a fierce attack on public spending, services, jobs and pay over the next five years. Even in the likelihood that targets are missed the effect will be to deepen austerity and permanently embed it in the economy.

The Office for Budget Responsibility (OBR) forecasts the level of austerity in the next five years will be much worse than the last five. The OBR is extremely poor at economic forecasting as it shares the Treasury’s flawed economic model. It also consistently paints a favourable picture of the outcome of all government policies. Even so its closeness to government means that it is well placed to understand government intentions. It projects further cuts to government current spending equivalent to 4.8% of GDP in the next parliament. This compares to 3.4% of cuts in current spending under the Coalition. This is shown in Fig.1 below. In cash terms the cuts will increase from £35bn so far to another £55bn in the next parliament.

Fig.1 Actual & Projected Change in Government Current Spending, % GDP
Source: OBR

The government claims that certain key items of spending have been ‘ring-fenced’, which in reality means capped. The key capped items are spending on pensions, education and the NHS. As Fig.1 shows this still means education and NHS spending are falling as a proportion of GDP even though the population is both ageing and growing. The real education and health spending per pupil or per patient is falling, hence the rising waiting lists in both areas.

The Institute for Fiscal Studies suggests that the capping of these items means that other items in the budget will be cut by up to 40%. In previous austerity measures the scope for cuts was facilitated because of items of highly beneficial but non-essential services built up over previous decades. But the cuts to youth services, day care for the elderly, closures of public services have all nearly run their course. They have been highly damaging but now essential services are the sole real target for cuts.

The increased austerity totals outlined in the Autumn Statement will be much greater than the austerity to date. Their effects will be magnified because essential services are the main target for the cuts. They cannot be achieved without a ferocious attack on public services, public sector pay, jobs and pensions.

Outlandish assumptions

In addition to cuts in government current spending the OBR projection is that government investment will be cut further. Under the Coalition public sector investment has fallen from 3.2% of GDP to 1.5%. The OBR projects it will now fall to 1.2% of GDP in future years.

SEB has previously shown that business investment follows government spending and investment with a time lag. The false Treasury/OBR framework is that the state is an obstacle to the private sector. So, the OBR projects a sharp rise in business investment over the next 5 years, much faster than the recent period when activity is usually strongest in the recovery period. This is despite the fact that government spending is cut more deeply. The OBR forecasts for business spending are shown in Fig. 2 below and are compared to previous recessions.

Fig.2 Business Investment in Three Post-Recession Periods, OBR Projection

This surge in business investment (exceeded only by the unsustainable ‘Lawson boom’ of the 1980s) is projected to arise even though there is simultaneously a forecast profits squeeze. According to the OBR the Gross Operating Surplus of firms will grow by just 4.1% over the next 5 years in nominal terms. After inflation the real terms level of profits will fall. By contrast the Compensation of Employees is projected to rise by 11.1% over the next 5 years. Therefore both the wage bill and the additions to new capital will exceed the growth in the operating surplus. The profit rate will fall as a result.

These are simply outlandish forecasts. As firms invest in anticipation of increased profits the OBR forecasts are wholly unfeasible. This rise in business investment is central to the OBR’s projection of moderate but sustained growth, along with increasing household debt. Even so, its forecasts show a significant slowdown from current growth rates. The 3% growth in GDP this year is the best of the recovery even on the OBR’s rose-tinted view. In reality cuts on the scale envisaged would risk a much deeper slowdown or even recession.

Political impact

Even if the government/OBR forecasts for the scale of the cuts prove to be unworkable they amount to a plan for permanent austerity, of ever deeper cuts. They are also a Tory trap for Labour, which has said it will also aim to balance the budget without challenging the framework that it is the investment strike and weak growth that causes the deficit.

Prior to the 1997 election New Labour signed up to Tory spending plans in the first two years. Politically the effect was that New Labour immediately lost 1.5 million votes in that post-election period, a third of the total votes lost over 13 years in office which ended in defeat in 2010.

Currently a Labour-led government is in no position to lose 1.5 million votes after May 2015. But the economic situation is fundamentally different to the position at the turn of this century. Increased government spending cushioned British growth from the general downturn in the industrialised economies in 2000. As SEB has previously shown, this reversal on spending was very partial. But with the tailwind of global recovery after 2000 economic crisis was averted. It was the stagnation of living standards which caused the attrition of a further 3 million votes for new Labour over the next decade.

This situation is very different. With a commitment to balance the budget by cuts, there is no scope to increase spending in the middle of the next parliament. The global economy is unlikely to provide as much support as most forecasts anticipate a slowdown. Crucially, living standards are not stagnating but declining for the overwhelming majority of the population. Without reversing policy abruptly this fall will in living standards will continue. Renewed austerity will accelerate the decline. The economic and political consequences are easy to foretell. If pointers are needed the political and economic fortunes of the current Socialist government in France can provide them.

New Labour spent less than Thatcher. That was part of the problem

.388ZNew Labour spent less than Thatcher. That was part of the problemBy Michael Burke

In all the commentary related to Gordon Brown’s decision to step down as MP there is one central myth that has been retold almost without any challenge. This is the idea that his excessive public spending was responsible for the economic crisis and/or the surge in the deficit on the public finances.

It is important to debunk this myth not primarily for reasons of establishing the historical record. The more important task is to puncture the myth that the crisis was caused by the public sector because this is used to justify the continuation of austerity measures and prevents any discussion of the real causes of the crisis or its remedies. The actual cause of the crisis was an investment strike by the private sector, which has not been broken.

The record

The actual position is that New Labour cut government spending dramatically. It did the same to tax revenues. It was the crisis which reversed that as the private sector investment strike both caused unemployment to rise and so pushed up government spending and lowered tax revenues (income tax, VAT, corporate taxes, and so on). But even then, government spending rose to only the same level as under Thatcher.

The trends in public sector revenues and expenditures as a proportion of GDP are shown in Fig.1 below.

Fig.1 Public sector revenues and expenditure % GDP

Any deficits under New Labour prior to the crisis are therefore attributable to the very low level of tax revenues that were gathered.

The detailed comparative record is set out in Table 1 below (based on UK Treasury data, which is now presented by the Office for Budget Responsibility).

Table.1 Average Spending & Tax Receipts Under Four Prime Ministers
Source: OBR * Last year only

The low-point for spending in this period examined was under Blair. It equalled the low-point in spending recorded by the Tory austerity government of the 1950s.

Uninterrupted decline

It is evident that under New Labour there was room both to increase taxation and spending. Fig.2 below shows the level of government investment as a proportion of GDP. OBR forecasts for future years are included.

Fig.2 Government Investment, % GDP
Source: OBR

In the mid-1970s the right wing leadership of the Labour Party led by Callaghan and Healey manufactured an entirely fake crisis of government borrowing with the connivance of the IMF. The purpose was to launch an attack on public spending and government investment. This became explicit policy (justified with all sorts of monetarist nonsense) under Thatcher. There has been no decisive break from this policy framework in the period since.

This policy has been disastrous. British growth was regarded as relatively very weak in the post-World War II period up to the mid-1970s. The process of cutting public spending, cutting public investment, deregulation and privatisation actually lowered growth considerably. In the years between 1948 and 1981 the economy grew by 147%. Despite the boon of North Sea oil, GDP grew by just 110% in the following 32 years.

Key to this decline was the decision to slash public investment. It is driven by the belief that, if the state’s role in the economy is reduced the private sector will take its place, and in a more efficient manner. New Labour extended this policy. The result was that private sector freedom did not lead to increased investment but to increased speculation in areas such as housing. The whole history of this policy has led to the current crisis.

The Tory-led Coalition has continued this policy in a very aggressive way. Public spending has been cut and public investment has been slashed. As previously this will not lead to increased investment or prosperity. Instead, as already noted, financial bubbles and crashes are what happen when the private sector is in charge.

Latin America Conference 2014

pm Saturday, November 29th

Congress House
Great Russell Street London WC1B 3LS

This years Latin America Conference brings together political leaders, trade unionists, NGOs, academics & progressive movements to explore recent developments across the region, along with films, music and exhibitions showcasing Latin American culture.

With special guests:
• Aleida Guevara, daughter of Che
• Juana Garcia, Venezuelan Women’s Ministry
• Alicia Castro, Argentinian Ambassador
• Guillaume Long, Senior Ecuadorian Government Minister
• Guisell Morales Echaverry, Nicarguan Charge d’Affaires

Plus:
• Miguel Angel Martinez, former Vice-President, European Parliament
• George Galloway MP
• Chris Williamson MP
• Christine Blower, NUT General Secretary
• Kate Hudson, CND
• Andy De La Tour, Actor
• Tariq Ali, writer
• Owen Jones, writer

And films, stalls & discussion on topics such as:
• Cuba: building a better world under the eye of the empire
• After Chavez – the Empire strikes back in Venezuela
• Nicaragua, 35 Years on – the second Sandinista Revolution
• For Peace, Development & Progress – the new Latin America in the World Today

What do Britain’s private sector firms contribute?

.708ZWhat do Britain’s private sector firms contribute?By Michael Burke

The main factors that account for economic growth are increases in the workforce or in the amount of productive capital in the economy. A far smaller contribution is made by improvement in productivity as a result of innovation, which is known as Total Factor Productivity.

Since mid-2009 the British economy has grown. But this is wholly accounted for by growth in the workforce, which made up of both an increase in the number of people in work and in the number of hours they work. As a result the average person in work cannot experience any improvement in living standards as economic growth is simply made up of more people working longer hours. Worse, those on very high pay, senior executives and shareholders, have claimed any benefits of that moderate growth in the British economy. Average real pay continues to decline.

The missing element in Osborne’s so-called recovery has been growth in productive investment. The ONS chart below shows the level of Net Fixed Capital Formation in the British economy from 1999 to 2013 as a proportion of GDP. Usually Gross Fixed Capital Formation (GFCF) is the main indicator of investment that is discussed. But Net Fixed Capital Formation deducts the capital consumed in the production process itself. While GFCF includes replacement of machine tools, or software and repairs to a factory, NFCF is a measure of only the net addition to new machine tools, software or factories after any replacements have been deducted.

NFCF therefore measures the addition to the accumulated stock of capital. (Unfortunately it also mixes together productive capital, such as machinery, with unproductive capital such as housing, but this failing cannot be addressed in this piece). The chart also shows the contribution to NFCF from each sector, non-financial firms, financial firms, government and households.

Fig. 1 Net Fixed Capital Formation, % GDP
Source: ONS

The data is worth examining in detail. The net contribution of financial firms can be disregarded as it is negligible in all cases. But it is also clear that the contribution of non-financial corporations (NFCs), i.e. private companies, has been far from overwhelming.

Table 1. Contributions to Growth in Net Capital Stock by Sector, % GDP
Source: ONS

In most years before the crisis the net contribution from non-financial firms was matched or surpassed by the contribution from households (and the non-profit sector NIPISH). The strongest year for the net growth in the capital stock was 2004, when the greater role was played by government and non-financial firms contributed just one quarter of the total growth. But this increase in government spending encouraged the private sector and the following year saw an increase in the contribution to NFCF by private firms. But from that point onwards until 2009 government NFCF was once again reduced and in turn, with one year time lag, companies duly cut their own level of investment. With a time lag, companies also followed when government increased its investment again after 2008. Yet non-financial firms never contributed as much as half of the net growth in the capital stock in any year over the period.

Outlook

The coalition government has been claiming that it has overseen a revival of the British economy, including business investment. But the total proportion of NFCF is barely changed from the crisis year of 2008, along with the contribution from non-financial firms. In reality, it was the modest increase in government net investment in 2009 which rescued the economy and has been responsible for well over half the growth in net investment since. Non-financial firms have contributed less than a third of the NFCF over the same period. Yet the Coalition cut the level of investment it inherited from Labour and has only increased it modestly to avoid the political consequences of a renewed recession.

Over the longer-term Britain has a very low level of net capital formation, less than 2.5% of GDP at its recent high-point, which condemns the economy to slow growth. Even among the Western economies that have experienced a decline in growth rates over the medium term, Britain has had one of the lower levels of NFCF. It is notable too that the US has among the weaker levels of net investment growth since 2006, which belies notions about a US industrial renaissance.

Fig. 2 Net Fixed Capital Formation in Selected Economies, % GDP
Source: ONS

Unfortunately, the Thatcherite and Reaganite notion of the ‘state getting out of the way of the private sector’ still dominates thinking in most Western economies. This turns reality on its head. Private firms are an important but minor player in the growth of the net stock of capital. They are led by the activity of the government. This was decisive during the crisis and there is no prospect of a return even to previous levels of British growth if it is mainly dependent on the contribution of private firms. The austerity consensus remains that government must cut back while we await the decision of private firms to increase their investment. This will condemn the economy to prolonged stagnation.

British firms’ cash hoard is over £500bn

.520ZBritish firms’ cash hoard is over £500bnBy Michael Burke

The source of the current crisis is the unwillingness of private firms to invest. Instead, they are hoarding cash that could otherwise be invested. The latest data shows that this cash hoard stood at £501.9 billion at the end of 2013. It has almost certainly risen since.

The latest ‘flow of funds’ data from the Office for National Statistics (ONS) provide comprehensive data for the financial flows between each sector of the economy. They show how the cash mountain has been created. Via the banks, these data show how the incomes of firms (mainly profits) or of individuals (mainly wages) can become savings and may be used for investment.

If a capitalist economy is functioning in the textbook manner, firms will generate profits which they use for their own investment. Through bank borrowing they will also be able to use the savings of private individuals to supplement that investment. It is the supposedly efficient and large-scale way that this takes place that gives the capitalist economy its particular power, and the pre-eminence of the private sector within that, including the banks.

But this is not what is happening in the British economy. The ONS chart below shows the savings and investment levels private non-financial firms (all private corporations excluding banks, insurers and so on, or PNFCs). These are shown from 1997 onwards as a proportion of GDP.

Fig.1 Net lending and investment of PNFCs as a proportion of GDP 
Source: ONS

Over a prolonged period from 2001 to 2013 private firms in Britain have been net savers. Far from borrowing from another sector such as households (or from overseas, or government), private firms have been saving not borrowing. The peak level of this net saving was 4.3% of GDP in 2011. The recent high-point for firms’ borrowing was a not very high level of 2.8% of GDP in 2000. The difference between those two levels is 7.1% of GDP. This is significantly greater than the actual annual contraction in output during the recession and entirely accounts for it.

At the same time private firms have been cutting their levels of investment. Firms’ productive investment (Gross capital formation) peaked at 12.4% of GDP in 1998. It fell to 7% at the low-point of the recession in 2009, and the rebound since has only been to 9.2% of GDP. This is actually below the level of capital consumption in the economy (the capital consumed in the course of production). As a result British firms are not net producers of capital.

It is the savings of private frims which have produced the cash mountain. The growth of the cash hoard is shown in Fig.2 below both in terms of billions of pounds and in propprtion to GDP.

Fig.2 The cash hoard of British firms

A number of reasons have been advanced for the growth in the cash mountain, including increasing complexity of global supply chains, greater uncertainty and other factors. They are generally unconvincing, not least because the growth in the cash hoard has coincided with both record shareholder returns and senior management rewards.

Companies in Britain and in the Western economies generally are content to retain or even increase high debt levels in order to fund share buybacks and extraordinary boardroom pay. They are not prepared to invest even their own profits, much less borrow to invest.

The cash hoard is directly related to profitability. Firms will not invest while they do not anticipate sufficent returns on that investment. As a result, the cash hoard will grow until they do.

Yet it is clear that the idea that ‘there is no money left’ for investment is false. The money is simply in the hands of those who refuse to invest it. What is required are measures that will wrest it from them in order to fund investment.

There is a ‘magic money tree’ – it’s investment

There is a ‘magic money tree’ – it’s investmentBy Michael Burke

Supporters of austerity have long argued that there is no viable alternative because of persistent government deficits and rising debt. David Cameron put it starkly arguing that ‘there is no magic money tree’.

However these assertions contain two important fallacies. First, it is evident that, if government is increasingly indebted it must be the case that the private sector is also an increasing owner of that government debt- government cannot be a net debtor to itself. Therefore rising government debt represents a transfer of incomes, from the public sector to the private sector.

Secondly, economies can grow. Otherwise human society would still be in its most primitive phase. Therefore there is no fixed amount of output in the economy, or the monetary denominator of that output.

IMF answer

The question posed is therefore, how can a cash-strapped government grow the economy and improve its own fiscal position? The IMF has arrived at an answer. In the latest widely-read World Economic Outlook (WEO), the IMF devotes an entire chapter to the merits of public investment in infrastructure, which it defines as transport, power and other utilities and communications systems. The paper ‘Is it time for an infrastructure push? The macroeconomic effects of public investment’ can be found here (pdf).

Investment is one of the essential components of growth. Private sector investment is driven by the anticipated profit, but it has no magic wand to conjure returns from investment which the public sector does not possess It is possible for government to benefit from the returns on investment in the way that the private sector can. In fact there are additional returns on investment to the public sector that are not available to the private sector at all, in the form of increased tax revenues and lower social welfare payment from increased economic activity.
The key points of the IMF research can be summarised as follows:

  • The stock of public capital, which is mainly responsible for total infrastructure, has declined across all categories of economies over the last three decades
  • There is now a substantial shortfall in both the quantity and quality of public capital
  • There are very high returns available to the public sector from investment in infrastructure
  • In periods of low growth the immediate effect of an increase in investment in infrastructure is a return of one and half times the initial investment, which rises to three times over the medium-term
  • The positive effects of investment are larger when they are financed by debt rather than by budget-neutral cuts elsewhere
  • The positive effects are also larger when they are supported by monetary policy
  • There is little or no evidence that the government’s cost of debt increases when debt is used to fund infrastructure investment
  • In terms of what the IMF calls ‘emerging markets’ this means that the effects of investment are far higher when funded by international loans, rather than transfers from other parts of national budgets (the so-called ‘fiscal policy rule’ usually demanded under IMF country programmes).

The research paper also presents a stylised version of its results for the advanced industrialised economies in the current phase of the economic crisis. The results are shown for the change in GDP and the change in government debt as a percentage of GDP arising from a 1% increase in public infrastructure investment, in Fig.1 below (data from Fig.3.9 in WEO).

Fig. 1 Effects of a 1% GDP increase in public infrastructure investment
Source: IMF

The central estimate is that there would be an immediate increase in GDP and an immediate decrease in government debt arising from infrastructure investment, and that these accumulate over time. By the end of the period 2023 the research estimates that a 1 per cent of GDP increase in public infrastructure investment would raise GDP by 2.8 percent and that government debt would have decreased by 1.75 percent.

Although the IMF does not do so, the same logic could be applied to any investment which increases the productive capacity of the economy, most especially education. Public investment produces growth, which produces lower debt and deficits. Similarly, the IMF research does not explore the mechanisms by which this can be achieved. In those economies where there is a greater weight of public sector corporations, where firms and banks are under public control, they can be a direct conduit of increased state investment. The greater the weight of public corporations, the greater the government’s ability to both increase the level of investment and to regulate it.

What’s stopping them?

IMF research papers are often regarded as very authoritative, but they are not uncontroversial. Much earlier in the current crisis another WEO research chapter (‘Will it hurt?’) argued that austerity policies would be hugely damaging, depress growth and so prevent any significant improvement in government finances. This judgment has been demonstrated to be essentially correct.

Yet austerity has been implemented in most advanced industrialised countries. The effects have been so negative that for many this is the weakest recovery on record, government debt burdens have hardly lifted and now many commentators, the IMF included, are concerned about the prospects for a renewed slowdown.

Neither can there be any confidence that the most recent research will lead to a sharp increase in public investment. The key obstacle to that is hinted at in the IMF research paper. There are a number of references to the impact on private sector investment arising from an increase in public investment (‘crowding out’ effects), even though these are generally downplayed.

This might seem odd. As the authors note, across all types of economies the bulk of investment in infrastructure is made by the public sector. There is an infrastructure deficit and only the public sector can reasonably be expected to fill it. Furthermore, there is a widespread insistence that reducing the level of public debt and deficits must be the overriding or even sole objective of economic policy. As the IMF research shows public infrastructure not only increases GDP but also lowers government debt. Under these circumstances, the marginal impact on private investment levels ought to be immaterial.

However, the entire austerity policy has not delivered growth or improved government finances, exactly as the earlier IMF research warned. The governments continuing to pursue it, as in Britain, are not foolish. Austerity has another purpose. This is to restore the rate of profit for firms. If large scale public investment in infrastructure risks even a minimal reduction in private investment (as the IMF says is possible, but not likely under current circumstances) then it will be fiercely resisted by those firms and those acting on their behalf.

This explains why political parties who talk about growth and deficit-reduction are wedded to an austerity policy which delivers neither. It also explains why all the forces arguing for an end to austerity and for state-led investment should expect a long struggle ahead.

Productive investment has not increased, so there is no sustainable recovery

Productive investment has not increased, so there is no sustainable recoveryBy Michael Burke

The latest GDP data showed that the British economy is a little stronger than previously thought. The economy is now 2.6% above its previous peak in the 1st quarter of 2008 and surpassed that peak in the 3rd quarter of 2013.

However, the fundamental character of the current crisis is unaltered by the revised data. The Office of National Statistics (ONS) is correct to state that, ‘The worst recession since our records began in 1948 has been followed by the weakest recovery’. The path of the current recovery is shown in Fig.1 below, an ONS chart which compares the level of GDP in previous recessions.

Fig.1 GDP levels (quarterly) from peak for previous and latest economic
Source: ONS

This very weak recovery is also confined to the services sector of the economy. All other sectors of the economy, manufacturing, production and construction remain in a slump. This is shown in Fig. 2 below, which records the change in the sectors of the economy from the beginning of the recession.

Fig. 2 GDP levels (quarterly) for output components
Source: ONS

It is clear from this chart that there was a severe ‘double-dip recession’ caused by austerity which affected the productive sectors of the economy excluding services. A number of service industries were boosted by a combination of ultra-low interest rates and specific measures adopted by the government to boost consumption. The industries to benefit included finance, and retail and business services. Far from a ‘march of the makers’ promised by Osborne, the current situation is repeat of the errors of the Lawson Boom and the ‘candy-floss economy’, on a much weaker basis. The former Tory Chancellor argued that it was immaterial that manufacturing was collapsing under Thatcherism as long as there were overseas buyers of any good or service produced in Britain (including candy floss, in reality financial services). This was before the boom turned to bust.

The disparity shown in the different sectors of the economy is a function of the great divergence in the components of GDP. All the main components of GDP have now surpassed their level when the recession began in 2008 except for investment. Household consumption, government expenditure and net exports are all higher, only investment (Gross Fixed Capital Formation, GFCF) remains below its previous peak. The change in GDP and its components in the recession is shown in Fig. 3 below.

Fig.3 Change in Real GDP & components since the recession began
Source: ONS

Key parts of the service sector can grow without significant investment, at least for a period. Industry, manufacturing and construction cannot. Investment is the main brake on the economic recovery. It is not the case that the crisis is caused by a deficiency of ‘demand’. Both household and government consumption have risen but investment is still below its previous peak. Previously, the decline in business investment was mainly responsible for the decline in GDP. But that is no longer the case.

Business investment declined far more sharply than the economy as a whole, down 23% from the peak to the low-point in 2009, compared to a 65 decline for GDP. But it has now made a feeble recovery in line with GDP.

Now it is government investment which accounts for the decline in fixed investment. Even taking into account the highly seasonal variability in government spending, the current level is 15.5% below the peak. The absolute decline (not taking account of seasonal variations) is 54%. The change in real business investment and the main component of government investment (not including investment by public corporations) is shown in Fig. 4 below.

Fig.4 Real Business and Government investment, GFCF
Source: ONS

This illustrates a central plank of the austerity policy. The decline in business investment proceeded the recession, driven by a declining rate of profit. (This point ought to be wholly uncontroversial as even the mass of profits fell in nominal terms at the beginning of 2006). After the fall in profits in 2006 the level of investment in the productive sectors of the economy began to decline and then fell rapidly producing the recession. For the period which includes most of 2006 and 2007 this decline was masked by the last stages of a housing and financial bubble. The level of real investment in the productive sectors is shown in Fig.5 below.

Fig. 5 Real productive investment
Source: ONS

This important decline in the productive capacity of the economy is masked by the statistical practise of referring to Gross Fixed Capital Formation in its entirety, which includes both productive investment and other large items such as residential investment and the transaction costs of investment in buildings, including estate agents, surveyors and the like. While these may be necessary and can provide a social good, they do not increase the productive capacity of the economy.

None of the productive sectors has yet seen a recovery in the level of investment from their peak level. Investment in offices and factories is the largest component and is 16.4% below its previous peak, a fall of £23.1bn.

There is therefore no ‘puzzle’ at all to the crisis of productivity in the British economy. The productive capacity of the economy is not growing and may even be declining once capital consumption and real depreciation are taken into account. If more labour is deployed, which is the case currently, output can increase. But if the productive capital of the economy is stagnating or even contracting, then this can only be reducing average output per hour. This is the underlying cause of the crisis of living standards and of real pay. Workers are working longer in less productive ways and so are being paid less.

The austerity policy includes a deep cut in government investment with the false assertion that the private sector will fill the gap. Evidently this has not occurred. The fact is that the fall in government investment is now the largest single impediment to recovery. Given the interrelationship between government and the private sector, this will have a depressing effect on private sector investment. The reverse is also true. A large increase in government investment would lead the whole economy to a sustainable recovery.

Is Ireland experiencing a boom?

Is Ireland experiencing a boom?By Michael Burke

The economy in the Republic of Ireland expanded by 1.5% in the 2nd quarter and by 6.5% from the same period in 2013. This leaves the economy well below its previous level but is actually much stronger than the annual growth rates in the same period in Britain’s ‘boom’, of 0.9% and 3.2%.
For a number of decades the Irish economy has grown more rapidly than the British economy and per capita GDP is higher in the Irish Republic. According to the OECD this is true if constant prices and Purchasing Power Parities are used, or whether current levels are used for both.

This relative outperformance is likely to continue in the future. This is because the Irish economy is more thoroughly integrated into the world economy (or, put in classic terms, it has a higher participation in the international division of labour). This is true even taking into account the effect of multi-national corporations booking profits in Ireland based on production that takes place elsewhere.

The British economy too has its own mechanisms for facilitating international tax avoidance, including the network of overseas territories Guernsey, Jersey, Gibraltar, BVI and so on.
Once this ‘soufflé effect’ is removed it is clear that the export of goods from Ireland is a vastly greater proportion of GDP than are British exports. This, combined with the tendency for an increase in the international division of labour, which is expressed as the faster growth of world trade than domestic GDP, means that the Irish economy is set to grow faster than Britain over the longer term.
But faster growth than Britain is a poor yard-stick. It is utterly foolish of British supporters of austerity to gloat over the relatively better performance of the British economy than the French economy. Declining prosperity elsewhere does not constitute economic well-being here.

Similarly, the focus should be on what is the maximum sustainable growth rate for the Irish economy and the mechanisms to achieve that. In light of the Irish economy’s degree of integration into the world economy, the current rebound in Irish GDP falls well short of what is possible or desirable.

A version of the article below first appeared on Irish Left Review under the title Investment Remains the Key to a Real Recovery.

===============================================================

The Irish recession which began in the final quarter of 2007 is the most severe in the history of the state. GDP contracted by 12.1% in a little over two years ending in the 4th quarter of 2009. That slump is not over. The latest data for second quarter of 2014 show that the economy still remains 3.4% below its pre-recession peak. In effect it is likely to take 5 years or more simply to recover the output that was lost in in the slump.

Even then, the economy will remain way below its previous trend rate of growth. This is illustrated in Fig 1 below, which shows real GDP and real GNP from 1997 to the present. The average annual growth rate of the Irish economy from 1997 to 2007 was approximately 6%. Maintaining the trend rate of growth would have led the economy to be approximately 50% larger than it is currently, and there is a danger that this potential is lost permanently.

Fig.1 Medium-Term GDP & GNP

The causes of the slump are very clear. Over the entire period of the crisis the fall in investment more than accounts for the entirety of the decline in aggregate measures of output, either GDP or GNP. GDP in the 2nd quarter of 2014 is still €6.6bn below its late 2007 peak. Investment (Gross Fixed Capital Formation, GFCF) is €14.4bn below its peak. There are other components of GDP which have also failed to recover, notably personal consumption and government expenditure. But even taken together, their combined fall of €10.1bn is less than the fall in investment. The only component of GDP which has risen is net exports. The change in components of GDP is shown in Fig.2 below.

Fig.2 GDP & Components In the Slump
Source: CSO

This data belies the notion that there is an ‘export-led recovery’ under way. Recorded net exports have grown very strongly, up €30.5bn over the period. But only one quarter of this or €7.4bn is a rise in the export of goods. A much larger statistical contribution has arisen from the decline in the imports of goods, down €14.6bn. As both investment and consumption have fallen, this simply suggests that both firms and households have been priced out of world markets by reduced purchasing power. The remainder of the rise in net exports is derived from international trade in services. These are particularly prone to the tax-induced flow of funds that plague the Irish economy and completely distort the economic data. There is little benefit from attempting to unravel them.
More importantly, it is clear that exports have not led a broad-based recovery at all. All the main domestic indicators of activity, consumption, government spending and investment are still far below their pre-recession peaks.

The recovery

The low-point for the Irish economy was reached in the 4th quarter of 2009. There is not yet a recovery. But there is a rebound from that low-point, which has not always made smooth progress. Every year since 2009 has seen at least one quarter of economic contraction. It is hoped that 2014 will be different.

One reason for this volatility in the data is the activity of multinational corporations. For example one large order for aircraft, none of which are produced in Ireland but are booked in this jurisdiction, can provide a large one-off boost to GFCF and to GDP.

The engine of the recovery is also clear if we take the inflection point from the 4th quarter of 2009 to the most recent data. This is shown in Fig.3 below.

Fig. 3 Change in GDP & Components in the recovery
Source: CSO

The rebound in both GDP and GNP since the end-2009 low-point is driven solely by the rise in net exports. Of the €24bn rise in net exports over that period just €8bn is a rise in the net export of goods.
Otherwise there has been no improvement in the other components of GDP even during this phase. Personal consumption and government expenditures have fall by a combined €2bn. Again, this is exceed by the fall in investment, down €2.7bn since the end of 2009.

The motor force of the Irish economic slump has been the fall in fixed investment. Ireland’s openness to the world economy (its high degree of participation in the international division of labour) provides a real benefit to the economy, even if that is vastly overstated in the official data.

But for exports to lead the economy investment must grow. Otherwise Irish goods (and genuine services) become priced out of world markets. The investment strike in Ireland has not ended. Until it does there can be no confidence in the sustainability of any eventual recovery.