Crisis remains an investment crisis

.773ZCrisis remains an investment crisisBy Michael Burke
Prior to the recent G20 meeting leading international economic bodies such as the IMF and the OECD made tentative calls for increased investment, although this was often confused with increased spending. This is a belated or partial recognition of the real source of the crisis in the advanced industrialised countries. In terms of actual changes to policy it seems to have made no impact at the G20 whatsoever.

As the world economy is once more slowing and there are again a series of spurious explanations offered for this, it is worth revisiting the actual causes of the ongoing crisis which first became widely apparent in 2007. In this piece the advanced industrialised countries as a whole will be the reference point, using aggregate data for the OECD. But each individual economy within the OECD simply provides its own unique combination of these common factors, including Britain.

If one word can summarise the entire crisis in the advanced industrialised countries it is: Investment. The fall in Investment preceded the fall in GDP. It was also the largest component of the fall in GDP and it is the sole component which has failed to recover.

These points are illustrated in Fig.1 below, which shows real GDP, Final Consumption and Investment (Gross Fixed capital Formation, GFCF) for the OECD as a whole, using US$ Purchasing Power Parities.

Fig.1

Investment (GFCF) first fell in the OECD in 2008. Both GDP and Final Consumption Expenditure continued to increase and only fell for the first time in 2009. Falling Investment caused the crisis. On a full-year basis the total decline in Investment was 13% from its pre-recession high to the low-point of the recession in 2009. By comparison GDP fell by 3.5% and Consumption fell by 0.3%. The fall in Investment was far greater in proportional terms than GDP or Consumption.

Even though Investment is a far smaller proportion of GDP than Consumption in the OECD, its decline in monetary terms was far greater. From the pre-recession peak to the low-point of the recession Investment fell by US$1.3 trillion (in PPP terms). Consumption fell by US$ 0.03 trillion, or US$30bn, and barely constitutes a blip in the chart above. The fall in Investment was the largest component of the crisis.

Since the trough of the recession in 2009 real GDP has recovered by US$3.95 trillion. In 2014 GDP was US.55 trillion larger than its peak in 2008. Consumption is stronger. It has increased by US$2.17 trillion since 2009 and is now US$2.26 trillion above its pre-recession peak. By contrast Investment has recovered by only US.94 trillion from 2009 to 2014 and it remains US.37 trillion below its 2007 peak, or US$366 billion. The economic crisis in the OECD remains an investment crisis.

Consumption requires Investment
Economics should be the study and practise of achieving the greatest sustainable material well-being of the whole of society. For most of humanity this still revolves around the struggle for food, shelter and clothing. In the advanced industrialised countries, the required quality of those necessities has increased alongside the desire for good health services, education, welfare, access to recreation and leisure, and so on. Unfortunately, for material reasons a great deal of confusion surrounds that goal and the methods to achieve it. 

The (inverted Say’s Law) argument that increased Consumption will lead to increased Investment has evidently not materialised in the current crisis. As noted above, Consumption has increased but Investment has not. This was also the case in the Long Depression at the end of the 19th century as well as in the Great Depression of the 1930s. In both cases Investment continued to stagnate or fall despite a rise in Consumption. Currently we are in a phase of what Marx called the hoarding of capital. Keynes used the terms liquidity preference.

The reason is simple. The advanced industrialised countries are capitalist economies. Capitalism does not exist to satisfy human needs, or the desire for material well-being. It is not driven by ‘demand’. It is driven by profit. Under circumstances where Consumption has recovered, but profitability, or anticipated profitability has not, then Investment will not increase. This characterises the current situation in the OECD economies.

All Consumption of any good or service must be preceded by its production. Any attempt to increase Consumption without increased production simply leads to the creation of debt, a claim on future production. It is unsustainable. The current downturn in the British economy arises because household debt and overseas indebtedness have both increased to unsustainable levels. 

There are two principal methods of increasing production. One is to just get more people into work and/or make them work longer hours for less, or some combination of the two. The other is to increase the productivity of labour through increased Investment, either in the amount or quality of the means of production or through the increased skills of the workforce. The former cannot lead to rising living standards as it relies on working longer for less, and is the path Britain has chosen over the past period. The second method, the increased productivity of labour requires Investment.

Therefore, in order to raise living standards and to sustainably improve both the quality and quantity of goods and services generally available (including housing, health care, education, welfare and so on), it is necessary to increase Investment. Increased Consumption first requires increased Investment.

Levels, ratios and proportions
The Consumption of goods and services is a measure of the material well-being of the population. Yet, there are two main uses of all output, it can either be consumed or invested. So, if it were possible to sustainably increase the level of Consumption by reducing the proportion of the economy directed to Investment and increasing the proportion devoted to Consumption, then the level of Investment should be reduced to a minimum or even zero. In reality, the opposite is the case. The greater the proportion of the economy devoted to Investment, the faster the rise in sustainable Consumption.

Taking just the OECD data cited above, in the period from 2007 to 2014 investment as a proportion of GDP fell to 20.5% from 22.5% in the period 2000 to 2007. Consequently the proportion of GDP devoted to Consumption rose. Yet the level of Consumption increased by a cumulative 18.6% in the earlier period and has increased by just 6.4% in the same 7-period since the recession. The level of Consumption rose more rapidly when it was a smaller proportion of GDP.

This seems to be paradox, in that a falling proportion of Consumption in GDP leads to its faster growth rate. It is extremely important, since the population naturally does not care what proportion of the economy it is consuming, only that its material well-being is rising. But there is no paradox if it is understood that there is no such thing as a Consumption-led economy. On the other hand, as Investment increases the means of production, then the economy as whole can expand with rising Investment. From this expansion of GDP it is possible to increase the level of Consumption.

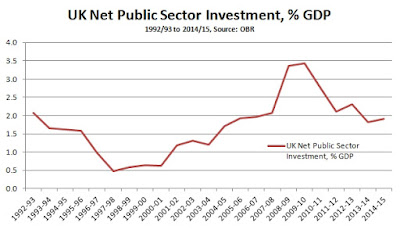
This is why the economic policy framework outlined by Jeremy Corbyn and John McDonnell recently is so important, because it is correct. There is a clear emphasis on borrowing for investment, and that the current or day-to-day budget will be in balance over the business cycle. The National Investment Bank will be the principal vehicle for the investment. This amounts to the public sector having a greater role in the investment function, thereby leading to stronger growth. It is primarily from this source of rising activity that the current budget will be brought into balance as tax revenues increase and social welfare outlays related to poverty and underemployment decline. Over time the entire austerity could be reversed and living standards raised.

It is George Osborne’s refusal to invest, indeed his ridiculous ban on productive investment that will deepen the crisis. The new framework from the labour leadership begins to offer a way out of perpetual crisis and austerity.

Labour now getting it right on economic policy framework

.255ZLabour now getting it right on economic policy frameworkBy Michael Burke
Below is a series of short extracts from recent speeches or articles by Jeremy Corbyn and John McDonnell. They amount to the beginnings of a major campaign to reorient the economic debate in Britain along the correct lines.

Together they are based on the correct economic framework that investment is the decisive driver of economic growth and prosperity. As a result it is logical, as

The mystery surrounding the ‘productivity puzzle’

.006ZThe mystery surrounding the ‘productivity puzzle’By Michael Burke
The latest official data show how far the UK economy is lagging behind other industrialised economies in terms of productivity, in this case output per hour worked. There is too a long-standing discussion amongst economists in Britain about the so-called ‘productivity puzzle’. There is a genuine crisis of productivity in Britain. But in reality there is no productivity puzzle at all. It is easily explained by the weakness of investment. In particular, the recent fall in in the stock of capital in the British economy explains the almost unprecedented decline in UK productivity.

Currently, debate in Britain is dominated by the possibility of ‘Brexit’. This is an error. Under current circumstances, whether Britain is in or out of the EU is a trivial matter in economic terms compared to the crisis of productivity. This is because, contrary to George Osborne (and those on the left who are confused and echo him) it is not possible for consumption, or wages to lead economic recovery. Sustainable increases in consumption require sustainable increases in output. Unless that is achieved by more people simply working longer hours, then it must come via increased productivity. Without it, living standards will fall. This will be the case in or out of the EU.

Yet the latest ONS data show that productivity is falling. It also shows how far the UK economy lags behind other industrialised economies. Fig.1 below shows the relative productivity performance of the UK economy versus the other countries of the G7. According to the ONS, UK GDP per hour worked in 2014 was lower than the rest of the G7 average by 18%. Within that, it was lower than both the US and France by 31% and lower than Germany by 36%. The sole G7 economy whose productivity is lower than the UK’s is Japan, which has been stagnating for 25 years.

Fig. 1 Productivity Trends in the G7 Economies
 
 
This relative weakness is not confined to most of the G7. According to the ONS, UK productivity also lags that of Spain by 5%, Ireland by 30%, Belgium by 34% and the Netherlands by 45%.
 
The effects are twofold. If UK productivity is stagnating or falling, so will living standards. If relative productivity is declining the British economy will be less able to sell goods abroad, and its domestic industries will increasingly collapse through under-competitiveness. This is what is currently happening to the steel industry, for example.
 
The ‘productivity puzzle’
 
The purpose of all analysis or commentary should be to illuminate what is otherwise hidden or obscure. But economics differs fundamentally from the natural sciences in this key respect. No physicist has an interest in obscuring or denying the fundamental laws of physics, or in basing analysis on anything other than fundamental laws (although there is a strong interest in revising or reassessing them in light of new data).
 
However, in economics there are vested interests at work, social classes, whose enrichment or otherwise depends on economic outcomes. Therefore there is a very great material incentive to falsify or obscure the fundamental forces at work in the economy. This is why the fall in productivity has been a ‘puzzle’. Analysts and commentators have a false understanding of the fundamental laws of economics and attempt to fit empirical facts such as falling productivity into that false framework.
The official discussion of the crisis in productivity began with the Office of National Statistics (ONS) in 2012 and was later taken up by the Bank of England and many others. The timing was not coincidental as what had been a very weak recovery in productivity started to go into reverse from 2012 onwards. Productivity actually fell. This was by the worst performance for productivity of all recessions in the post-World War II era. It is almost unprecedented coming out of recession as Fig.2 below shows.
 
Fig.2 Productivity (output per hour) trends following recessions
Source: ONS
 
The argument has been advanced that the crisis in productivity reflects the changing composition of output, with the decline of relatively high productivity sectors and the increase of low productivity ones. Specifically, it is said that the decline of North Sea oil output, as well as the crisis in financial services have depressed productivity while the allegedly low level of public sector productivity has the same effect. Using ONS data is it easy to refute these claims (Table 1 below).
 
Table 1
* Workforce jobs figures, benchmarked to Labour Force Survey totals
Source: ONS
 
North Sea oil output (under Mining & quarrying) is the most productive sector of the economy, with output per hour worked 12 times greater than for the economy as a whole. It fell 7.3% during the recession, slightly more than the economy as a whole (since revised upwards). But as it accounts for just 2.7% of all output, arithmetically it cannot be responsible for the weakness of productivity as whole
 
The output of the finance sector is a very large component of the British economy, whose measured productivity level is approximately half as great as the economy as a whole. But its output fell slightly less than that of the economy, so its decline cannot be responsible for the productivity crisis.
 
The public sector is also widely held to be a low productivity sector, although measuring outputs from sectors such as health or education is done at market prices, which almost certainly undervalues them. The output of this sector initially rose during the recession, which is natural to cope with a rising population. But the total economy productivity crisis persisted after the recession and deepened from 2012 onwards. The combined output of the civil service, health and education sectors have all risen since then by a combined 5.4% between 2009 and 2012, according to ONS data. At the same time the public sector workforce has shrunk by 8.9% because of the austerity policy. There has therefore been a significant increase in public sector productivity, outstripping all other sectors of the economy.
The productivity crisis is not caused by the changing composition of output. It is a crisis of the private sector and embraces all sectors.
 
Much of the confusion on the source of the productivity crisis arises from an incorrect economic framework. One of the clearest expressions of this misunderstanding is as follows:
 
“Ever since the industrial revolution, economic growth has rested on the firm foundation of better use of buildings and machines and improvements in the level of output for every hour worked.” Chris Giles, Economics Editor of the Financial Times, Solving the productivity puzzle is key to government finances
This is the view that Total Factor Productivity (TFP) “the better use of building and machinery….” is the driving force behind economic growth. But this proposition is ridiculous when set in this historical context. The driving force behind economic growth is not that better use has been made of buildings and machines since the industrial revolution, but that there have been vastly more buildings, machines and other contributors to the productive capacity of the economy since that time. According to Bank of England data (Three centuries of economic data) from 1850 to 2000 the accumulation of productive capital has been twice as fast as the growth in output. This is entirely in line with the analysis of Adam Smith and Marx, who respectively argued that the ‘rise in stock’ or the ‘rising organic composition of capital’ exceeds the growth rate of output itself.
 
It is also not possible to explain the uniquely poor performance of UK productivity by reference to TFP or ‘better use of buildings and machinery’, as in a modern economy businesses based in Britain could simply learn those techniques and/or buy the technology from overseas to make better use of their existing stock of productive capital.
 
The reason for the calamitous decline in UK productivity is because it has been reducing the existing stock of capital in the economy.
 
Scrapping productive capacity
 
It is extremely rare for the level of productive capital to decline. The Bank of England data noted above records only two instances since 1850 in Britain when the capital stock fell, the first two years of World War I and in the Great Depression.
More usually, the capital stock grows. Indeed it is this drive to accumulate capital for the purpose of realising profits that gives capitalism its dynamic force and its capacity to raise the material level of society. However, all capitalist economies are determined by the realisation of profit, not by the accumulation of productive capacity for its own sake, or to raise the material level of society. Profit is the raison d’être. As a result, if profits are declining, or by scrapping unprofitable plant or machinery profits will increase, it is quite usual for productive capacity to be scrapped. Individual firms do this on a continuous basis. In exceptional periods there may be circumstances when capital in aggregate is being scrapped. This characterises the current period (Fig.3).
 
Fig. 3 UK Capital Stock Index
 
The close correlation between the trend in capital stock and the level of productivity is shown in Fig.4 below. In fact the level of capital stock leads the productivity level by one year, so that the capital stock first fell in 2011 and the first recorded fall in productivity was in 2012.
 
Fig. 4 Capital Stock & Productivity
Furthermore, this outright decline in the stock of capital is unique to the UK economy in the G7 currently. Among the economies for which there is data, since 2010 the US capital stock has risen by 4.1%. In Germany it has increasd by 2% and in France by 1.9%. Italy has increased by just 0.6%, and so is effectively unchanged. But in Britain it has fallen by 2.1%.
 
The relationship between the level of productive capital and the level of productivity is clear across the industrialised economies. If other factors are unchanged, the higher the stock of capital, the greater the level of productivity. This can be illustrated in Fig.5 below, which shows the trends in the capital stock in selected G7 economies.
 
Fig.5 Trends in Capital Stock in Selected G7 Economies
This is almost a mirror image of the trends in productivity shown in Fig. 1 above. Changes in productivity track changes in the productive forces of the economy, led by the stock of capital. Over this period, the US has both the largest increase in capital stock and the greatest increase in productivity. The UK, which had previously been a relatively strong performer both in terms of the growth in productivity and the growth in capital stock, is now the sole economy shown where both productivity and the capital stock are falling.
 
Conclusion
 
There is no mystery around the ‘productivity puzzle’. It is a function of the weakness of UK investment in both absolute and relative terms. The decline in productivity is preceded 1 year by a decline in the capital stock. This declining capital stock is itself an extremely rare event. According to Bank of England data it has only occurred twice previously in Britain since 1850.
 
The puzzle arises only because there is a mystification of the driving forces behind productivity growth and economic growth in general. In the first instance, after the division of labour, growth is driven by the amount and quality of capital in productive in use in the economy.
 
In the UK productive capacity is being scrapped. This is not because there is no unsatisfied demand in the UK economy. On the contrary, there is both a scarcity of necessities, such as in housing and healthcare and other areas, as well as a large trade deficit. The productive capacity is being scrapped because its owners cannot make profits, or do not anticipate sufficient profits in a situation of growing competition and sluggish growth in consumption, for example in the steel industry. To survive and prosper, the owners of the UK steel industry would have to leap towards the front of global productivity or technical quality through very large scale investment and they are unwilling or unable to do so.
 
A reduction in the stock of capital is one way in which capital can overcome declining profitability. Marx identified some of the others as increasing the working day, which is happening in the UK and US but not elsewhere. Other factors which can offset falling profitability are a reduction in the cost of capital goods (the means of production), a reduction of (real) wages, increasing the division of labour through the growth of foreign trade or by boosting profits through increased financial speculation.
 
Many of these factors are at work in a number of countries. But Britain is the only G7 country where the capital stock is actually falling. The other OECD economies where the capital stock has fallen are Denmark, Greece and Slovenia. It is possible Britain may be a harbinger of more general international trends.
 
For now though, this weakness puts the British economy in a uniquely vulnerable position in the global slowdown. So it is no exaggeration to say that under current circumstances the need for state-led investment to rescue the economy and living standards from renewed crisis is more acute in Britain than elsehwere in the G7 economies. When John McDonnell says, “our mantra is investment, investment, investment,” this is exactly what is required to stave off renewed economic weakness.
 

Labour’s economic alternative to the budget should centre on a National Investment Bank

.866ZLabour’s economic alternative to the budget should centre on a National Investment Bank

By Michael Burke and John Ross
Introduction
Labour is now carrying out extremely effective campaigning against Tory policies – on tax credits, on the sweetheart Google taxation deal, in support of the junior doctors and pinning the responsibility for the crisis in the NHS squarely on the Tories. This excellent work needs to continue and be strengthened.
But in the forthcoming budget Labour must also set out the framework for a comprehensive macro-economic alternative to Osborne’s austerity. This article argues why the centre piece of this should be to reinforce the existing pledge to increase infrastructure investment with the establishment of a National Investment Bank.
Osborne left swimming naked as the economic tide goes out
In a famous phrase the American billionaire investor Warren Buffet said of the economy: “when the tide goes out… you discover who’s been swimming naked.” Chancellor George Osborne fits this phrase perfectly. As the world economy slows, with consequent turmoil on financial markets, it is demonstrated that the Chancellor’s claims of ‘economic success’ are entirely bluff.
What Osborne has done in the last six years is to go on an international borrowing binge which failed to correct the basic imbalances and weaknesses in the British economy and he has left it dangerously unprepared for and exposed to the current slowdown in the world economy. Osborne ensured that the average British citizen, and even more the poorest members of society and those who rely on the NHS, pay the price for his failure to confront the key issues in the British economy. His real policy was exemplified in the sweetheart deal for Google, the recreation of the ‘bonus culture’ in banks, in contrast to the attack on the NHS and his attempt to ram through cuts in tax credits. This is the real context for Osborne’s coming Budget.
Instead of the further attacks on living standards and profligate international borrowing the appropriate macro-economic policy framework for Labour would focus on two things.
· First, to address Britain’s chronic investment shortage – only by increasing investment can living standards sustainably rise.
· Second, to prepare contingency measures in the event that the current slowdown worsens.
In contrast to Osborne’s attack on living standards and profligate international borrowing, Labour’s policy of productive investment, led by the creation of a National Investment Bank (NIB), should begin to tackle the basic imbalances in the British economy. The NIB will finance the economic growth that will lead to both rising wages and rebuilding social services, and will prepare Britain for the new international choppy waters it is entering.
In short people will be ‘better off with Labour’.
Osborne’s reckless international borrowing
The key current trends in the global and British economic situation are clear.
The world economy is slowing and Britain is not excluded from this – puncturing Osborne’s claim of ‘economic success’. In line with these economic realities the World Bank has cut its growth forecasts for the leading economies and the Bank of England has cut its growth forecast for the British economy. The British economy has in fact been slowing for some time with 3% growth in mid-2014 declining to 1.9% at the end of last year.
But Figure 1 shows the real basis of even the temporary upturn of British growth – Osborne’s rapidly growing international borrowing which leaves Britain exposed to the new worsening of the international economy.
When Osborne became Chancellor in May 2010, i.e. during the 2nd quarter of 2010, Britain’s rate of net overseas borrowing was an annualised £31.2 billion. By the 3rd quarter of 2015, the latest available data, it was an annualised £70.9 billion. As a percentage of GDP overseas borrowing almost doubled from 2.0% of GDP to 3.8%- as shown in Figure 1.
Figure 1
16 02 15 Chart 1
Under Osborne Britain, as shown in Figure 2, has borrowed an extraordinary £340 billion from abroad – equivalent to nearly one fifth of Britain’s current GDP. Far from being ‘prudent’ the Chancellor has simply financed his so called ‘recovery’ by the most unstable form of borrowing – from foreign creditors.
Figure 2
16 02 16 Chart 2

Failure of investment to recover
Yet despite Osborne’s extraordinary rate of foreign borrowing the Chancellor has failed to correct the most fundamental of all imbalances in the British economy, and the key source of its economic problems such as low growth and low productivity increases – its inadequate investment level.
Despite the inevitable severe initial fall in fixed investment under the impact of the international financial crisis, from 19.0% of GDP in 2007 to 15.6% of GDP when the Chancellor came to office, Osborne has ensured that any economic growth which did occur in the cyclical recovery overwhelmingly went into consumption not investing for the future. Between the 2nd quarter of 2010 when Osborne came to office and the latest data for the 3rd quarter of 2015 in current price terms three quarters of the recovery in output went into consumption and only a quarter into investment. This failure to invest has left Britain both unable to sustain any prolonged economic expansion and exposed to any international economic downturn.
The real Budget choice
The Chancellor claims that he must impose even greater austerity in the March Budget, due to Britain facing a “dangerous cocktail of new threats”. The reality is that it is Osborne’s own policies, his failure to invest, his large scale international borrowing, which are a particularly dangerous liquor in that concoction.
The reality of this ‘dangerous cocktail’ is that the Chancellor is the barman. The British economy is slowing and unprepared for any international downturn because he recklessly promoted consumption, in particular soaring house prices, in order to get re-elected and it is that short-lived mini-boom financed by foreign borrowing which is inevitably fading.
The failure was inevitable because rising consumption without investment cannot be sustained. It simply leads to more debt or a rundown in savings. A sustainable growth in economic growth and consumption must be based on investment. This hard economic reality is the core of Labour’s alternative for a sustainable economic recovery.
Such investment for sustainable economic recovery is precisely what is lacking under Osborne. Since the beginning of the crisis in the 1st quarter of 2008 in inflation adjusted terms consumption has risen by £89.3 billion. Over the same period Investment has risen by just £9.3 billion. It is no surprise therefore that in per capita terms GDP has barely risen at all, or that more people are working longer hours for the same real return on pay. It is almost unprecedented for productivity to stagnate during most of a recovery phase but this is what Osbornomics has achieved because investment has remained so weak.
The Chancellor’s policy of austerity weakened the economy and sapped investment further. Under George Osborne the Government cut its own level of investment. The consequence of Osborne’s economic policies was that productivity actually declined from mid-2011 onwards and had only just recovered in time for the General Election. According to the Office of National Statistics (ONS), “UK productivity in 2014 was lower than that of France, Germany and the US by 32-33 percentage points, and lower than that of the rest of the G7 by 20 percentage points.” Both of these are record gaps in productivity with the rest of the G7. Higher living standards and improved productivity depend on higher investment which Osborne demonstratively failed to produce.
Furthermore, the Chancellor’s “fiscal charter” makes the situation worse. Osborne does not understand the difference between borrowing for investment and borrowing for consumption – something every business and every family understands. By lumping all forms of government borrowing together, and rejecting them all, he would ban a family not only from seeking to pay its electricity or food on credit card borrowing, which is a road to ruin, but also from borrowing to buy a house – a totally sensible objective.
If Osborne were a farmer his fiscal charter would rule he should not invest in a tractor – because it involved borrowing!
‘Extremists’ supporting infrastructure investment
Labour should restore sanity to public finances by clearly distinguishing productive capital expenditure, investment, from current expenditure – consumption. Labour should not borrow over the course of the business cycle for current expenditure. But it will borrow for productive investment – thereby laying the basis for economic growth and rising living standards.
In reality at present particularly favourable conditions exist to borrow for infrastructure spending at extremely historically favourable rates which will boost the productivity of the British economy– as writers such as Martin Wolf, chief economics commentator of the Financial Times and figures such as former US Treasury Secretary Lawrence Summers, have rightly emphasised. Indeed, the words Martin Wolf wrote in the Financial Times on 13 February 2014 require no alteration:
“Does the UK have a sensible strategy for recovery? Just recall: the last time it [the UK] tried the credit-expansion route to growth, it ended up in a huge financial crisis. Why should it rationally expect a different outcome this time?…
An expansion of private borrowing to buy ever more expensive houses is deemed good, but an expansion of government borrowing, to build roads or railways, is not. Privately created credit-backed money is thought sound, while government-created money is not. None of this makes much sense.”1
Or if the chief economics commentator of the Financial Times is a too ‘hard left’ extremist for the Chancellor perhaps he will listen to the words of his former US counterpart – US Treasury Secretary Lawrence Summers:
“The… approach… that holds most promise –means ending the disastrous trend towards ever less government spending and employment each year – and taking advantage of the current period of economic slack to renew and build up our infrastructure. If the government had invested more over the past five years, our debt burden relative to our incomes would be lower: allowing slackening in the economy has hurt its potential in the long run.”2
Labour’s policy of sustainable investment and a National Investment Bank
Labour’s approach is diametrically opposite to Osborne’s. It has repeatedly set out the case for increased public sector investment – which, through economic growth and the well-known ‘multiplier effect,’ will stimulate and not reduce private investment. Labour has correctly stated it will run a balanced budget on current spending over the business cycle. This means the Government borrowing over the course of the business cycle will be exclusively directed towards investment. The Chancellor’s false fiscal charter failure to distinguish current expenditure and investment will be scrapped. The government will borrow for investment – including by creating a National Investment Bank. But current spending on public services would be met from taxation revenues.
This is correct because it is sustainable. Borrowing for investment in some cases, for example on transport or housing, leads directly to revenue. But above all it leads to economic growth and therefore rising tax revenues. As a result, the Government can finance its borrowing from those rising tax revenues. By contrast, persistently borrowing to fund current or day-to-day spending (frequently, and inaccurately described as ‘Keynesianism’) is unsustainable.
Labour’s approach is to increase investment. This will lead to stronger and more sustainable economic growth. The effect on government revenues is twofold. Tax revenues will rise with increased economic activity. At the same time Government outlays will fall as more people are in work and more of those workers are in higher-skilled, higher paid jobs. As a result, the current budget will actually move towards balance.
This is in contrast to austerity, which is the economic equivalent of applying leeches to a very sick patient. This is the reason the Chancellor will again miss his deficit targets in the current Financial Year, the reason why the deficit rose in 2012 as austerity took hold and the reason why the Chancellor is nowhere near eliminating the deficit as he had boasted in 2010. Austerity attempts to shift government debt and deficits onto the shoulders of ordinary people, and so weakens the economy that businesses reduce investment even further.
National Investment Bank
The centrepiece of Labour’s investment policy is the creation of a National Investment Bank. This will invest in key infrastructure projects, renewable energy, transport, affordable rented housing and education. This would be founded by public sector capital and borrow in the financial markets with the implicit guarantee of the UK Treasury.
As a result it will be able to borrow at close to the extraordinarily low interest rate levels currently available to the Government itself. These interest rate levels represent the financial market appetite to lend to Government. Currently, UK Government bond (gilts) yields are less than 1% for 5 year and 1.5% for 10 years. It can even borrow for 46 years at a yield of MINUS 1% on index-linked (linked to inflation) gilts. This represents the desire of long-term investment vehicles such as pension and insurance funds to invest securely over very long maturities and the absence of instruments to invest in.
In these circumstances a refusal to borrow for investment is economically irresponsible and counterproductive. In addition to the beneficial productive effects for the economy there is a clear ‘signal’ from the market that it wants to lend to government. Once more to quote that key member of the ‘hard left’ Martin Wolf from the Financial Times on 17 May 2012:
“With real interest rates close to zero… it is impossible to believe that the government cannot find investments to make itself, or investments it can make with the private sector, or private investments whose tail risks it can insure that do not earn more than the real cost of funds. If that were not true, the UK would be finished. Not only the economy, but the government itself is virtually certain to be better off if it undertook such investments and if it were to do its accounting in a rational way… This does not even deserve the label primitive. It is simply ridiculous.”3
The initial funding for the National Investment Bank, which will play a key role in Labour’s increase in investment, is straightforward. The Government should borrow the capital utilising the opportunity presented by current extremely low interest rates. In more unfavourable circumstances of severe economic downturn Labour would be prepared to use People’s Quantitative Easing, finance created by the Bank of England to finance productive investment as opposed to the bank bailouts it has hitherto been chiefly directed to, but such a policy is not necessary in present circumstances to finance the NIB. Approximately £50 billion should be raised over the course of a parliament to fund the NIB.
This is a substantial amount to fund the initial capital for an infrastructure investment bank. In Germany the equivalent bank is the KfW (originally Kreditanstalt für Wiederaufbau or Reconstruction Credit Institute). The KfW has €21.6 billion of equity capital and total capital (including debt) of €73.4 billion which supports €489 billion in assets (lending to projects). It would take time for the NIB to reach that position, but it shows what is possible.
Crucially, the NIB would be able to use this Government-funded capital to borrow on its own account in the financial markets. Under the arcane rules of Government finances it need not count on the Government’s balance sheet at all, either as borrowing or accumulated debt. As the KfW example shows, it is possible to borrow comfortably around six or seven times the original capital.
Economic Impact
One of the objections to public sector-led investment programmes is that there are no ‘shovel-ready’ projects to invest in – which would itself be a disgrace given Britain’s lack in investment and productivity compared to other countries already noted. But even this argument has collapsed now that the Government has established its own National Infrastructure Commission with a National Infrastructure Plan. No doubt, Labour can set some of its best brains to revising and re-prioritising the Plan in relation to its own economic priorities. But the Plan and the projects are already there. The problem is the Government, because of its essentially exclusive reliance on the private sector, is simply not delivering them on the scale and pace required.
The work of building up the necessary projects for investment, including by the National Investment Bank, could begin immediately and would be well towards the final goal over the lifetime of the parliament. In the first year the NIB could be established and funded, and borrowing begun and projects prioritised for work to begin or increase in the second year. By the end of the current Parliament work could have been under way for a full three years.
In reality, this Government has no intention of following that route. Although it established a minuscule ‘Green investment Bank’ this was a political sop and is being wound up. But Labour could begin the detailed preparatory work now and hit the ground running in 2020. A full four years of productive investment is possible.
In four years a capital programme funded by £50 billion in capital and amounting to £300 billion in total could be well under way. The general economic impact is possible to gauge using the UK Treasury’s own economic modelling. Investment in infrastructure has the effect of raising growth in the short-term and by increasing growth over the long-term through improved productivity. The precise impact varies by sector and by project, but in a range of raising growth by between 1.5 and 1.9 times the initial investment. On average we can say that a £300 billion investment programme will raise GDP by around £500 billion (an approximate average of 1.7 times).
In general, according to UK Treasury models (pdf), every £1 increase in economic output is reflected as a 75 pence improvement in government finances. 50 pence of this arises from increased taxation revenues and 25 pence from lower outlays as poverty reduces and employment grows. Therefore, over time three-quarters of the additional growth produced by the NIB’s investment programme will return to Government in the form of higher tax revenues and lower outlays. This is an improvement of £375 billion (out of £500 billion in increased output) in total government finances over a period of years. Just as the private sector invests for growth and a financial return, so too should the public sector. The difference is that the public sector also enjoys a further financial benefit not available to the private sector; increased taxation revenues and lower social spending outlays.
From these funds, it is possible to increase investment further and to fund the improvement, not the deterioration in public finances. It is possible to upgrade the NHS and improve it, to address the schools shortage and return to free higher education. Social protection can be improved and a decent level of income in retirement provided for all.
The forthcoming Budget will threaten to undermine further the living standards of the overwhelming majority of the population. But it will therefore be an opportunity for Labour to set out a very clear alternative that will begin to reverse that process and raise their living standards. Naturally Labour will have to deal with reversing numerous anti-social policies in the budget but the macro-economic centre piece of its alternative should be the pledge to raise investment, a clear distinction between current and capital expenditure in the budget, and the establishment of a National Investment Bank.
References
1. Wolf, M. (2014, February 13). Hair of the dog risks a bigger hangover for Britain. Retrieved February 20, 2014b, from Financial Times: http://www.ft.com/intl/cms/s/0/1cd67c18-93e6-11e3-a0e1-00144feab7de.html?siteedition=intl#axzz2silAZOQx
2. Summers, L. (2014, January 5). Washington must not settle for secular stagnation. Financial Times.
3.Wolf, M. (2012, May 17). Cameron is consigning the UK to stagnation. Financial Times.

John Rosshttps://www.blogger.com/profile/08908982031768337864noreply@blogger.com3

Better off with Labour – the alternative to Osborne’s cuts

.801ZBetter off with Labour – the alternative to Osborne’s cutsBy Matt Willgress of the Labour Assembly Against Austerity

The following article deals with Osborne’s responsibility for the current slow down in the British economy. The article previously appeared here on Left Futures under the title ‘No hiding place for Osborne’.

*     *     *

The British mainstream media is now so clearly biased in favour of the ruling party it can sometimes seem as if politics is entirely divorced from reality. But reality has a habit of intruding on make-believe. This is the position George Osborne now finds himself in.

In the Autumn Statement, the Office for Budget Responsibility (OBR) ‘awarded’ Osborne £27 billion in lower Budget deficits because of projected stronger growth. The March 2016 Budget is likely to tell a very different story, with growth forecasts slashed. Osborne is likely to admit that the Tory Government will again miss its deficit for the current Financial Year and has, in the words of Shadow Chancellor John McDonnell MP, “been getting his excuses in early.”

In June 2010 Osborne and the OBR projected that the £153 billion deficit would now be eliminated. Yet it only narrowed by £64 billion. Even the OBR’s latest forecast shows the deficit at £73.5 billion for the current year, meaning the deficit is still close half its original size.

The reason for this is twofold: growth has been far below official estimates and cuts don’t lead to savings. Austerity slowed the economy to a standstill in 2012 and then Osborne abandoned new measures austerity measures, instead stoking up consumption and house prices to help get re-elected. Government current spending is also £40 billion a year higher than when the Coalition took office, because austerity increases low pay, under-employment and poverty. At the same time, it is Government investment that has actually collapsed.

Ideological cuts

How could Osborne have got it so wrong?

He is often described as an ‘ideological Chancellor.’ He believes in austerity and shrinking the state, subscribing to the notion that the state impedes growth and that removing its role in the productive sectors of the economy will lead to prosperity. This applies across the board – to education and health, banking as well as energy, water, transport, or house building. He believes his medicine works and is repeatedly surprised when it doesn’t. He is then obliged to rationalise or find excuses for its failure.

This is what led him to a U-turn on growth. But any observer of the economic data would know that the economy was already slowing. To take one example the annual growth rate had already slowed to 2.1% in the third quarter of 2015 from 3% in mid-2014.

Rationalisation of the troubles to come

In his ‘cocktail of negative factors’ affecting the economy Osborne cited the turmoil in the Middle East, the slowdown in China and falling commodities’ prices. All of these are international factors of varying significance. But in truth the continued slowdown in the British economy is mainly home-grown.

Middle East turmoil has been a continuous factor since Britain and the US first began bombing it some years ago. But as it is not new it cannot be responsible for a downturn.

In terms of China, Britain does not export much and very little of that low total is destined for China, just 2% of total UK exports. The Chinese economy has slowed from 7.5% growth to 6.5%. The direct effect on Britain’s growth is therefore negligible.

The fall in commodities’ prices is very significant globally, and depresses Britain’s North Sea oil output. But as Britain is a big net importer of commodities, the collapse in commodities’ prices is a net benefit to the British economy.

Reality intrudes

The responsibility for the slowdown in Britain can be laid squarely with Osborne. He inherited a slow recovery in 2010 and promptly stalled it with austerity. Because the economy was stagnating in 2012 and Tory poll ratings fell, Osborne then stoked rising consumption and house prices in order to get re-elected. That short-lived and unsustainable boom-let which is now running out of steam.

This was predicted by numerous leading economists. Now, Osborne will deepen this slowdown by imposing a second round of austerity. It will have the same effect as the first, although in circumstances of slowdown rather than recovery.

But the political situation has changed dramatically. There can be no blaming the effects of this new crisis on Labour. Instead, Labour now has a leadership utterly opposed to austerity and beginning to advance an alternative to it.

In addition, wider layers of society are drawn into opposition to aspects of austerity. This includes highly skilled health workers. It will increasingly include teachers, students, industrial workers, housing association tenants and many more, struggles that can be linked together through initiatives such as those organised by the People’s Assembly Against Austerity.

Not only is the broad anti-austerity movement is growing, but crucially under Jeremy Corbyn there is now a political leadership in Parliament to offer an alternative policy for Government. The fightback is stepping up – we all have a duty to get involved, both in building the People’s Assembly Against Austerity movement, including its Labour wing the Labour Assembly Against Austerity, and in building Labour’s electoral support for this year’s London Mayoral Contest and the election of a Jeremy-Corbyn led Government in 2020.

See labourassemblyagainstausterity.org.uk and www.thepeoplesassemblyagainstausterity.org.uk for more information and to get involved.

EVENT: Better Off With Labour – The Alternative To Osborne’s Cuts – 9 March 6.45pm, House of Commons.
  Annual LAAA pre-budget event with speakers including John McDonnell MP and Cat Smith MP. RSVP on Facebook at https://www.facebook.com/events/1254712247879119/

Lessons for Latin America from China’s Economic Success

.495ZLessons for Latin America from China’s Economic SuccessBy: John Ross 

The following article deals with the lessons for the Latin American left from China’s unprecedented history of economy growth, poverty reduction, and rising living standards. Its central point is that the Latin American left is rightly proud of the ‘revolution in distribution’ since left wing governments appeared in Latin America. But Latin America has also needs to study the ‘revolution in production’ of China – that is the securing of decades of rapid economic growth which provided the underpinning for prolonged increases in living standards.

The article appeared in English and Spanish for the Community of Latin American and Caribbean States (CELAC) summit. While specific points on the alleviation of extreme forms of poverty apply to developing countries nevertheless the overall economic framework, that state led investment is the key to sustained growth, also applies to Europe.

*   *   *

Latin America in the period led by left-wing governments made a fundamental ‘revolution in distribution’ to the enormous benefit of the continent’s people. As the World Bank analysed in 2013: ‘For the first time ever, a decade of strong economic growth within the region saw employment increase and wage inequality drop, contributing to an unprecedented reduction in poverty and an increase in prosperity for all levels of society… average real incomes in Latin America have… risen by more than 25% since the turn of the millennium. And with the lowest wages increasing considerably faster than the regional average, it has been the poorest 40% who have benefitted the most.’

From 1999-2012, 31 million people in Latin America were lifted out of the World Bank’s international definition of extreme poverty of $1.90 daily expenditure in internationally comparable terms (parity purchasing powers at 2011 prices). In the same period 52 million were lifted out of World Bank defined poverty of daily $3.10 expenditure measured in the same units.

The basis of this tremendous social progress was accelerated economic growth in contrast to the economic catastrophe produced in the late 20th century by neo-liberal policies.

Until 1993 average per capita GDP in developing Latin American economies remained below 1981 levels. By 1998 annual average per capita GDP growth was still only 0.9% – using a five-year average to avoid the influence of short term fluctuations.

Only after Chavez was elected Venezuela’s President in 1998, followed by other left wing Latin American leaders, did economic growth seriously accelerate. By 2007 annual average per capita GDP growth in Latin America reached 2.8%, again taking a five-year average, with faster growth in key countries including Venezuela’s 5.7% and Argentina’s 7.7%. The left wing governments ‘revolution in distribution’ ensured the benefits of this economic growth was shared by Latin America’s population.

But unfortunately recent economic setbacks indicate that this ‘revolution in distribution’ was not yet matched by an equivalent ‘revolution in production’ – an ability to maintain strong positive economic growth in the face of negative world economic trends. Taking the latest available data Argentina’s GDP growth has fallen to 0.5% and Brazil’s is -1.7%.

Due to the consequences of such economic slowdowns right wing forces won Argentina’s recent presidential election and Venezuela’s legislative elections while a (so far unsuccessful) attempt to impeach Brazil’s President is underway. This is particularly serious as such right wing forces present themselves as ‘centrist’ for propaganda purposes but in reality their economic programmes represent a shift towards neo-liberalism – polices which have produced economic disaster not only in Latin America but elsewhere. Failure to maintain substantial economic growth in adverse global circumstances therefore led to highly undesirable setbacks.

I am based in China but follow Latin America closely and have travelled there numerous times including twice for conferences with President Chavez personally. From this experience I believe it is crucial Latin America’s left closely studies China’s economy – not in the sense that China’s model can be mechanically copied, but in the sense that key economic processes operate in it which are equally applicable to Latin America.

China successfully made a ‘revolution in production.’ For nearly four decades China’s economy grew annually at over 8%, taking it from one of the world’s poorest countries to the threshold of a ‘high income economy’ by international criteria. This was the largest ‘revolution in production’ in human history. Even after the international financial crisis produced global economic slowdown, China in 2015 achieved 6.9% growth.

Contrary to US myth, China’s growth did not benefit chiefly the rich but ordinary people. China lifted 728 million people from World Bank defined poverty. In 2015 the average inflation adjusted real disposable income of China’s population rose by 7.4%. This is the type of ‘revolution in production’ Latin America needs.

The differences between Latin America and the ‘China model’ are clear. Modern statistical methods, officially adopted by the UN and OECD, show that fixed investment accounts for over half GDP growth. China’s high investment level explained its rapid growth – in 2014 China’s fixed investment was 44% of GDP. Latin America’s far lower investment level makes it impossible to achieve rapid growth and maintain this in adverse global circumstances – Argentina’s fixed investment level is 17% of GDP, Brazil’s 20%, Venezuela’s 22% – Ecuador, however, had a decisively higher investment level at 28% of GDP. Taking into account capital depreciation the contrast is greater.

Net savings, the finance available for additional investment, is 32% of China’s Gross National Income compared to 7% in Argentina and 5% in Brazil. Some countries, Bolivia and Ecuador, have achieved levels of 15% but this is still below China’s level. With such low levels of fixed investment rapid growth and anti-cyclical stimulus packages are impossible.

The reason for China’s rapid investment growth is clear. China has both a private and a state sector but it is not a ‘mixed economy’ in a Western sense. In Western economies the private sector is dominant, in China there is a ‘dominant position of public ownership’ to use the official formula. In Western terminology China’s model can also be expressed in Keynes’ concepts: ‘the duty of ordering the current volume of investment cannot safely be left in private hands’, there should be ‘a socially controlled rate of investment,’ requiring ‘a somewhat comprehensive socialisation of investment.’

The ‘China model’ did not eliminate the private sector but made state investment the economy’s driving force – with the private sector also benefitting from the resulting growth. It is China’s ability to have a state sector which does not administer the economy but is sufficiently large to maintain and control the economy’s investment level which explains China’s success. It is this model of an economy, which does not eliminate the private sector but is driven by high levels of state investment, that explains China’s rapid growth and differentiates its model from that of most of Latin America.

For economic success, study of China’s ‘revolution in production’ should supplement the ‘revolution in distribution’ of which the Latin American left is so justly proud.

*   *   *

John Ross is Senior Fellow at Chongyang Institute for Financial Studies, Renmin University of China in Beijing.

This article was originally published by teleSUR at the following address:
http://www.telesurtv.net/english/opinion/Lessons-for-Latin-America-from-Chinas-Economic-Success-20160126-0014.html

John Rosshttps://www.blogger.com/profile/08908982031768337864noreply@blogger.com0

¿Qué puede aprender América Latina del crecimiento económico de China?

.787Z¿Qué puede aprender América Latina del crecimiento económico de China?Por: John Ross

En el periodo de gobiernos de izquierda, Latinoamérica logró una ‘revolución de distribución’ fundamental, beneficiando a enormemente a los pueblos del continente.

De acuerdo con reportes del Banco Mundial en el 2013, ‘por primera vez, existió una década donde aumentó el empleo y disminuyó la desigualdad salarial en la región, lo cual contribuyó a una reducción sin precedentes de la pobreza y un incremento de la prosperidad para todos los estratos de la sociedad…los ingresos promedios de Latinoamérica han subido más de 25% en el nuevo siglo. Junto con los ingresos más bajos aumentando más rápido que el promedio regional, es el 40% más pobre que se ha beneficiado más.’ (traducción no oficial)

Entre 1999 y 2012, 31 millones de personas de Latinoamérica han salido de la pobreza extrema, de acuerdo a las definiciones del Banco Mundial de $1.90 diario en términos comparables a nivel internacional (paridad de poder adquisitivo según precios de 2011). Durante el mismo período, 52 millones de personas salieron de la pobreza definida de acuerdo a un gasto diario de $3.10, medido en las mismas unidades.

La base de este enorme progreso social fue un crecimiento económico acelerado, en comparación a la catástrofe económica generada a fines del siglo XX a causa de las políticas neoliberales. Hasta 1993, el Producto Interno Bruto (PIB) per cápita en los países latinoamericanos en vías de desarrollo se mantuvo por debajo de las cifras registradas en 1981. En 1998, el crecimiento promedio anual del PIB per cápita aún era sólo de un 0.9%, utilizando un promedio de cinco años para evitar la fluctuaciones de corto plazo.

Sólo posterior a la elección del presidente venezolano Hugo Chávez en 1998, seguido por una ola de líderes de izquierda, el crecimiento económico tuvo una gran aceleración. En el 2007, el promedio de crecimiento anual del PIB per cápita, de cinco años, había alcanzado 2.8%, un aceleramiento donde se destacan Venezuela con 5.7% y Argentina con 7.7%. La ‘revolución de distribución’ de los gobiernos de izquierda aseguró que los beneficios de este crecimiento económico sean compartidos entre la población latinoamericana.

Desafortunadamente, la adversidad económica ha impedido que esta ‘revolución de la distribución’ no esté acompañada de una ‘revolución de producción’, es decir, la habilidad de sostener un fuerte crecimiento económico en tiempos de tendencias económicas negativas a nivel mundial. De acuerdo a estadísticas más recientes, el crecimiento del PIB en Argentina ha caído a un 0.5% y el de Brasil a -1.7%.

Debido a las consecuencias del desaceleramiento económico, la derecha triunfó en las últimas elecciones presidenciales en Argentina y en las elecciones parlamentarias en Venezuela, mientras que en Brasil, grupos opositores intentan enjuiciar y destituir a la Presidenta.

Esto es bastante grave, ya que mientras que las fuerzas que apoyan estas transiciones políticas se presentan como fuerzas ‘centristas’ para fines propagandísticos, las medidas económicas que implementan son netamente neoliberales y han generado desastres económicos en distintos lugares, no solo en Latinoamérica. El fracaso de mantener el crecimiento económico en un escenario adverso ha desatado estos retrocesos.

Aunque estoy trabajando en China, sigo los acontecimientos en Latinoamérica en detalle, y he viajado allá en distintas ocasiones, incluyendo dos veces para asistir a conferencias con el Presidente Chávez. A partir de esta experiencia, creo que es fundamental que la izquierda Latinoamericana estudie la economía china, no para aplicar de forma calcada el modelo chino, sino para entender que hay procesos económicos claves que operan en él y que se pueden aplicar a Latinoamérica.

China logró exitosamente una ‘revolución de la producción’. Durante un periodo de cuatro décadas, la economía china creció por sobre el 8%, pasando de ser uno de los países más pobres al umbral de ‘economía de altos ingresos’, según estándares internacionales. Esta fue la ‘revolución de producción’ más grande de la historia, incluso posterior a la crisis financiera internacional de 2015, China logró un crecimiento del 6.9%.

Contraria a la típica creencia estadounidense, el crecimiento chino no fue en beneficio de los más ricos, sino de la gente común. China logró sacar a 728 millones de personas de la pobreza, según estándares del Banco Mundial. En el 2015 la inflación promedio, ajustado al ingreso disponible de la población china, subió en un 7.4%. Es este tipo de ‘revolución de la producción’ que necesita Latinoamérica.

Las diferencias entre Latinoamérica y China son claras. Los métodos estadísticos modernos utilizados por las Naciones Unidas y la Organización para la Cooperación y el Desarrollo Económicos (OCDE), demuestran que más de la mitad del crecimiento del PIB per cápita es debido a la inversión fija. De este modo se explica el rápido crecimiento de China: en 2014, la inversión fija sumó un 44% del PIB. La baja inversión en Latinoamérica hace imposible lograr y mantener un crecimiento acelerado en circunstancias adversas: la inversión en Argentina equivale al 17% de su PIB, en Brasil es de un 20%, Venezuela un 22%. Ecuador, sin embargo, tiene un nivel bastante más alto, sumando un 28% de su PIB.

El contraste es aún mayor si se toma en cuenta la devaluación del capital. El ahorro neto, disponible para mayor inversión, suma un total del 32% del ingreso bruto de China, mientras que en Argentina es un 7% y en Brasil es un 5%. Algunos países, como Bolivia y Ecuador, han logrado un 15% pero esto sigue siendo inferior al nivel chino. De este modo, se hace imposible el crecimiento acelerado y paquetes de estímulo anticíclicos, con estos bajos niveles de inversión fija.

La clave del ‘modelo chino’ está claro. China tiene sectores públicos y privados pero no es una ‘economía mixta’, según la definición occidental. En estas economías, domina el sector privado, mientras que la definición oficial china está marcada por un ‘posicionamiento dominante del sector público.’

El modelo de China también se puede expresar en la terminología occidental por los conceptos de Keynes: ‘El deber de ordenar el volumen actual de inversión no puede dejarse en manos privadas,’ es necesario apuntar hacia un ‘nivel de inversión socialmente controlado’, lo cual requiere una ‘socialización un tanto comprensiva de la inversión’.

El ‘modelo chino’ no eliminó el sector privado, sino que hizo de la inversión estatal, su fuerza productiva principal, con el sector privado también beneficiado con el crecimiento. La habilidad de China de mantener un sector estatal que no administre la economía pero que sea suficientemente grande como para mantener y controlar los niveles de inversión económica explica el éxito de China. En este modelo económico, que no elimina el sector privado pero que está guiado por altos niveles de inversión pública, el que explica el rápido crecimiento de China y lo diferencia del modelo de la mayoria de paises latinoamericanos.

Por lo tanto, para el logro del éxito económico, el ejemplo chino de la ‘revolución de producción’ debería reemplazar la ‘revolución de distribución’, la cual, y con justa causa, enorgullece a la izquierda latinoamericana.

John Ross es catedrático emérito en el Instituto Chongyang de Estudios Financieros, en la Universidad Renmin de China en Beijing.

*   *   *

Este contenido ha sido publicado originalmente por teleSUR bajo la siguiente dirección:
 http://www.telesurtv.net/opinion/Que-puede-aprender-America-Latina-del-crecimiento-economico-de-China-20160127-0041.html.

John Rosshttps://www.blogger.com/profile/08908982031768337864noreply@blogger.com0

Osbornomics has failed. Labour can win

.880ZOsbornomics has failed. Labour can winBy Michael Burke
The British economy is slowing markedly. This has almost nothing to do with external forces such as China. The slowdown is a consequence of Tory economic policies which have now failed twice. We are about to begin the third failure in succession with the further imposition of austerity policies. By contrast the economic framework outlined by Jeremy Corbyn and John McDonnell has the capacity to develop into a winning alternative.

The GDP data for the 4th quarter show a marked slowdown in the pace of the growth. Fig.1 below shows the pace of year-on-year growth by quarter. The year-on-year data smooths out its volatility from one quarter to the next. On this basis the growth in real GDP slowed to 1.9% in the 4th quarter of 2015. This is a decline from 3% growth in mid-2014 and the slowdown has been continuous since that time.

Fig.1 Real GDP % Change, year-on-year

This represents a double failure for Osbornomics. As the chart also shows, the economy slowed significantly after the Tory-led Coalition took office in 2010 as the growth rate slipped from 2% to 1%. This was the effect of the austerity policies. 

But the second failure was the so-called ‘recovery’. This was the boost to consumption from 2013 onwards in order to get the Tories elected. It was a classic type of Tory boom (even if it passed most people by). It boosted the price of houses (and so increased consumption) but not house-building (which would require investment). 

All consumption-based upturns fade unless they are least matched by rising investment. This is what is now happening in the British economy. Osbornomics has failed twice; austerity slowed the economy to a crawl and the ‘recovery’ was bound to fade because it was driven by unsustainable growth in consumption. Meanwhile, Osborne has made it clear that he will reimpose austerity measures, this time using the pretext of renewed economic weakness he has fostered! So that is what should be expected in the March Budget.

A recovery in investment remains the key to reviving the economy on a sustainable basis. Osborne previously promised a ‘new economic model’ in 2010, which would rebalance the economy. He argued, correctly, that, “The economics profession is in broad agreement that the recovery will only be sustainable if it is accompanied by an internal and external rebalancing of our economy: in other words a higher savings rate, more business investment, and rising net exports”.

He has failed on all counts. The table below shows these three variables in 2008 and in 2014.

Table 1. Savings ate, Investment & Net Exports 2008 Versus 2014
 

A key symptom or consequence of this fundamental failure is the failure to ‘rebalance’ the output of different sectors of the economy. This is shown in Fig.2 below. While the total level of output is above its pre-recession peak the only sector of the economy which has recovered is services. This is entirely in line with the weakness of savings and investment. Production, manufacturing and construction all require fixed investment to increase, or even to stabilise.

Fig.2 Total output and its components, Q1 2008 = 100
 

Likewise, a rate of investment which is below competitors and which is not recovering presents an obstacle to any sustained increase in exports. The Osborne tactic of boosting consumption in order to get re-elected tends to work in the opposite direction as imports rise faster than exports.

These fundamental failings explain why Corbyn and McDonnell are right to focus on an investment-led recovery. They are also right to borrow for Government investment and to aim for a balanced budget on current spending, financed by stronger growth and, where needed, taxation. 

The failings of the British economy are long-term and since 2010 the Tories have exacerbated them. It is also clear that these myriad difficulties will require both radical and detailed policies from Labour in order to address them. The centre-piece of that programme is a series of policies that will lead to a substantial increase in the rate of investment.

The general significance of China’s discussion on the economy’s ‘supply side’

.482ZThe general significance of China’s discussion on the economy’s ‘supply side’By John Ross

A major discussion is taking place in China on the issue of its economy’s ‘supply side’. Naturally there are aspects of this which relate to specifically Chinese issues. Discussion in China also differs fundamentally from that in the West in that it takes place simultaneously in both ‘Western’ and ‘Marxist’ economic terms. Nevertheless the overall framework of this discussion equally relates to the key issues of economic policy in Western countries.

The article below, which originally appeared in Chinese at Guancha.cn, therefore is simultaneously a contribution to discussion on China’s growth rate targets, and forthcoming 2016-2020 13th Five Year Plan, as well as overall issues of economic growth. It thereby deals not only with specifically Chinese issues but with ‘growth accounting’ as developed in Western economics, the real positions of Keynes as opposed to the confusions of what is generally referred to as ‘Keynesianism’ and the most powerful factors in economic developed. While its specific focus is China this makes clear why the current discussion in China is crucially related to overall questions of economic analysis and theory applying in other countries.

*   *   *

Economic laws are objective – China is no more capable of breaking them than any other country. Consequently, policies which do not correspond to these laws and the forces they analyse simply will not succeed. This is the context for discussion of China achieving ‘at least 6.5%’ growth which is necessary to make the transition to a ‘moderately prosperous society’ by 2020. It particularly applies to some recent discussion which took place in China’s media on ‘supply side economics’.

At one level, for reasons analysed below, this focus on the supply side is a positive break with the confused ideas of so-called ‘Keynesian’ economics imported into China from Western economic textbooks – although in fairness it will be seen that such views are not actually those of Keynes. But unfortunately some of this new discussion entirely fails to accurately understand the very different strength of different factors on the economy’s ‘supply side’ – erroneously proposing policies relying on very weak supply side forces which would therefore make it more difficult to achieve ‘at least 6.5%’ growth. This article’s aim is therefore to simultaneously show why concentration on the economy’s supply side is correct, to analyse accurately the most powerful forces on the supply side using up to date official statistical methods, and examine the conclusions which flow from the relative strength of different factors on the economy’s supply side.

Marxist analysis

Demonstration of why concentration primarily on the economy’s supply is correct can be made in either Marxist or ‘Western’ economic terms. The Marxist one is  more succinct, and will therefore be dealt with first, but it will be demonstrated that analysis in either economic framework leads to the same conclusion.

Marx was unequivocal that production, the economy’s ‘supply side’, was dominant: ‘The result at which we arrive is, not that production, distribution, exchange and consumption are identical, but that they are all elements of a totality, differences within a unity. Production is the dominant moment, both with regard to itself in the contradictory determination of production and with regard to the other moments. The process always starts afresh with production… exchange and consumption cannot be the dominant moments… A definite [mode of] production thus determines a definite [mode of] consumption, distribution, exchange.‘

Marx consequently states that other elements of the economy – demand, consumption, exchange etc. – have some influence but that production, the supply side, is the most powerful economic factor. Analysis shows why this is clear. Consumption, for example, can only be undertaken either of one’s own production or with an income to purchase products, and that income necessarily comes, directly (wages, profits) or indirectly (welfare benefits, pensions, support from another family member etc.), from participation in production.

Furthermore, Marx’s analysis does not deny the interaction of supply and demand, which is the focus of ‘Western’ economics, but simply asks a different question: if supply and demand balance, that is there is ‘equilibrium’, what happens, what is the economy’s dynamic and how does it develop?
Marx, in summary, was a thoroughly ‘supply side’ economist.

Confusions of Western ‘Keynesianism’

The economic school which focuses on the economy’s ‘demand side’, as opposed to supply side, is generally referred to as ‘Keynesianism’. The argument associated with this is that if economic difficulties exist this is due to lack of demand, which should therefore be increased – frequently by running a budget deficit and/or monetary easing. This increase in demand, it is argued, will lead to production increases.

This argument is evidently false. In a market economy production is not undertaken simply because something is ‘demanded’, it is only undertaken for profit. If an increase in demand leads to no increase, or even a decline, in profit then it will not result in an increase in production – indeed it can lead to the reverse.

There are numerous conditions in which increasing demand will not lead to a profits increase. One is where the economy has no spare capacity and therefore production cannot be expanded on the basis of existing resources. In this situation increasing demand, with no ability to increase supply, merely leads to inflation and not a production increase.

But an increase in demand can lead to a fall in profitability even where spare capacity exists. For example, if increased demand strengthens the bargaining position of labour, thereby increasing the wages share in the economy, the profits share in the economy must necessarily fall and profits may even decline in absolute terms. In those circumstances increasing demand, through its negative effect on profitability, will have a negative effect on production. Some policies to ‘increase demand’ even directly reduce profitability – for example if the increase in demand is achieved by directly increasing wages then the profits share of the economy will fall.

It is therefore simply false that increasing demand necessarily leads to an increase in production – it may even lead to a fall. In practice methods of stimulating demand may lead simultaneously to the combination of inflation and economic stagnation or decline – the notorious ‘stagflation’. Naturally these facts do not mean there are no circumstances in which increasing demand will lead to an increase in production, but whether this occurs or not depends not on increased demand itself but on its effect on profitability – i.e. the division of incomes between wages and profits resulting from production. Profitability, not ‘demand,’ is therefore the key part of the economic process.

It summary, whether analysed in a Marxist or ‘Western’ economic framework, the most powerful element is the supply side of the economy not the demand side. This does not mean demand has zero effect, but it means that the effect of demand is less powerful than that of supply. Consequently, what is often referred to as ‘Keynesianism’ is false – the point that should be added is that such ‘Keynesianism’ is a distortion of the views of Keynes himself as Keynes perfectly well understood that profits were the element determining production in a market economy.

It follows that whether considered in a Marxist or a ‘Western’ economic framework the most powerful key to analysis and economic policy lies on the economy’s ‘supply side.’

Production

Turning to which processes are most powerful, and which are weak, on the economy’s supply side it is a testament to genius that modern econometrics has confirmed on this issue the analysis over 200 years ago by the founder of modern economics Adam Smith. Smith set out immediately and unequivocally in the first sentence of the first chapter of The Wealth of Nations that: ‘The greatest improvement in the productive powers of labour, and the greater part of the skill, dexterity, and judgment with which it is directed, or applied, seem to have been the effect of the division of labour.’ With his customary clarity the other conclusions of Smith’s magnum opus followed logically from this analysis of the decisive role of division of labour.

Smith’s conclusion has necessary consequences which impact on the all aspects of the economy. This increasing division of labour means that as Spengler notes in his study of The Wealth of Nations: ‘in Bohm-Bawerkian terms… production became more roundabout.’ By ‘roundabout production’ is meant that rising division of labour creates an increasingly interconnected web of production, and therefore that economically ‘indirect’ inputs rise relative to ‘direct’ ones.

To illustrate this with a simple example, 100 years ago an accountant merely used a pen, paper and a simple calculating tool which were the product of, in comparative terms, relatively few people. Today an accountant uses a computer, software, and the internet – collectively the product of hundreds of thousands of people. To take a quantified example, a modern car assembly factory may appear a huge productive unit, but only 15% of the value of the car production process takes place in it: 85% of the value of auto production is in components and other intermediate inputs into car production.

Furthermore, even the 85% of the car’s value due to inputs of components does not exhaust this process of division of labour and of ‘indirect’ inputs. These components were themselves improved by the work of tens of thousands of R&D workers and scientists, who were trained by hundreds of thousands of teachers, university lecturers etc. This process of increasing division of labour perfectly demonstrates the process analysed by Smith.

At this point Marx enters the picture. Marx summarised the numerous different processes of division of labour described by Smith in a single fundamental concept ‘socialised labour’. Marx drew out the conclusions which followed from the fundamental processes analysed by Smith. But for present purposes it is not necessary to deal with these further conclusions or even to distinguish between the terms ‘division of labour’ used by Adam Smith or ‘socialised labour’ used by Marx – they both described the same process. It is merely crucial to note that modern economic statistics has thoroughly vindicated in quantitative terms these conclusions of Smith/Marx and thereby established what are the most powerful forces on the economy’s supply side.

The most powerful forces on the supply side

If the economy’s ‘supply side’ is examined in quantitative terms the conclusions Smith drew from his analysis were that the most fundamental forces of economic development were, in the descending order of quantitative importance established by modern econometrics:

(i) The most fundamental force of economic and productivity growth is increasing division of labour – reflected in the growth of ‘intermediate products’.

(ii) Increasing division of labour requires an increasing scale of production and an increasing scale of market – resulting in globalisation.

(iii) Increasing division of labour, and increasing scale of production, leads to an increasing percentage of the economy being devoted to fixed investment.

(iv) Growing skill of the labour force, i.e. increasing ‘labour quality,’ is economically determined by the resources put into training that labour force.
(v) Technological progress is itself also a product of increasing division of labour via establishment of specialised R&D and other facilities.

As with all proper scientific propositions Smith’s conclusions are empirically testable. It is a remarkable tribute to Smith’s genius, and that of Marx who understood their power and built on them, that modern economic statistics has confirmed all these points. They will, therefore, be analysed, using modern official statistical methods, proceeding from the most powerful forces on the economy’s supply side to the weaker ones.

Domestic division of labour and Intermediate products

The most direct measure of division of labour is growth of ‘intermediate products’ – i.e. production of one economic sector, either goods or services, used as an input into another (e.g. a hard drive is an output of one industry used as an input into a computer, a steering wheel is the output of the car components industry used as an input into the car industry etc.). Modern econometrics is unequivocal in finding that such intermediate products, directly reflecting division of labour, are the most important source of economic growth.

Taking first the most developed economy, the US, Jorgenson, Gollop and Fraumeni found, using the statistical methods now officially adopted by the US, UN and OECD: ‘the contribution of intermediate input is by far the most significant source of growth in output. The contribution of intermediate input alone exceeds the rate of productivity growth for thirty-six of the forty-five industries for which we have a measure of intermediate input… the predominant contributions to output growth are those of intermediate, capital and labour inputs. By far the most important contribution is that of intermediate input.’

The same result as for the US is found for other economies – specifically including China. Regarding rapidly growing Asian economies:

  • For South Korea, Hak K. Pyo, Keun-Hee Rhee and Bongchan Ha found regarding material intermediate inputs: ‘The relative magnitude of contribution to output growth is in the order of: material, capital, labour, TFP then energy.’
  • For Taiwan Province of China, analysing 26 sectors in 1981-99, Chi-Yuan Liang found regarding intermediate material inputs: ‘Material input is the biggest contributor to output growth in all sectors during 1981-99, except… seven’.
  • For mainland China, Ren and Sun found that in the period 1981-2000, subdivided into 1984-88, 1988-94 and 1994-2000: ‘Intermediate input growth is the primary source of output growth in most industries.’

This analysis that growth of intermediate products is the most important factor in overall economic growth therefore fully confirms Smith’s analysis that rise of division of labour is the single most powerful force on the domestic field for economic growth. This process fully operates in China as in the other economies studied.

Division of labour at an international level

So far analysis of data on division of labour at a domestic level has been given. This clearly shows that use of intermediate products is the most powerful factor on the economy’s ‘supply side’. However, division of labour in a modern economy extends not only domestically but internationally – the phenomenon of ‘globalisation’. Quite sufficient evidence exists to leave no doubt that division of labour increases internationally. This drives both modern industrial structure and China’s ability to insert itself in globalised competition. Taking the chief features of this:

  • Intermediate products themselves constitute the largest part of international trade – accounting for approximately 40% of all goods trade.
  • Trade in intermediate products is concentrated in advanced economies and East Asia – economies which have intermediate products as the most rapidly growing part of national production.
  • International trade has expanded rapidly as a percentage of world GDP.

That international trade is the expression of division of labour of course explains the well-established finding that international economic ‘openness’ is positively correlated with economy growth.

Factors of production

Turning from intermediate products to factors studied in the classic framework of Solow ‘growth accounting’ the trends for both advanced and developing economies analysed by the latest of statistical method of the US, OECD and UN statistical agencies for the period 1992-2014 are shown in Figure 1. This data is for 103 advanced and developing economies together accounting for 94% of world GDP – i.e. the data is comprehensive. The results are clear:

(i) In both advanced and developing economies Total Factor Productivity (TFP) is only a small source of growth. TFP in advanced economies on average accounts for 0.5% annual GDP growth and in developing economies 0.6%.

(ii) Labour inputs account on average for 0.8% annual GDP growth in advanced economies and 1.2% in developing ones.

(iii) Capital inputs are the single most important of the ‘Solow’ factors of growth accounting on average for 1.6% GDP growth a year in advanced economies and 2.5% in developing economies.

The net result of these inputs is that annual average growth in developing economies in the period 1992-2014 was 4.3% compared to 2.9% in advanced economies. This annual growth lead of 1.4% by developing economies allows them to catch up with advanced economies. But only 0.1% of the ‘catch up’ in GDP growth is due to higher TFP growth compared to 0.4% for higher increases in labour inputs and 0.9% due to higher capital inputs. Therefore, 64% of the ‘catch up’ of developing economies is due to a higher rate of capital accumulation, 29% due to higher inputs of labour, and only 7% due to higher TFP growth.

Figure 1

16 01 07 Figure 1


Similarities and differences in the growth pattern of advanced and developing economies

To show more clearly the similarities and differences in the growth pattern of advanced and developing economies Figure 2 and Figure 3 show the percentage contributions to growth in advanced and developing economies. To highlight the most significant difference more clearly labour inputs have been divided into their two sources of increase in labour quantity (i.e. total hours worked by the labour force) and increase in labour quality (improvements in education and training). The charts show that the most powerful sources of growth in the two types of the economy are the same with one significant difference regarding the growth of labour inputs.

(i) The role played by Total Factor Productivity is small in both advanced and developing economies, accounting for only 10% of growth in both. TFP is substantially determined by indirect inputs into production – technology advance due to R&D etc.

(ii) The percentage of growth accounted for by labour inputs in both types of economy is not radically dissimilar – 26% in advanced economies, 30% in developing economies. However, the composition of the increase in labour inputs is substantially different in the two types of economy. In developing economies 27% of GDP growth is due to increase in total hours worked by the labour force and only 3% by increases in labour quality, whereas in advanced economies only 15% of growth is accounted for by increases in hours worked and 11% by improvements in labour quality.

Therefore, as an economy becomes more advanced the role played by increases in total hours worked falls while the role played by improvements in education and training moves from being small to being a significant growth factor. Put in simple terms the role played by education, training etc. becomes significantly more important as the economy become more developed – a classic example of roundabout/indirect production as the increase in labour quality is due to the work of teachers, training schemes etc.

(iii) Increase in capital investment is by far the most important of the ‘Solow factors’ in economic growth in both developing and advanced economies – accounting for 60% of growth in developing economies and 63% of growth in developed economies. It may be noted that the role of capital investment in an advanced economy is even greater than in a developing one. Capital investment is a pure ‘indirect’ input into production – both intermediate products and fixed investment are capital in accounting terms but intermediate products are used in a single production cycle while fixed investment is used up (depreciated) over numerous production cycles.

Figure 2

16 01 07 Figure 2

Figure 3

16 01 07 Figure 3


Sources of growth on the ‘supply side’

The importance of different factors on the supply side of the economy may therefore be summarised:

i. The most powerful factor in economic growth is the development of intermediate products – a direct reflection of increasing domestic and international division of labour.

ii. The second most powerful factor of production is capital investment – accounting for approximately 60% of the growth which is due to ’Solow factors’ of production.

iii. Labour inputs account for approximately 30% of GDP growth due to ‘Solow factors’ of production – but with increases in labour quality rising significantly compared to labour quantity as an economy becomes more developed

iv. TFP plays only a relatively small role in economic growth – accounting for about 10% of growth due to ‘Solow factors’ of production.

Myth of individual entrepreneurship

The above data immediately shows why the views of some of those in China claiming to stand for ‘supply side’ economics are wrong. For example, Liu Shenjun claims that the key factor in economic growth is individual ‘entrepreneurship.’ The data on economic growth clearly shows this is entirely false.

The impact of individual ‘entrepreneurship’ would be part of the growth that is not created by quantitative increases in intermediate products, capital or labour i.e. it would be measured as part of TFP growth. But as already seen TFP increase even taken as a whole is a small part of economic growth – in both advanced and developing economies total TFP increase accounts for only 10% of economic growth. Furthermore, TFP growth is no higher in advanced economies, where individual entrepreneurship is supposedly concentrated, than in developing economies. Consequently, even if the role of ‘individual entrepreneurship’ accounted for the whole of TFP growth in advanced economies, which is a wholly unreasonable assumption given the key role of technology, scale of production, R&D and other factors, it would be only one third as important as growth in labour inputs and only one sixth as important as growth in capital investment.

Therefore, attempting to create economic growth based on TFP increases, let alone ‘individual entrepreneurship,’ is like attempting to drive forward a machine using only a tiny gear wheel, while not attempting to shift it using the far larger gear wheel of capital investment or even labour inputs. For simple quantitative reasons such a strategy evidently cannot succeed.

Conclusions

To summarise again the sources of growth on the supply side of the economy are, in descending order of importance, intermediate products, capital investment, labour inputs, and TFP (with the contribution of individual entrepreneurship being even less than that of TFP). This has evident implications for what constitutes a ‘supply side strategy’ – which includes but is not confined to the following points.

1. Regarding the most powerful source of economic growth, intermediate products, domestically the maximum conditions have to be created for China to use the advantages of division of labour. The increasing size of China’s economy, by expanding the size of its domestic market, facilitates development of such efficient division of labour. Nevertheless, efficient functioning of the domestic national market, and domestic division of labour, requires large scale material underpinnings. China’s transport system for example, a crucial factor permitting division of labour, remains highly underdeveloped compared with the US. Length of road per capita in China is only 16% of that in the US, and length of railway only 7%. Compared to the US China’s logistics system is therefore extremely underdeveloped. Similarly regarding communications, again indispensable for efficient division of labour, the percentage of China’s population on the internet is only slightly over half that of the US. Programmes such as ‘internet plus vital’ are therefore vital not only for systematic upgrading of production but for permitting efficient functioning of domestic division of labour.

2. In terms of international division of labour. the effect of the international financial crisis has sharply reduced the share of trade in China’s economy. The percentage of exports of goods and services in China’s GDP fell from 35% in 2007 to 23% in 2014 and the share of imports from 27% to 19%. Trade data shows this decline has continued in 2015 – in summary China is making less use of international division of labour than previously. Purely on the basis of exploiting the growth advantages of division of labour the most powerful way to stimulate exports would be via RMB devaluation while simultaneously more rapid GDP growth would be the most effective way to stimulate imports. However, in setting the exchange rate other considerations than trade stimulation also have to be taken into account and therefore these have to be balanced with trade considerations.

3. As fixed investment is the most important ‘Solow factor’ in economic growth it is necessary for China to sustain a high fixed investment level. However, investment requires equivalent savings. The decline in China’s savings as a percentage of the economy since 2009, i.e. a decline in the percentage of the economy developed to supply of capital, has led to China’s interest rates rising significantly above those in the US, with negative economic consequences. Reviving China’s saving rate, above all by increasing corporate profitability, is therefore an economic priority if a high level of fixed investment is to be maintained.

4. The growing importance of labour quality, as opposed to labour quantity, as an economy becomes more developed underlines the importance of China continuing to increase the percentage of the economy devoted to education and training.

5. R&D is a crucial example of an ‘indirect’ input into production and is crucial for innovation. Continuing to increase the percentage of China’s GDP devoted to R&D is therefore important on the supply side.

6. Measures to assist individual entrepreneurship are useful but for the quantitative reasons already cited cannot play a determining or large role in economic growth.

Given the clear facts on economic growth in both advanced and developing economies economists who claim that what is required on the ‘supply side’ is ‘”small government, big market”, free competition and firm believe in entrepreneurship’ are both entirely wrong as regards the power of different factors on the economy’s supply side and are merely ‘neo-liberals’ hiding under another name – ‘neo-liberalism’ itself being so discredited that few people now dare to openly advocate it.
The correct starting point for framework for analysing the supply side of the economy flows from the analysis recently set out by Xi Jinping as reported: ‘As the fundamental standpoint of Marxist political economy, the theory of putting people at the center should be upheld while deploying work, setting down policies and promoting economic development.’

Putting people at the centre applies to the productive process as in the other fields of the economy. The most powerful forces on the economy’s supply side is ‘socialised labour’, to use Marx’s terminology, or ‘division of labour’ to used Adam Smith’s – which terminology is used is not critical for present purposes as both describe the same process. The most powerful forces on the economy’s supply side as it becomes more developed – intermediate products, globalisation, rising fixed investment, increased labour quality – are themselves expressions of division of labour/socialised labour.

The recent turn to emphasis on the economy’s supply side, as opposed to the confused ideas of ‘Keynesianism’ imported into some circles in China by Western textbooks, is therefore welcome. But it would be truly absurd if one Western textbook confusion were now replaced by another which constitutes merely a form of ‘neo-liberalism’ in other disguise. This would be particularly ridiculous when China’s Marxist economics and contemporary Western economic statistics come to exactly the same conclusion on what are the most powerful forces on the economy’s supply side.John Rosshttps://www.blogger.com/profile/08908982031768337864noreply@blogger.com1

What level of investment should Corbyn & McDonnell aim for?

.912ZWhat level of investment should Corbyn & McDonnell aim for?By Michael Burke
The policies outlined by Jeremy Corbyn and John McDonnell have the capacity to transform the economic debate in Britain. More importantly, if the ideas outlined for an investment-led recovery are implemented then they could alter the trajectory of the British economy, from stagnation and rising inequality towards sustainable growth and a general rise in living standards.

Therefore it is important to examine thoroughly what is the scale of the investment needed, which areas will be prioritised, what will be the overall effects on the economy, how it will be funded, and a number of other questions. Here, only an outline of the first question is addressed, what is the scale of the investment needed?

Identifying the problem
The population as a whole is primarily concerned with its own well-being, on matters such as wages, health care, good schools, good quality public services and (for themselves at least) some reassurance that social security will provide sufficient support if they cannot work. In general these fall under the economic category of Consumption. 

SEB has shown over a number of articles that Consumption cannot drive economic growth. Consumption follows Production. Increasing Consumption alone simply leads to increased debt, a claim on future production. This is precisely what has occurred in the British and other economies since the crisis. Consumption has outstripped production and households in particular have been obliged to either increase debt or run down their savings. It is not sustainable. In order to increase production over the medium-term it is necessary to increase the means of production through Investment.

Jeremy Corbyn and John McDonnell have said on a number of occasions that they will borrow to invest (audio link & transcript) but will run a balanced budget on current government spending. This is correct. Only borrowing to achieve a positive return and economic growth. It is this Investment (and borrowing to fund it) that leads to higher living standards, including higher Consumption.

But it is precisely the level of investment which is currently the key drag on the British economy. In Fig.1 below the level of real GDP, Consumption and Investment from the beginning of 2000 onwards are shown. Trend lines for GDP and investment are also shown as these show the general trajectory rather the more short-term fluctuations.

Fig.1 UK Real GDP, Consumption & Investment, Q1 2000 to Q3 2015
 

One of the more ridiculous claims by the Tory Government is that its austerity policy is responsible for recovery. There has been no substantive recovery of the output lost in the slump. In most business cycles the sharpness of the recession is matched by the pace of the recovery. This business cycle is a rarity. None of the three key variables is anywhere near recovering its previous growth trend. As a result there is a risk that the loss of output will become permanent and the British economy will have shifted onto a long-term, lower growth trajectory.

The most important of these three variables in determining future growth is Investment. If GDP growth had continued on its previous trend it would now be 16% higher than its current level. But Investment has experienced the sharpest fall, and is currently 26% below its previous trend. In fact Investment is the only variable to remain below its pre-recession peak, although that may alter in the near future. 

How much investment?
Because both the future level of GDP and Investment are unknown, it is impossible to say at this point what the precise level of additional Investment would be needed under a Corbyn-led Government. But it is possible to extrapolate from previous trends in order to demonstrate the approximate rate of Investment needed. 

This can be done by replicating the trend rate of growth from 1st quarter of 2000 over 8 years to the pre-recession peak in the 1st quarter of 2008. If that growth trend was repeated over the following 8 years, by the 1st quarter of 2016 real GDP (annual) would be £2,090 billion. From the previous peak Investment would be £390 billion. 

Investment is currently way below this level, around £310 billion. In the early part of 2016 it would require an annual additional increase in Investment of £82 billion in precise terms, from £310bn to return to trend growth rates. This would be an increase equivalent to 4% of GDP to 18.75% of GDP. 

As the private sector has been unable or unwilling to produce an investment-led recovery, the public sector will be obliged to lead this increase in investment equivalent to 4% of GDP. This is in addition to the current miserably low rate of net public sector of 1.5% of GDP, bringing the total level of net public investment (after depreciation) up to 5.5% of GDP.

It is reasonable to assume that the private sector itself would then increase its own rate of investment to some extent, as the anticipated level of new profits would rise and based on past experience. But as this cannot relied on as the overall economic conditions at the outset of a future Labour Government are unknown, so this assumption cannot form a central part of the overall projection.

Competitiveness
The issue of how much additional investment is not exhausted by reference to previous trends, particularly since the British economy has had a lower rate of investment than comparable economies over the very long-term. Simply returning to 2000 to 2008 rates of investment is a minimum requirement in order to prevent permanently embedding the effects of the slump. 

Fig.2 below shows a comparison of labour productivity per hour in the UK and the rest of the G7 group of economies. UK productivity is now over 20% below that of the rest of the G7, the highest productivity gap on record. Since 2000 every country in the G7 has made gains relative to UK productivity.

Fig.2 Relative UK & G7 Productivity
 

UK productivity has also fallen in the recovery, which is extremely rare. Usually, existing plant, factories and machinery that have fallen idle in the slump is brought back into production and productivity rises. Instead, labour inputs have risen as the UK economy has employed more people in longer hours in low value-added jobs, so output has not grown at the same pace.

Despite much discussion there is no ‘puzzle’ behind the very weak level of UK productivity. It is because the UK has a very weak relative rate of investment. As the UK economy has a persistently lower level of fixed investment, so the relative decline in productivity is unavoidable.

Productivity (labour output per hour) will increase in proportion to the increase in quantity and quality of machinery and other fixed capital used in output (as well as the skills level of the workforce). As Fig.3 below shows, throughout the entire period from 2000 to 2014, the UK economy had a lower proportion of GDP devoted to the investment (Gross Fixed Capital Formation) than the other countries of the G7. Furthermore the higher levels of productivity by country are closely correlated to their higher levels of investment.

Fig.3 GFCF as a proportion of GDP in the G7
 

All other G7 economies gained on the UK in terms of productivity because they all had higher levels of investment over the same period. This relatively low rate of investment in Britain also accounts for the relatively weak competitiveness of the UK economy, including its large and growing external deficits.

There is a widespread fallacy that it is cheap overseas labour which drives the deterioration in the UK trade and current account balances. But 80% of British goods exports are to other industrialised economies and 70% of its imports are also from those economies. Because Britain has much lower investment and productivity than those economies it runs a substantial trade deficit with them, approximately £60 billion per annum in the most recent data.

The G7 economies as a whole have allowed investment to fall as a proportion of GDP. All of the G7 economies have experienced this fall, the sole exception being Canada. But the UK economy has throughout the entire period had the lowest rate of investment of all. 

The median level of G7 GFCF as a proportion of GDP has fallen from 23.7% to 19.5% in a short period, from 2000 to 2014. At the same time it has fallen in Britain from 19.9% to 17.1%. Therefore a supplementary aim should be to get the rate of investment in Britain up to the G7 average over the medium-term simply in order to prevent further declines in competitiveness.

Total cost 
Osborne claims to be in favour of investment. But austerity is the latest manifestation of the neoliberal economic model which has held sway in the Western economies since Reagan and Thatcher. It is absolutely opposed to public sector investment because handing public sector assets to the private sector is a decisive means of boosting profitability. In this economic model, the means of production must be handed to private capital. 

Osborne is a subscriber to this view. As a result, public sector investment has fallen dramatically. On official projections from the Office for Budget Responsibility (OBR) the level of public sector investment will fall over the next three years (Table 3.6). Public sector net investment will fall to 1.4% of GDP in the last years of this parliament (Table 4.35).

As noted above the additional level of public sector investment required under a Corbyn-led government would be approximately £82 billion, or 4% of GDP in order to return to previous trends. According to the OBR the total level of net public sector investment in the current Financial Year will be £33.6 billion (Table 4.15). However, this is after the deduction of depreciation of just under £40 billion. The gross level of public sector investment in the current FY is projected to be £73.4 billion. The required investment of £82 billion is in addition to this gross total, giving a total level of public sector investment need at £155 billion.

Of course, not all of this needs to carried out by central government and still less needs to be funded by government borrowing. But this assessment is simply what is required in order to return to pre-crisis growth rates and would not even be sufficient to maintain current low levels of competitiveness versus the other countries of the G7.

Equally there will be attempts to cast this analysis as ‘extremist’ or simply ‘unrealistic’. But it is no more extreme or unrealistic than the analysis of the chief economics commentator of the Financial Times, Martin Wolf in Cameron is consigning the UK to stagnation. 

“He [Jonathan Portes of the NIESR] recommends a £30bn investment programme (about 2 per cent of GDP). I would go for far more. Note that the impact on the government’s debt stock would be trivial even if it brought no longer-term gains…

‘…the government… is refusing to take advantage of the borrowing opportunities of a lifetime…. It is determined to persist with its course, regardless of the unexpectedly adverse changes in the external environment. The result is likely to be a permanent reduction in the output of the UK”.

In future posts SEB will examine where this investment should be concentrated, what its likely impact will be on growth and living standards, and how it could be funded, as well as other issues.