
.388ZNew Labour spent less than Thatcher. That was part of the problemBy Michael Burke
In all the commentary related to Gordon Brown’s decision to step down as MP there is one central myth that has been retold almost without any challenge. This is the idea that his excessive public spending was responsible for the economic crisis and/or the surge in the deficit on the public finances.
It is important to debunk this myth not primarily for reasons of establishing the historical record. The more important task is to puncture the myth that the crisis was caused by the public sector because this is used to justify the continuation of austerity measures and prevents any discussion of the real causes of the crisis or its remedies. The actual cause of the crisis was an investment strike by the private sector, which has not been broken.
The record
The actual position is that New Labour cut government spending dramatically. It did the same to tax revenues. It was the crisis which reversed that as the private sector investment strike both caused unemployment to rise and so pushed up government spending and lowered tax revenues (income tax, VAT, corporate taxes, and so on). But even then, government spending rose to only the same level as under Thatcher.
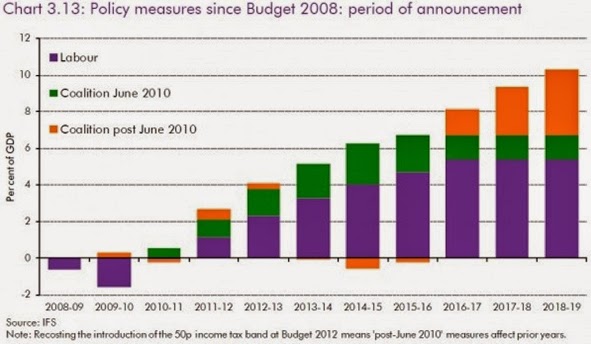
The trends in public sector revenues and expenditures as a proportion of GDP are shown in Fig.1 below.

Any deficits under New Labour prior to the crisis are therefore attributable to the very low level of tax revenues that were gathered.
The detailed comparative record is set out in Table 1 below (based on UK Treasury data, which is now presented by the Office for Budget Responsibility).

The low-point for spending in this period examined was under Blair. It equalled the low-point in spending recorded by the Tory austerity government of the 1950s.
Uninterrupted decline
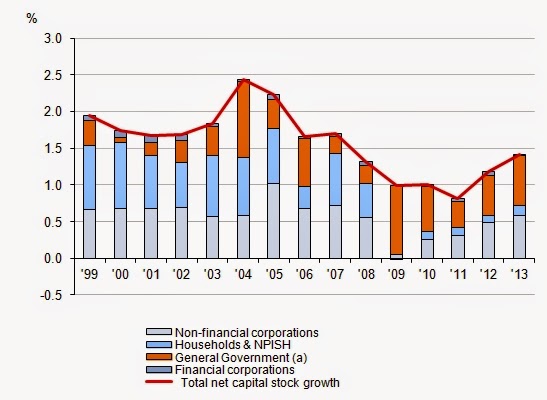
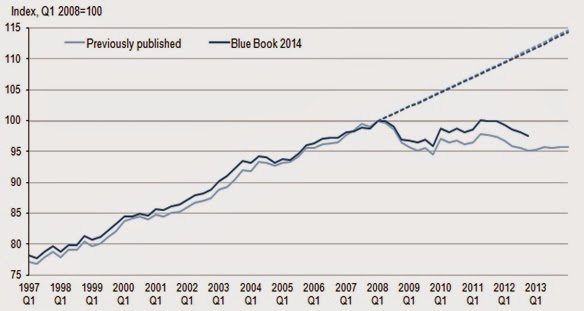
It is evident that under New Labour there was room both to increase taxation and spending. Fig.2 below shows the level of government investment as a proportion of GDP. OBR forecasts for future years are included.

In the mid-1970s the right wing leadership of the Labour Party led by Callaghan and Healey manufactured an entirely fake crisis of government borrowing with the connivance of the IMF. The purpose was to launch an attack on public spending and government investment. This became explicit policy (justified with all sorts of monetarist nonsense) under Thatcher. There has been no decisive break from this policy framework in the period since.
This policy has been disastrous. British growth was regarded as relatively very weak in the post-World War II period up to the mid-1970s. The process of cutting public spending, cutting public investment, deregulation and privatisation actually lowered growth considerably. In the years between 1948 and 1981 the economy grew by 147%. Despite the boon of North Sea oil, GDP grew by just 110% in the following 32 years.
Key to this decline was the decision to slash public investment. It is driven by the belief that, if the state’s role in the economy is reduced the private sector will take its place, and in a more efficient manner. New Labour extended this policy. The result was that private sector freedom did not lead to increased investment but to increased speculation in areas such as housing. The whole history of this policy has led to the current crisis.
The Tory-led Coalition has continued this policy in a very aggressive way. Public spending has been cut and public investment has been slashed. As previously this will not lead to increased investment or prosperity. Instead, as already noted, financial bubbles and crashes are what happen when the private sector is in charge.


Recent Comments