
By John Ross
The collapse in rapid succession of Silicon Valley Bank and Signature Bank, the second and third largest bank collapses in U.S. history, fully confirms the extremely damaging character of the U.S. stimulus policies which were launched to attempt to deal with the economic consequences of the Covid pandemic. Indeed, the path from the errors of these stimulus packages to the collapse of the two U.S. banks is a particularly direct one. This therefore reinforces the importance of all circles in China understanding the errors of these policies – this is necessary as, unfortunately, some sections of the media in China have supported the type of erroneous stimulus packages launched in the U.S. and suggested that China should copy them.
A long analysis of the errors of these U.S. stimulus packages was already given in my article “Key lessons from the failure of the U.S. and success of China’s economic stimulus programs” so all the details included there will not be repeated here. This article will just deal with the links between the specific collapse of the U.S. banks and these errors in U.S. economic policy. It will also explain an apparent paradox. Why did these two banks collapse due to their involvement with what are generally regarded as the safest of all financial assets, U.S. Treasury bonds, and one of the riskiest of all financial instruments – crypto currencies?
U.S. propaganda compared to U.S. economic reality
In its recent political propaganda the U.S. has been claiming that its economy was doing well and the stimulus packages it launched during Covid were a big success. President Biden had done press conferences to make such claims. But anyone following money, and not words, knew this was not true. In addition to underlying negative structural trends in the U.S. economy financial markets were also sending out extremely clear signals of economic problems.
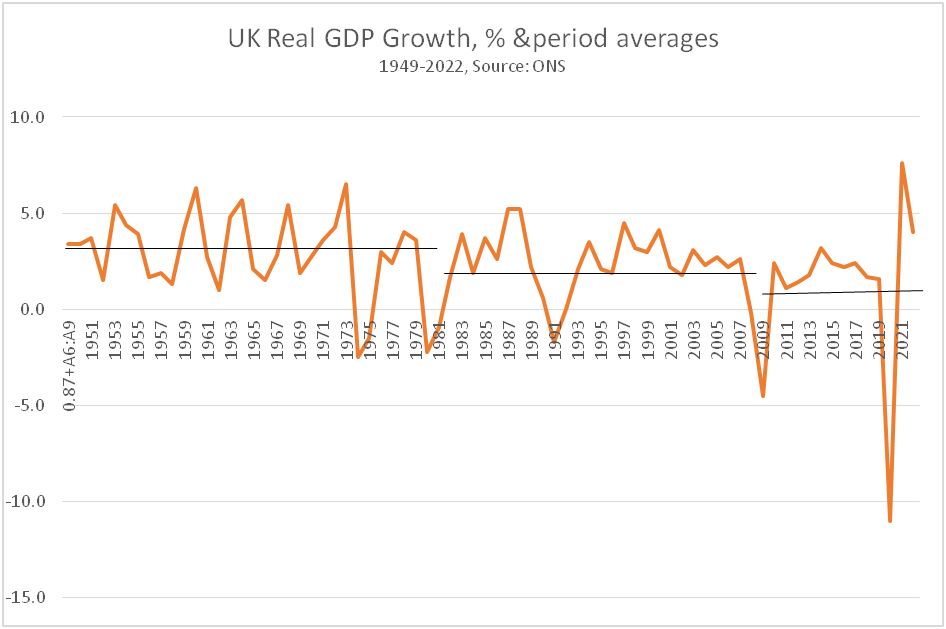
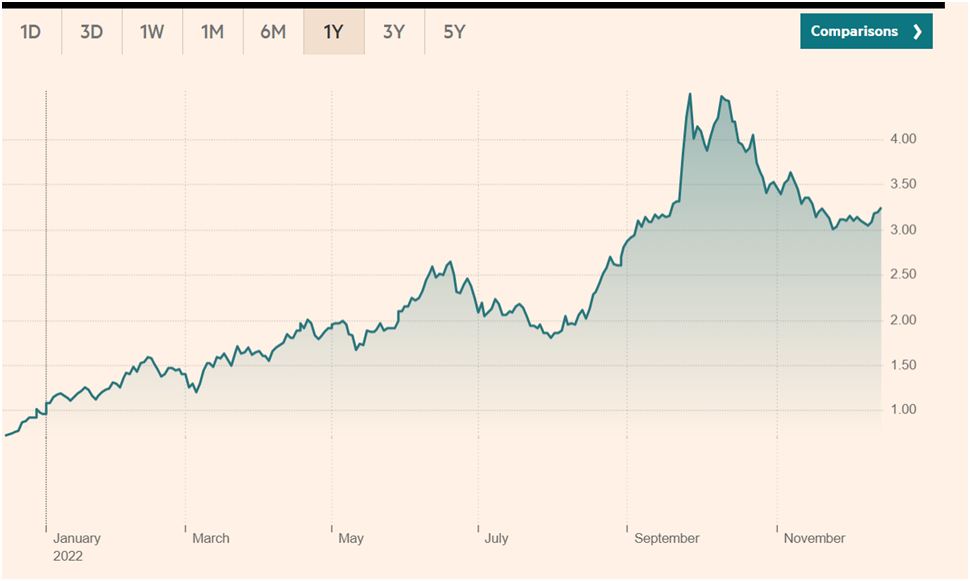
The most important of these was what might appear a very technical issue but is in fact deeply significant – so much so that it is well worth non-economists understanding it for reasons that can be explained in a short way. Readers will rapidly find out why this apparently technical issue in fact has extremely strong practical consequences. This issue is the inversion of the U.S. yield curve – that is, the creation of a situation where the interest rates on US long term bonds are lower than short term ones. As shown in Figure 1 this is an extremely rare event, it has only occurred four times in the last forty years, and is one of the clearest and most reliable indicators of serious problems in the U.S. economy.
Figure 1 shows over the long run the relation between U.S. long term, 10 year, and short term, two year, bond interest rates – that is, how much the two interest rates differ. As can be seen almost always U.S. long term interest rates are higher than short term ones. This is logical because the risk of lending money over a long period is greater than over a short period – so a greater reward, a higher interest rate, has to be paid to get someone to lend money for a longer period. But, as can be seen, on four occasions this normal relation has changed and short-term interest rates became higher than long term ones. On each of the three previous occasions this event, the inversion of the yield curve, was followed by very serious problems in the U.S. economy.
When the yield curve inverted in 1989 this was followed by recession in 1990.
When the yield curve inverted in 2000 this was accompanied by the severe dot com share price collapse and a sharp slowdown in the U.S. economy.
The inversion of the yield curve in 2006 was followed by the collapse of the U.S. sub-prime mortgage market, the 2008 financial crisis, and a severe U.S. economic recession.
What is notable is therefore not only the rareness of this indicator of yield curve inversion but also its reliability – that is, there are no occasions on which the yield curve inverted and this was not followed by a major crisis. It is because it is such a reliable indicator, and because it has always been followed by such severe economic consequences, that it is worth even non-economists paying great attention to this issue.
Therefore, when in July 2022 the U.S. yield curve inverted, this was a very clear signal that serious problems were developing in the U.S. economy. Furthermore, this inversion continued to worsen until it reached a peak of -1.09% on 8 March 2023. This was clearly indicating a serious problem and therefore that all the claims in words that everything in the U.S. economy was doing well were false.
Figure 1

From yield curve inversion to the U.S. banking crisis
The mechanisms that drove this inversion of the yield curve led directly to crises in both the Treasury bond market and in crypto currencies – and through them to the bank collapses.
As was analysed in detail in “Key lessons from the failure of the U.S. and success of China’s economic stimulus programs” in order to attempt to deal with the economic consequences of the Covid pandemic the U.S. launched large purely consumer focussed stimulus programmes. As, by definition, consumption is not an input into production this meant that an enormous boost was being given to the demand side of the U.S. economy, but no direct increase was being given to the economy’s supply side. The result of a huge increase in demand and no increase in supply was inevitable – rapid inflation.
To summarise the trends, which are analysed in detail in the earlier article.
In order to create the consumer stimulus the U.S. government increased its borrowing by an extraordinary 26% of GDP in a single year. Almost all this money was used to stimulate consumption, that is demand, and very little to increase investment, that is supply as well as demand.
Simultaneously the U.S. broad money supply was increased by 26% in a year.
The result was that between the 4th quarter of 2019, that is immediately before the pandemic, to the 4th quarter of 2022, that is the latest available data, U.S. consumption rose by a large $3,769 billion, but U.S. net investment, that is taking into account depreciation, fell by $93 billion. This produced the sharp increase in demand (consumption) with no increase in supply (investment).
As a result, U.S. inflation began to rise rapidly – increasing from 0.1% in May 2020 to 7.5% in January 2022. This timeline showed clearly that inflation was being created by U.S. economic policy and not by the Ukraine war – as that war did not break out until February 2022. U.S. Inflation then reached a peak of 9.1% in June 2022.
Raising interest rates
To attempt to control this inflationary wave the U.S. Federal Reserve then began to rapidly raise interest rates. These interest rate rises were the mechanism that led to the simultaneous crisis in the Treasury Bond markets and that for crypto-currencies – these in turn creating the bank collapses.
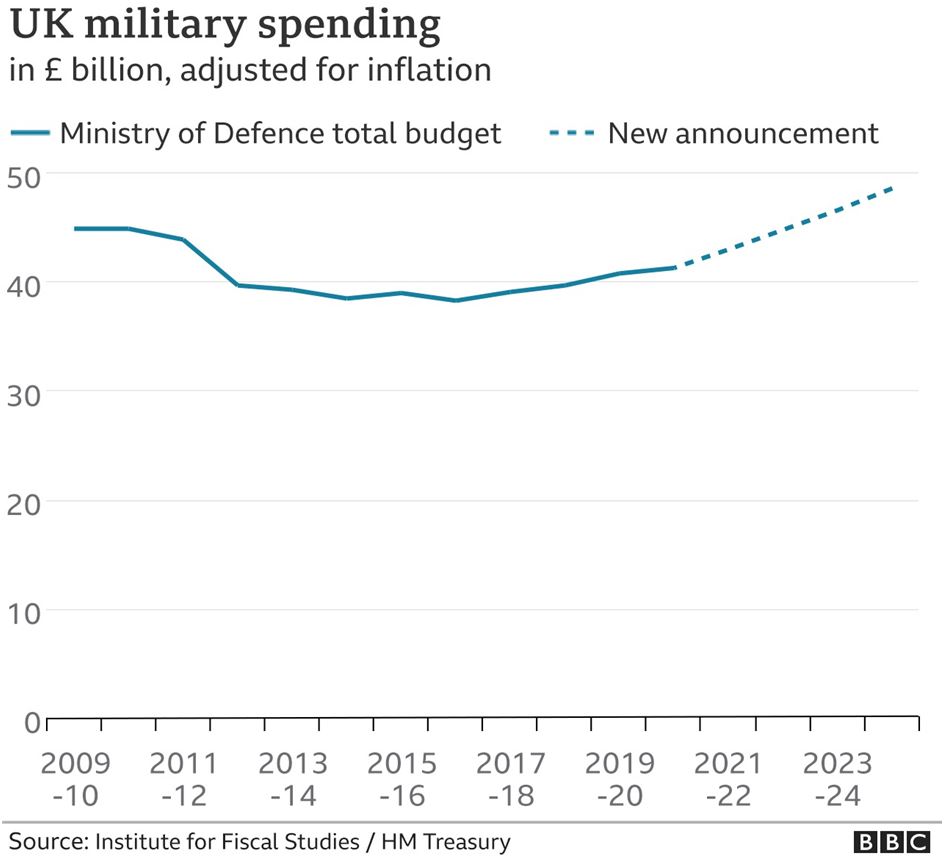
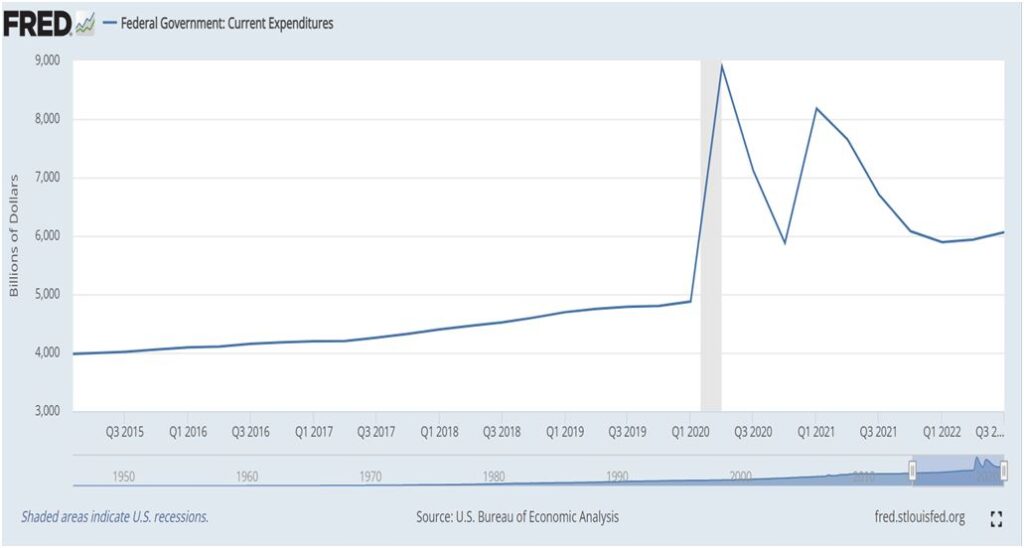
As Figure 2 shows, to attempt to control the inflationary wave created by U.S. economic policy, the Federal Reserve began to rapidly raise its interest rate. This increased from 0.25% in February 2022 to 4.75% in February 2023 – a rise of 4.5% in only one year.
Figure 2

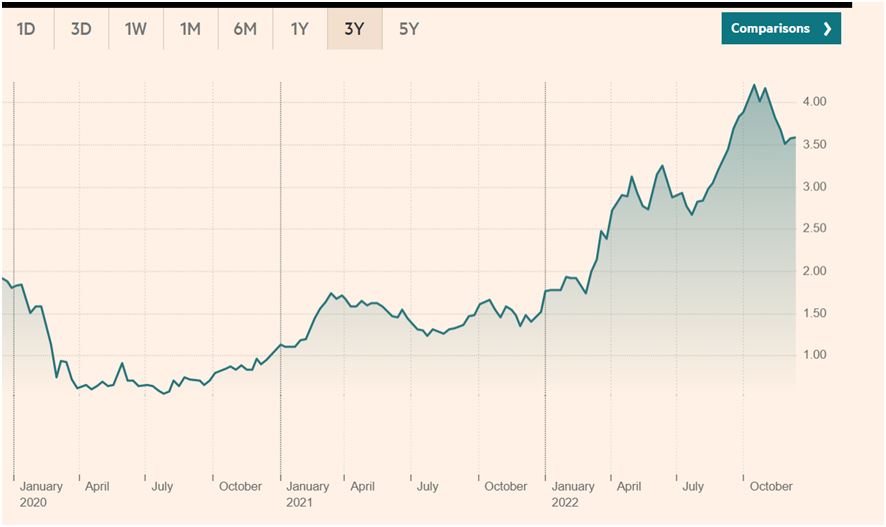
With the massive issuing of Treasury Bonds to finance the huge U.S. government borrowing mentioned above, the price of U.S. Treasury bonds began to fall due to a huge increase in their supply. But the interest rate on a bond moves in exactly the opposite direction to its price – that is, as the price of U.S. Treasury bonds fell the interest rate paid on them rose. First, the interest rate on 10 year US Treasury yields began to rise – it had reached its lowest recent point at 0.5% in March 2020. Then the interest rate on two-year Treasury bonds began to rise rapidly, and this was then strongly propelled by the Federal Reserve raising its own interest rate – two-year Treasury Bond yields had reached their lowest recent point at 0.11% in February 2021. In July 2022, as already noted, two year interest rates rose above 10 year interest rates, inverting the yield curve. By 8 March 2023 the interest rate on a 10 year U.S. Treasury bond had risen from 0.5% to 3.98%, and the interest rate on a two year bond from 0.11% t0 5.09% – creating the 1.09% inversion of the yield curve.
Figure 3

The road to the bank collapses
These rises in interest rates then led directly to the bank collapses via two routes.
First, the sharp rise in interest rates on Treasury Bonds, and related financial instruments such as Municipal Bonds, was caused by their fall in price. Such bonds were held by banks as their “safest” assets. But this meant that the safest assets of these banks were falling sharply in value. As a result, if a bank had a large holding of such “safe” bonds its assets could became less than its liabilities – causing the bank to collapse. This was the chief reason for the collapse of SVB. SVB’s market value fell from $6 billion dollars to zero in a week.
Signature Bank was hit by another route – not through exposure to a “safe” asset but to one of the riskiest, that is crypto-currencies. Signature Bank, since 2018, was one of the few banks that accepted deposits of crypto assets. But crypto assets are subject to huge price fluctuations because they are not backed by physical assets – unlike, for example, gold. Rising interest rates already put the price of crypto assets under downward pressure and then they suffered a further deep crisis with the collapse of the FTX crypto exchange, which is at present the subject of a police investigation.
The rising interest rates, which were necessary because of the soaring inflation unleashed by the U.S. stimulus policies, therefore created a crisis in both “safe” and “risky” assets – bringing about the bank collapses.
Consequences for the U.S.
What, therefore, are the consequences and lessons of this latest U.S. financial crisis?
First, of course, it demolishes the propaganda claim by Biden and others that the U.S. economy and financial system was in excellent shape. Those who analysed that the U.S. stimulus packages were destabilising have definitely been proved correct.
Second, claims that since the 2008 financial crisis the stability of the U.S. financial system has been established have been proved to be false. Once again, a financial crisis has been ignited in the core of the U.S. financial system.
Third, while an economy cannot function without Treasury bonds it can perfectly well function without destabilising crypto-currencies and these should be eliminated.
Fourth, it is too early to say just how serious the damage will be to the U.S. financial system. But the collapse of a bank like SVB with over $200 billion in assets, the second largest bank collapse in U.S. history after the 2008 fall of Washington Mutual Bank with $307 billion in assets, is obviously a major financial event. Some of the direct effects can be controlled by U.S. Federal intervention at a cost – deposits at the banks will be guaranteed. The direct knock-on consequences are still not clear – at the time of writing share prices in a series of other U.S. banks were falling sharply.
But even if the direct consequences are dealt with there will also be indirect effects which are much harder to control. In particular the U.S. Federal Reserve will need to consider if its monetary tightening will create instability in the financial system. This is the reason that Goldman Sachs, for example, has speculated that the Federal Reserve will not raise interest rates as expected at its next meeting. Although Goldman Sachs may well be wrong on this specific issue, nevertheless undoubtedly the Federal Reserve will have to act with greater caution – which means that a lower priority will have to be given to raising interest rates, and other measures, to control inflation. And inflation, of course, is one of the most destabilising of all economic processes.
Lessons for China
Finally, there are clear lessons for China. The warnings about the dangers of the type of U.S. stimulus policies made by the present author and others have been entirely confirmed by events. But these damaging policies in the U.S. were rationalised by fundamental errors in economic theory – errors which are unfortunately repeated in sections of China’s media.
The most fundamental of these concerns the role of consumption in the economy – the erroneous idea that consumption is an input into production and can therefore be a contribution to GDP growth. This is false. Consumption, by definition, is not an input into production. Therefore, consumption is only part of the economy’s demand side, it is not part of the economy’s supply side. Investment, in contrast, is not only part of the economy’s demand side it is part of the economy’s supply side.
Statements such as “consumption contributed 75% to GDP growth”, or “consumption contributed 75% to GDP growth and investment 25%” are simply confused and false. The contribution of consumption to production, that is to the economy’s supply side, and therefore to GDP growth, is always precisely zero. The statement that “75% of GDP was consumed and 25% was invested” is correct but the statement “consumption contributed 75% to GDP growth and investment 25%” is false – none of the production was created by consumption. For clarity of thinking statements such as ““consumption contributed 75% to GDP growth” should simply be stopped being made as they create confusion. These issues are all dealt with in more detail in my previous article.
In the U.S. this false concept that consumption was a contribution to GDP growth was used to rationalise and justify a stimulus programme that was entirely based on increasing consumption and did nothing for investment. That is, there was a basic confusion regarding the difference between the demand side of the economy, of which consumption is a part, and the supply, that is the production, side of the economy. The policies resulting from this confusion in turn unleashed an inflationary wave which destabilised the economy and led to the bank collapses.
I know some readers may think that the present author has spent time dealing with what might seem abstract questions of economy theory in articles. But as the bank collapses demonstrate these theoretical issues have extremely powerful and practical consequences. Marxism explains this real situation of the economy extremely clearly. As Marx noted it is production, not consumption or exchange, which is dominant: ‘The result at which we arrive is, not that production, distribution, exchange and consumption are identical, but that they are all elements of a totality, differences within a unity. Production is the dominant moment, both with regard to itself in the contradictory determination of production and with regard to the other moments. The process always starts afresh with production… exchange and consumption cannot be the dominant moments… A definite [mode of] production thus determines a definite [mode of] consumption, distribution, exchange.’[1]
The confusions of “Western”, in fact marginalist, economics in contrast allows the real situation to be obscured leading to such damaging results as the U.S. stimulus packages. To avoid such damaging consequences it is therefore crucial that such confusions do not circulate in China. Keeping the theoretical cupboard in good order is not an abstract but an extremely crucial practical issue – as the damage of the U.S. bank collapses graphically demonstrates.
—
[1] Economic Manuscripts of 1857-58 (Vol. Collected Works 28). London: Lawrence and Wishart p36.
The above article was originally published in Chinese at Guancha.cn and in English at Learning from China.

Recent Comments